0793
Quantitative susceptibility imaging to stage acute cerebral hemorrhages: A direct comparison of the mcTFI and MEDI methods1School of Medicine, Queen's University, Kingston, ON, Canada, 2Center for Neuroscience Studies, Queen's University, Kingston, ON, Canada, 3Radiology, Weill Cornell Medicine, New York, NY, United States, 4Neurology, Beth Israel Deaconess Medical Center, Harvard Medical School, Boston, MA, United States, 5Neurosurgery, Beth Israel Deaconess Medical Center, Harvard Medical School, Boston, MA, United States, 6Radiology, Beth Israel Deaconess Medical Center, Harvard Medical School, Boston, MA, United States
Synopsis
The perceived acuity (hyperacute, acute, subacute) of intracerebral hemorrhage (ICH) dramatically impacts patient management. While CT and standard MRI are limited for staging ICH, Quantitative Susceptibility Imaging (QSM) has shown promising results for tracking the evolution of ICH, as a substrate for the pathophysiology within bleeds. Here, we compare novel multi-echo complex total field inversion (mcTFI) QSM for staging ICHs, in comparison to conventional Morphology Enabled Dipole Inversion (MEDI). mcTFI better distinguished hyperacute/acute timepoints from subacute ICHs, in comparison to MEDI, likely as a result of the robust inversion computation, inherently reducing susceptibility quantification errors and shadowing artifacts.
BACKGROUND
The perceived acuity (hyperacute, acute, subacute, chronic) of intracerebral hemorrhage (ICH) dramatically impacts decisions about patient management, in efforts to minimize complications associated with disability and mortality (1, 2). While effective for detecting ICHs, both CT and routine MRI have areas of uncertainty for estimating ICH acuity (3). Alternatively, GRE based MRI techniques including Quantitative Susceptibility Imaging (QSM) have been shown to more reliably track evolution of ICH blood products, as a substrate for staging the pathological process underlying ICHs (4–8). Changes within the hemorrhaged lesion reflect variations in susceptibility of the cerebral tissues, which are driven by pathological iron accumulation within the blood transitioning between different isoforms based on the degradation of blood products (9, 10).In recent years, the development of quantitative susceptibility mapping (QSM) (11–15) techniques such as Morphology Enabled Dipole Inversion (MEDI) (16, 17) has been shown to reliably distinguish blood from calcification (18), and to effectively track evolution of ICH blood products (4–8). Despite those advancements however, MEDI-based QSM has also been shown to have areas of signal drop out, leading to non-visualized brain, which can contain ICHs (19). In earlier work using Total Field Inversion (TFI) QSM clinically (20), it was shown that the TFI algorithms resulted in fewer areas of non-visualized brain, when compared to MEDI (19), although some artifact areas were still visible.
PURPOSE/HYPOTHESIS
In this study, we investigate the use of multi-echo complex total field inversion (mcTFI) QSM for staging ICHs, in comparison to conventional Morphology Enabled Dipole Inversion (MEDI) methods. It was hypothesized that single-step mcTFI-QSM algorithms would improve the visualization of brain parenchyma and susceptibility characterization used for distinguishing ICH acuity as a result of robust inversion computation of the phase to susceptibility relationship, inherently reducing susceptibility quantification errors and ICH artifacts.METHODS
121 subjects were enrolled following positive CT findings for ICHs. Prior to enrollment, all participants signed written informed consent review by the Institutional Review Board (IRB) for the Health Insurance Portability and Accountability Act (HIPPA)-compliant protocol. Subjects were grouped based on time between admission and follow-up MR data collection: hyperacute (<24 hours), acute (1-3 days), early subacute (3-7 days) and late subacute (7-18 days) (Figure 1).All MRI data were collected on a GE Healthcare Discovery MR750 system (GE Corporation, USA) at 3.0 T using a 32-channel head coil. The standard MR-based protocol for this study included a three-dimensional T1-weigthed magnetization-prepared rapid gradient echo (MPRAGE) axial scan and a multi-echo axial GRE sequence (first echo time, 3.648 msec; echo spacing, 3.984 msec; 11 echoes; repetition time, 47.424 msec; pixel bandwidth, 62.5 kHz; voxel size, 0.5 x 0.5 x 1 mm3; flip angle, 12°; acquisition matrix, 256 x 256; reconstruction matrix, 512 x 512; parallel imaging; total scan time, 4 minutes 30 seconds). All QSM images were reconstructed twice from the raw multi-echo GRE data, once using the MEDI approach (16, 17, 21), and second, using the mcTFI method (22).
In order to provide a more quantitative index for CT within the ROI, as opposed to a simple ROI mean of the CT intensity within the hemorrhaged lesion, we computed a CTindex (Eq.(1)) derived based on the cumulative sum of the ratio between the average CT within the bleed, and mean CT within each of the three tissue types (3), extracted using automated 3D segmentation (23).
$$$ CTindex = sum[(CTbleed/CTGM) + (CTbleed/CTWM) + (CTbleed/CTCSF)] Eq.(1) $$$
Conceptually, Eq.(1) is based on well-established literature (reviewed in (3)) describing the appearance of blood on CT based on the stage of the bleed, as it transitions from hyperdense (CTindex >> 3) to isodense (CTindex ~ 3) between the hyperacute to subacute time period, respectively.
CTindex, MEDI- and mcTFI-based QSM susceptibility measurements were extracted from the hemorrhaged regions, segmented using a semi-automated approach (Figure 2). Group differences in imaging parameters were assessed using ANOVAs, followed by pairwise group comparisons using independent T-tests. Linear regressions between the CTindex, MEDI and mcTFI within the hemorrhaged lesion were used to assess the relationship between each parameter.
RESULTS
Significant changes in blood susceptibility were found over time for both the MEDI (P = 0.043) and mcTFI (P = 0.001) measurements, although mcTFI better separated the hyperacute/acute to subacute stages (Figure 3). Mean CTindex values within the ICH were more strongly correlated linearly with mcTFI (r = 0.727, P < 0.0001) than MEDI (r = 0.412, P < 0.0001) QSM (Figure 4).DISCUSSION
Significant differences in QSM measurements across staging groups were noted for both MEDI- and mcTFI-based reconstructions, although mcTFI better distinguished hyperacute/acute timepoints from subacute ICHs. mcTFI-based QSM signal intensity within the hemorrhage were more strongly correlated with predictable changes in the CTindex, in comparison to MEDI-QSM values, suggesting better alignment with conventional imaging used to evaluate cerebral bleeds at different stages within clinical settings. Altogether, these findings propose that mcTFI-based QSM may be more appropriate for direct estimation of local susceptibility as a tool to stage ICH acuity and quantitively monitor iron content variations over time, as a way to gather insight about the pathophysiological process underlying the development of hemorrhagic lesions in the brain and inform clinical management of ICH patients.Acknowledgements
Study funding provided by grants from the National Institute of Neurological Disorders and Stroke (grant number: 1R21NS109728-01A1), as well as the Radiological Society of North America Research Scholar award. AAC would also like to acknowledge funding from the Ruth Taylor Research Scholar Studentship Award (Queen’s University, Kingston, ON, Canada).References
1. Statistics Canada. Table 102–0561 – Leading causes of death, total population, by age group and sex, Canada. CANSIM (death database) [Internet]. Ottawa (Ontario): Statistics Canada.
2. Feigin VL, Lawes CM, Bennett DA, Barker-Collo SL, Parag V: Worldwide stroke incidence and early case fatality reported in 56 population-based studies: a systematic review. Lancet Neurol 2009.
3. Kidwell CS, Wintermark M: Imaging of intracranial haemorrhage. Lancet Neurol 2008; 7:256–267.
4. Sun H, Klahr AC, Kate M, et al.: Quantitative susceptibility mapping for following intracranial hemorrhage. Radiology2018; 288:830–839.
5. Wang Y, Liu T: Quantitative susceptibility mapping (QSM): Decoding MRI data for a tissue magnetic biomarker. Magn Reson Med 2015; 73:82–101.
6. Chang S, Zhang J, Liu T, et al.: Quantitative Susceptibility Mapping of Intracerebral Hemorrhages at Various Stages. J Magn Reson Imaging 2016; 44:420–425.
7. Deistung A, Schweser F, Wiestler B, et al.: Quantitative Susceptibility Mapping Differentiates between Blood Depositions and Calcifications in Patients with Glioblastoma. PLoS One 2013; 8.
8. Chen W, Zhu W, Kovanlikaya I, et al.: Intracranial calcifications and hemorrhages: Characterization with quantitative susceptibility mapping. Radiology 2014; 270:496–505.
9. Bradley WG: MR appearance of hemorrhage in the brain. Radiology 1993.
10. Wagner KR, Sharp FR, Ardizzone TD, Lu A, Clark JF: Heme and iron metabolism: Role in cerebral hemorrhage. J Cereb Blood Flow Metab 2003.
11. Haacke EM, Liu S, Buch S, Zheng W, Wu D, Ye Y: Quantitative susceptibility mapping: Current status and future directions. Magn Reson Imaging 2015.
12. Wang Y, Liu T: Quantitative susceptibility mapping (QSM): Decoding MRI data for a tissue magnetic biomarker.Magn Reson Med 2015.
13. Deistung A, Schweser F, Reichenbach JR: Overview of quantitative susceptibility mapping. NMR Biomed 2017.
14. Langkammer C, Schweser F, Krebs N, et al.: Quantitative susceptibility mapping (QSM) as a means to measure brain iron? A post mortem validation study. Neuroimage 2012; 62:1593–1599.
15. Wang Y, Spincemaille P, Liu Z, et al.: Clinical quantitative susceptibility mapping (QSM): Biometal imaging and its emerging roles in patient care. J Magn Reson Imaging 2017; 46:951–971.
16. Liu J, Liu T, De Rochefort L, et al.: Morphology enabled dipole inversion for quantitative susceptibility mapping using structural consistency between the magnitude image and the susceptibility map. Neuroimage 2012; 59.
17. Liu T, Liu J, De Rochefort L, et al.: Morphology enabled dipole inversion (MEDI) from a single-angle acquisition: Comparison with COSMOS in human brain imaging. Magn Reson Med 2011; 66.
18. Soman S, Lee K, Selim M, et al.: Improved Cerebral Microbleed vs Calcification Discrimination using QSM compared to SWI Phase Maps. In ISMRM; 2020.
19. Soman S, Liu Z, Kim G, et al.: Brain injury lesion imaging using preconditioned quantitative susceptibility mapping without skull stripping. In Am J Neuroradiol; 2018.
20. Sun H, Wilman AH: Background field removal using spherical mean value filtering and Tikhonov regularization.Magn Reson Med 2014; 71:1151–1157.
21. Liu T, Wisnieff C, Lou M, Chen W, Spincemaille P, Wang Y: Nonlinear formulation of the magnetic field to source relationship for robust quantitative susceptibility mapping. Magn Reson Med 2013; 69.
22. Wen Y, Nguyen T, Cho J, Spincemaille P, Wang Y: Improved signal modeling in Quantitative Susceptibility Mapping using multi-echo complex Total Field Inversion (mcTFI). In Proc Intl Soc Mag Reson Med; 2020:28.
23. Zhang Y, Brady M, Smith S: Segmentation of brain MR images through a hidden Markov random field model and the expectation-maximization algorithm. IEEE Trans Med Imaging 2001; 20:45–57.
Figures
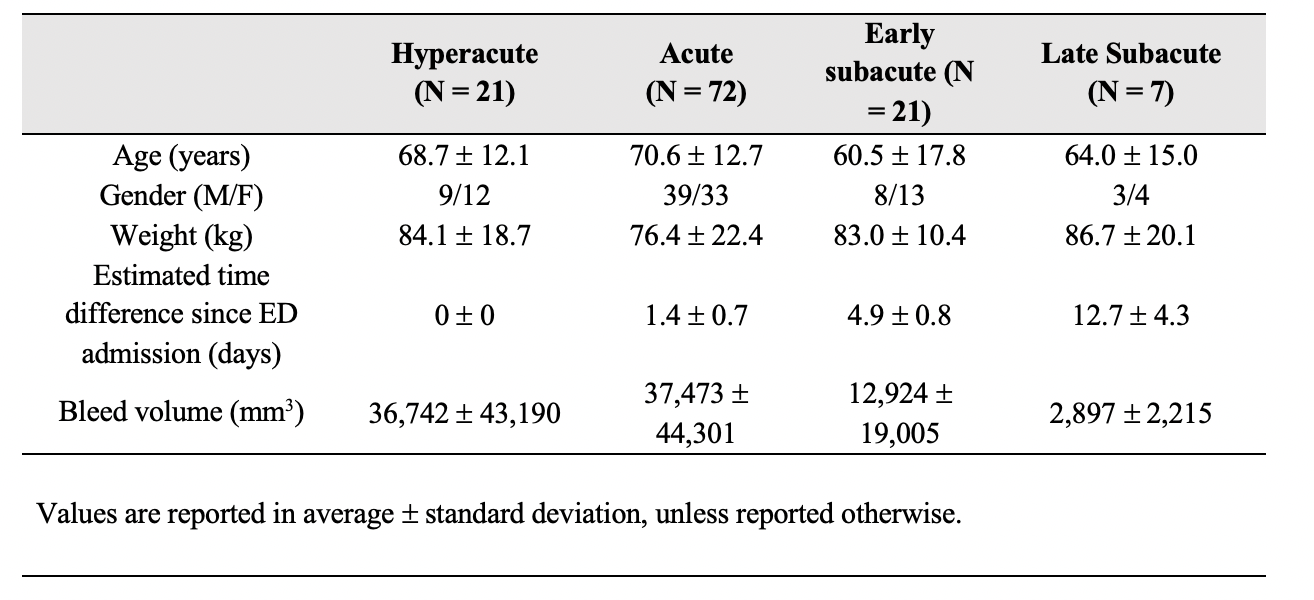
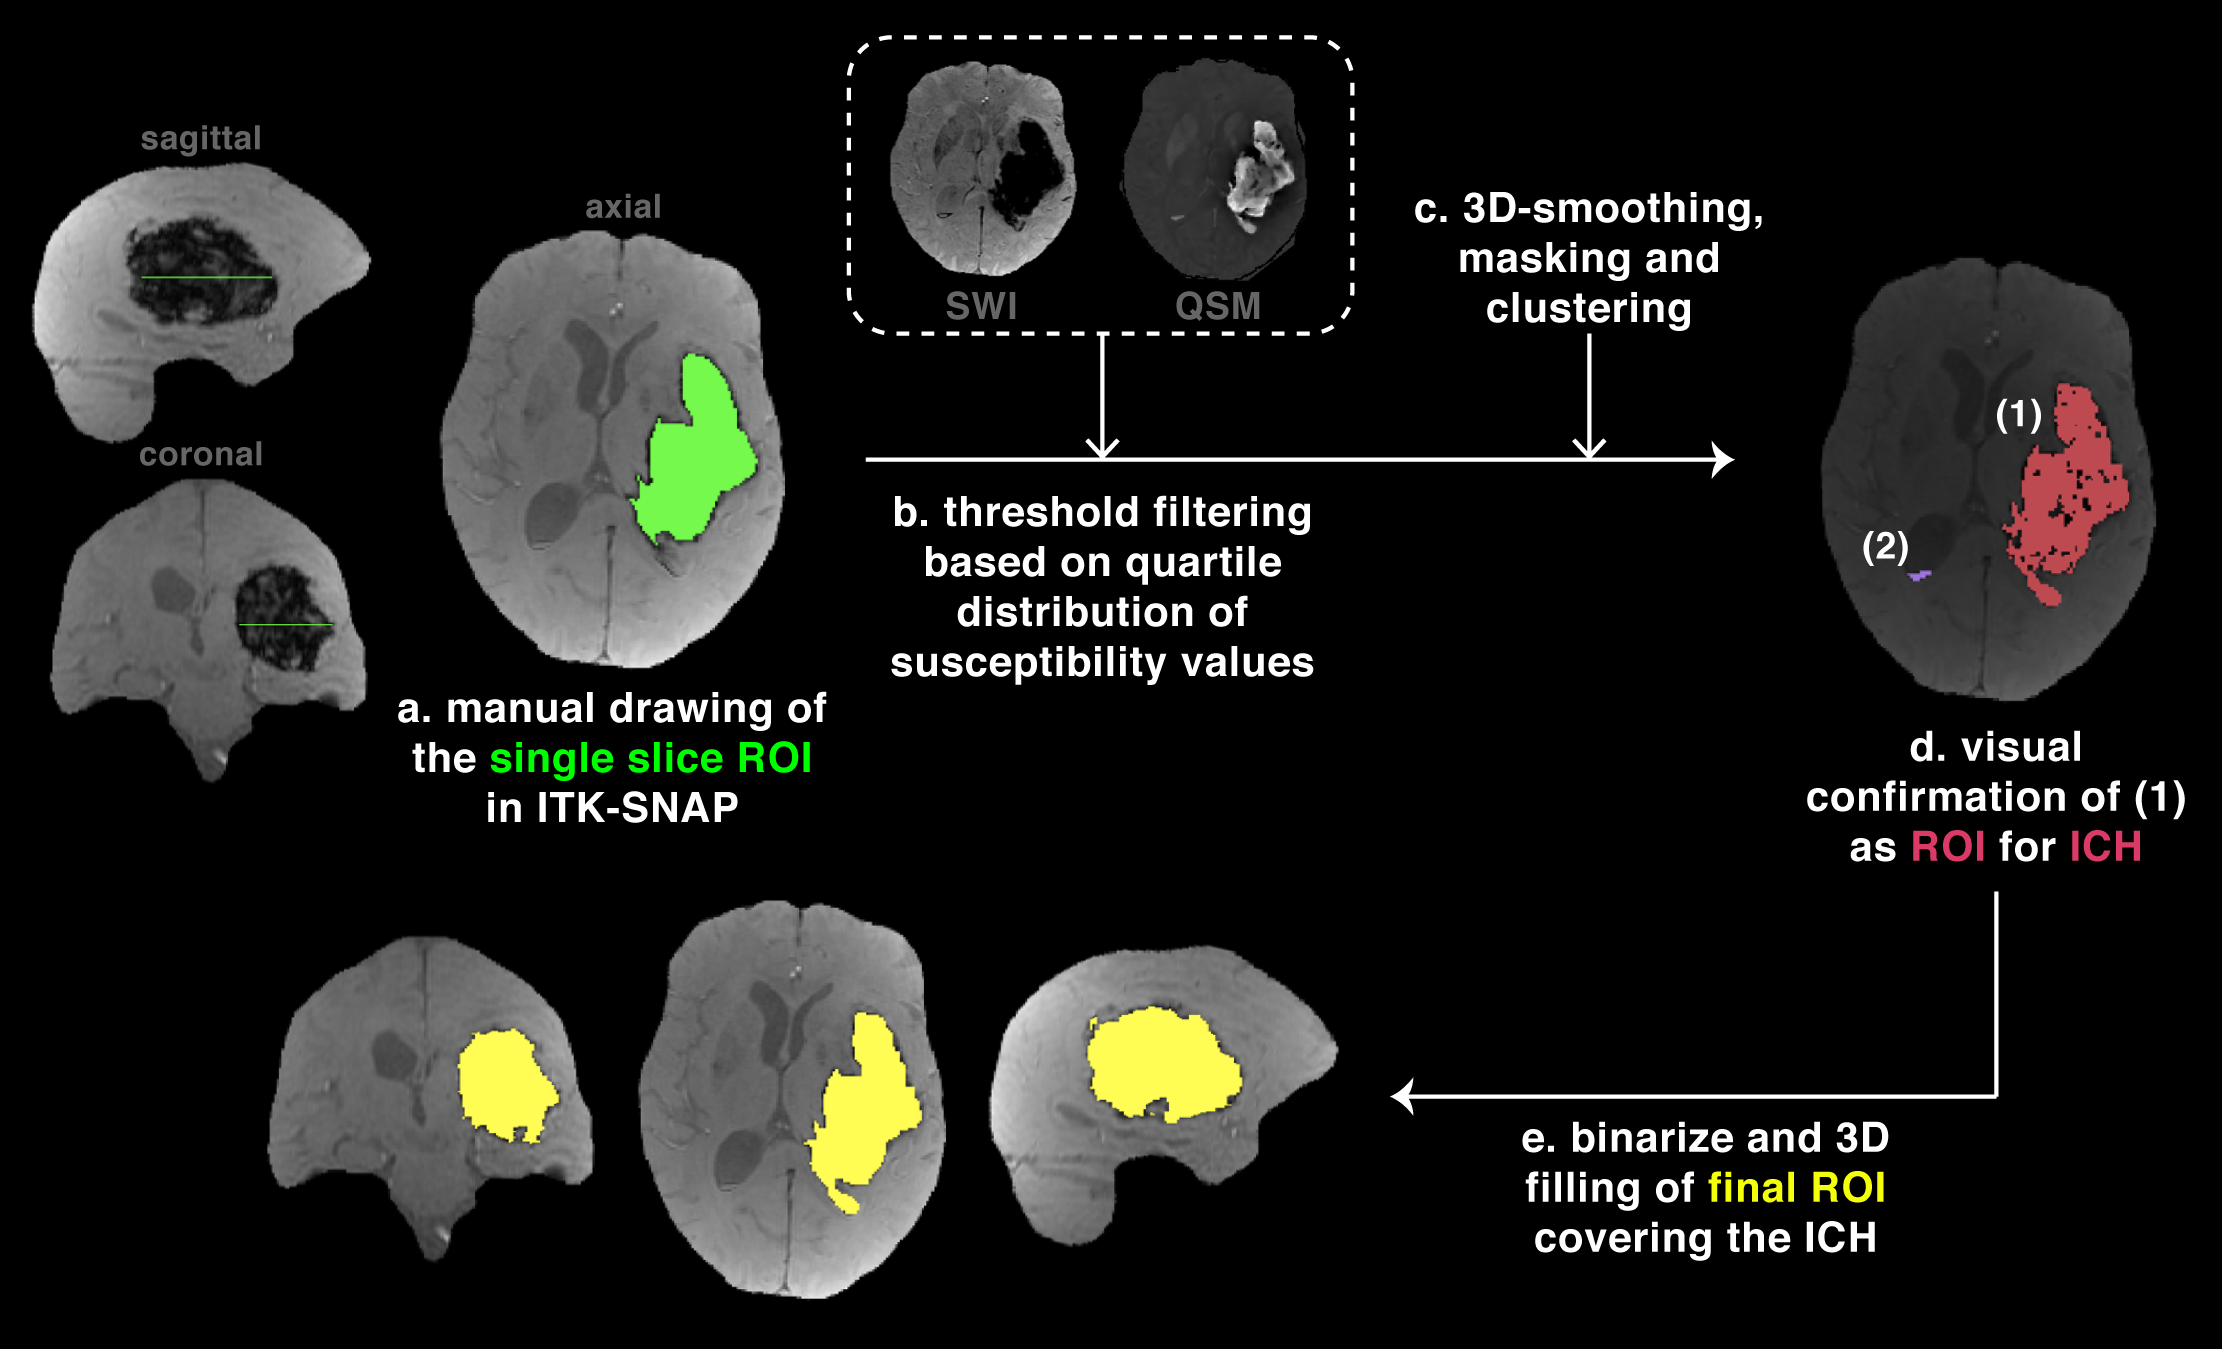
Figure 2. Semi-automated segmentation
The region of interest (ROI) for the intracerebral hemorrhage (ICH) was segmented using a semi-automated approach. A reference slice was drawn (a), from which threshold filtering was derived based on the quartile distributions of susceptibility values (b). Imaging filtering was followed by smoothing, masking and clustering (c) to map ICH candidates (d). The output was binarize and filled to create a 3D mask of the final ROI covering the ICH of interest (e).
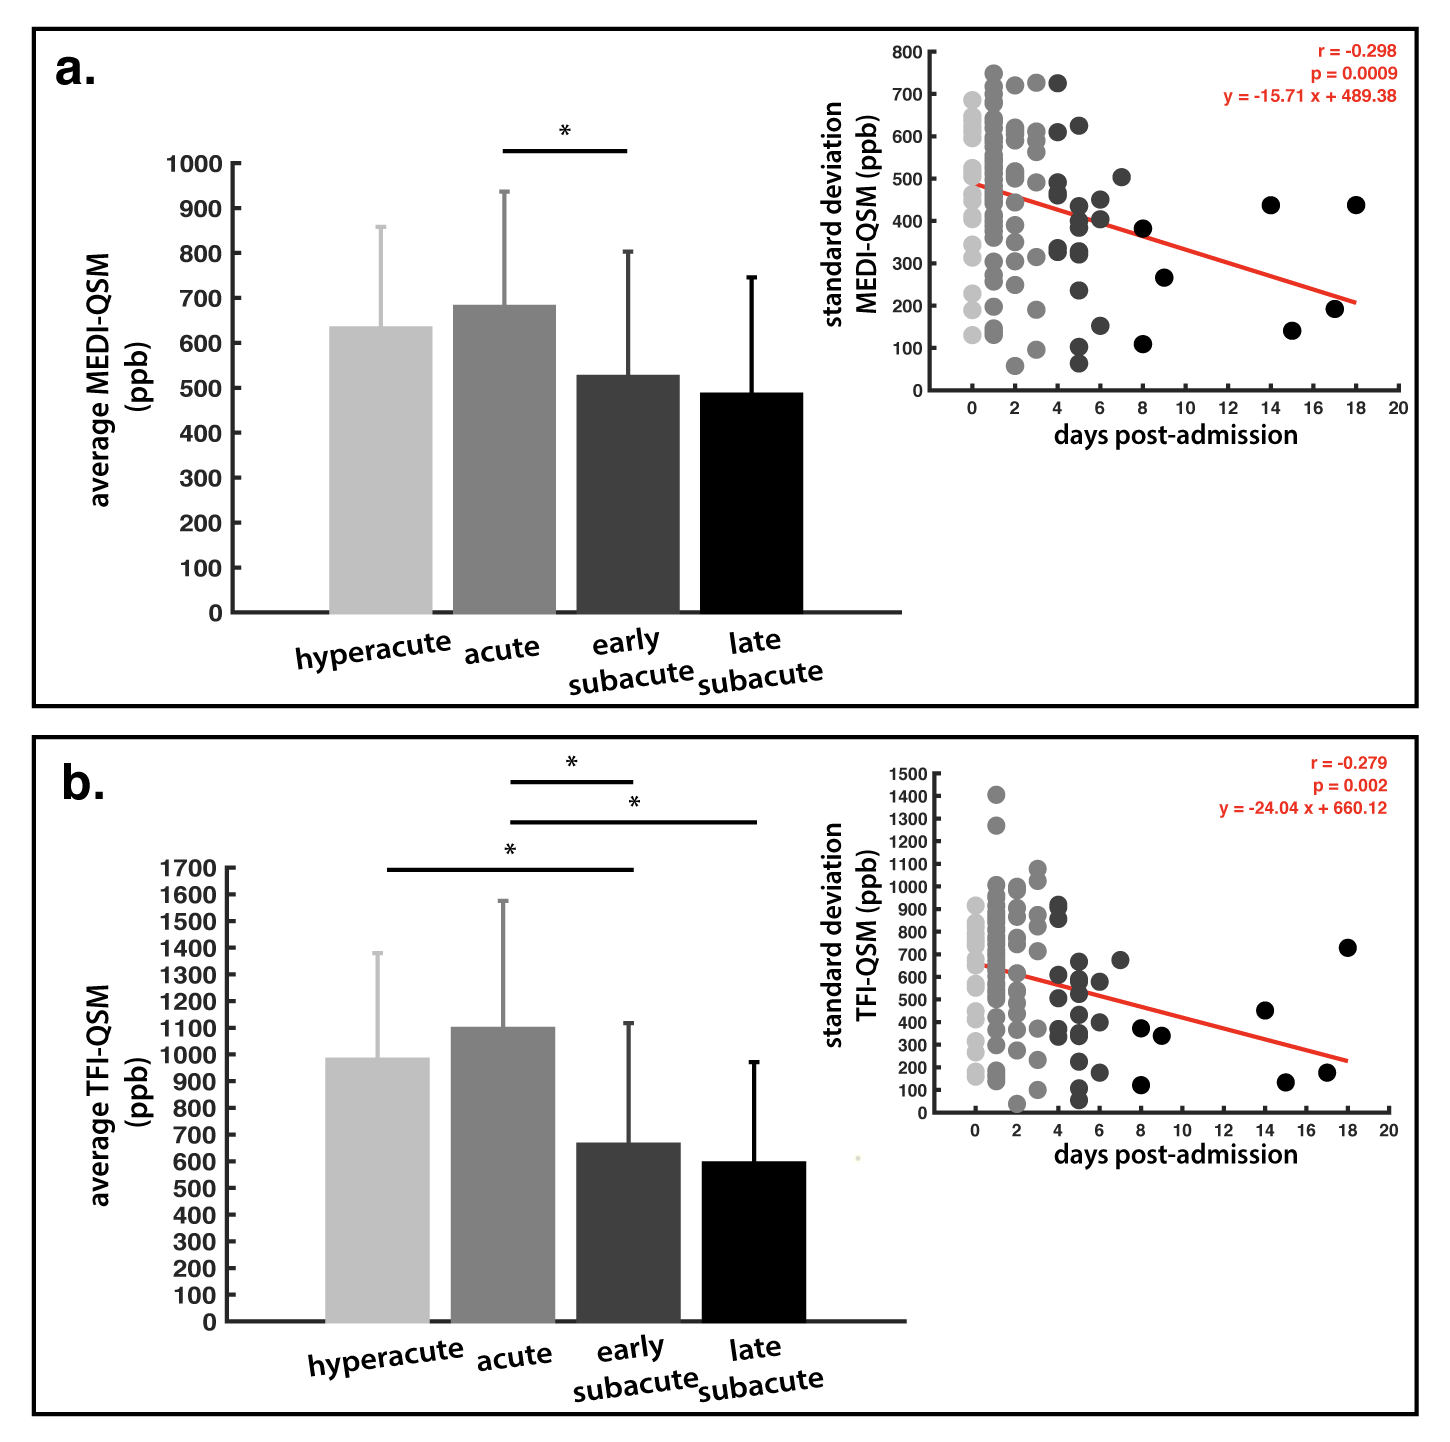
Figure 3. Statistical results
ANOVA results from comparisons of quantitative susceptibility mapping (QSM) within the segmented lesion based on the staging groups. The linear regression between the region of interest standard deviation (red line) and estimated days post-admission is shown (top corner). (a) Morphological Enabled Dipole Inversion (MEDI) method (PANOVA = 0.043), (b) Total Field Inversion (TFI) method (PANOVA = 0.0004). * = denotes statistical significance for post-hoc comparisons.
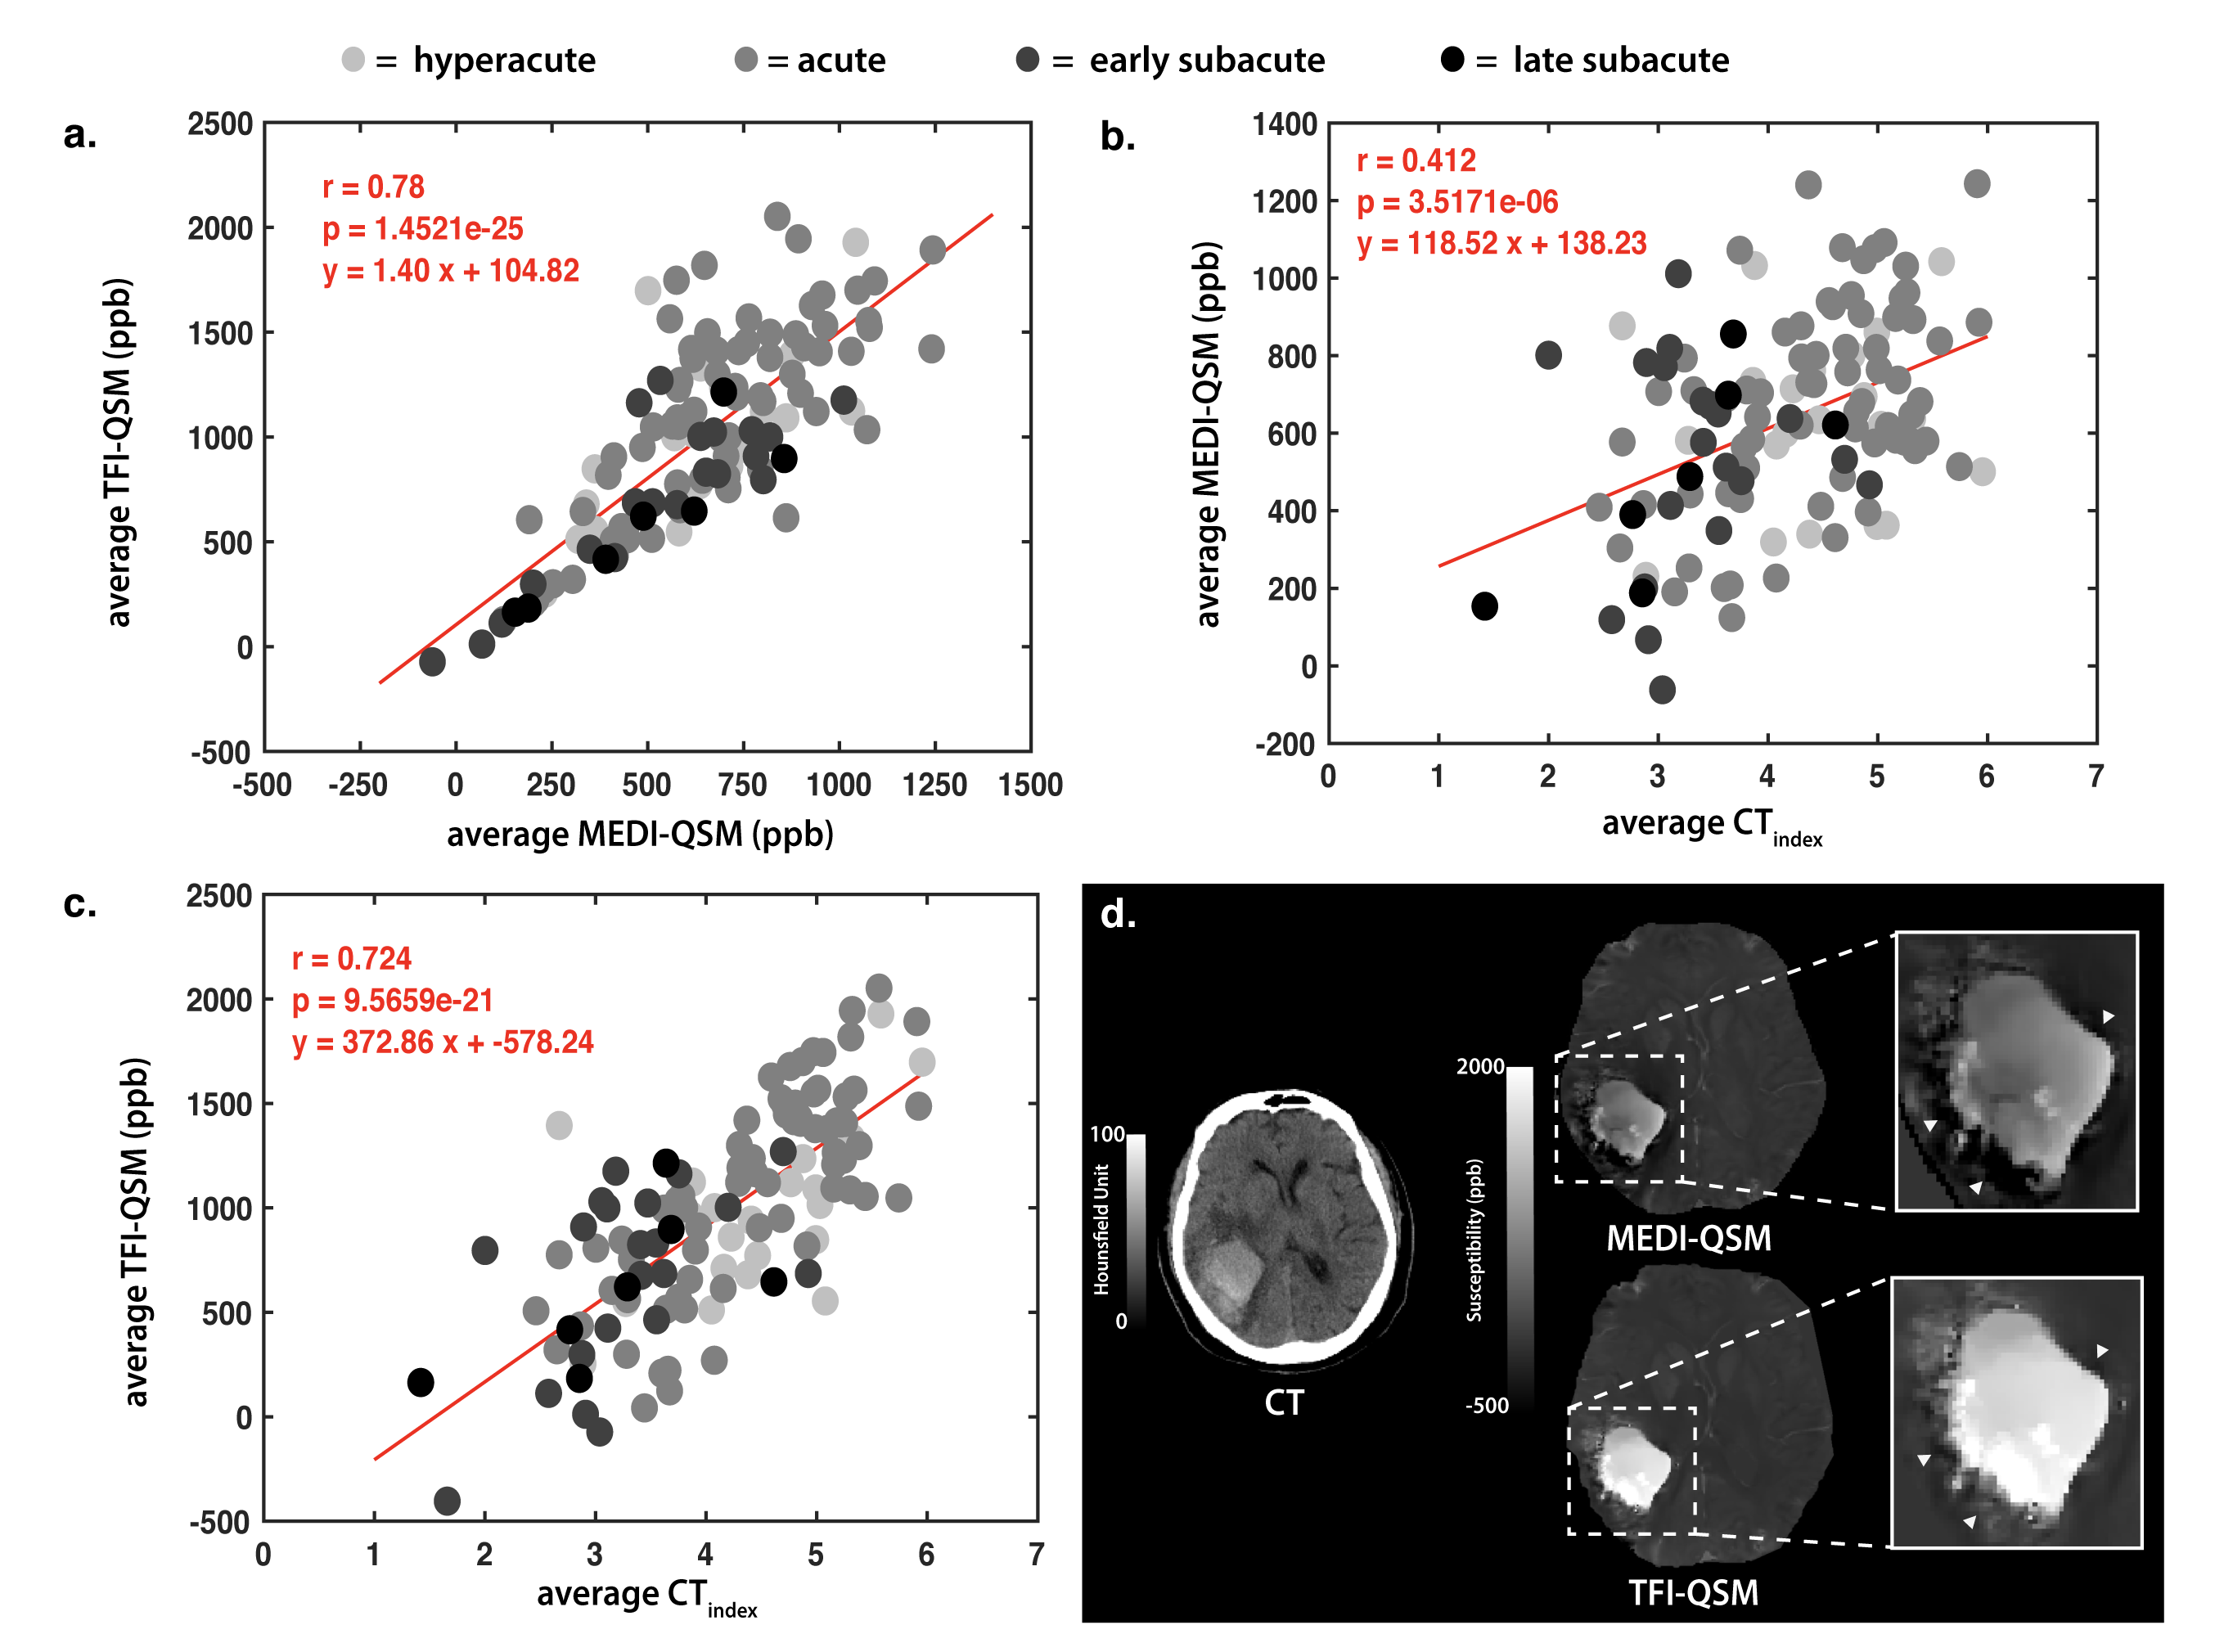
Figure 4. Comparison of MEDI and TFI measurements within the hemorrhagic lesion
Linear regressions between the Total Field Inversion (TFI) Quantitative Susceptibility Mapping (QSM) against the Morphological Enabled Dipole Inversion (MEDI) reconstruction (a), the MEDI-QSM against the CTindex (b), and the TFI-QSM against the CTindex (c) within the lesion. In (d), the shadowing artifact is shown around the hemorrhaged region using the MEDI reconstruction (top) , which is improved in TFI (bottom).