0792
Preconditioned water–fat total field inversion: application to spine quantitative susceptibility mapping (QSM)1Department of Diagnostic and Interventional Radiology, School of Medicine, Klinikum rechts der Isar, Technical University of Munich, Munich, Germany, 2Department of Diagnostic and Interventional Neuroradiology, School of Medicine, Klinikum rechts der Isar, Technical University of Munich, Munich, Germany, 3TUM-Neuroimaging Center, Klinikum rechts der Isar, Technical University of Munich, Munich, Germany, 4Department of Diagnostic and Interventional Radiology, University Hospital Ulm, Ulm, Germany, 5Philips Research Lab, Hamburg, Germany, 6Philips Healthcare, Hamburg, Germany
Synopsis
Body-QSM remains challenging for various reasons including, (a) the incomplete separation of background- and local-fields included by assumed approximations,(b) incorrect modeling at low-SNR-voxels included by linear modeling of the inverse problem and (c) streaking artifacts. A recently developed total-field-inversion (TFI) QSM method that directly estimates the susceptibility from multi-echo data showed significant alleviation of the above artifacts. However, the original TFI method can only be applied to regions with one species. This work proposes a QSM method that directly estimates susceptibility from multi-echo data in regions where water and fat are present and demonstrates its advantages over former proposed methods.
Introduction
QSM in the body remains challenging for several reasons, including (a) background-field-removal (BFR)artifacts, (b) incorrect modeling of voxels with low SNR and (c) streaking-artifacts. Methods that separately perform BFR often suffer from an incomplete separation of background and local fields. A linear total-field-inversion (TFI) algorithm has been proposed to simultaneously estimate local susceptibility sources and perform the background field removal1 and reportedly overcomes the limitations of BFR and subsequent local field inversion (LFI). However, a linear QSM model has proven to be problematic in regions with low SNR2. A nonlinear QSM model has proven to improve modeling of low SNR voxels and to reduce streaking artifacts particularly in regions with strong susceptibility sources2, but is only able to perform a LFI.A recently proposed total-field-inversion method that directly estimates the susceptibility map from complex multi-echo data (mcTFI)3 reportedly combines the advantages of a nonlinear QSM-model and a total-field-inversion method by reducing BFR- and streaking-artifacts and noise amplification. However, the original mcTFI can only be applied to regions with one species. Therefore a method is required to estimate the susceptibility map from complex multi-echo data in regions where both water and fat are present.
Consequently, in this work a water–fat total-field-inversion (wfTFI) method that directly estimates the susceptibility map from complex multi-echo data in water–fat regions is developed and evaluated in the spine.
Methods
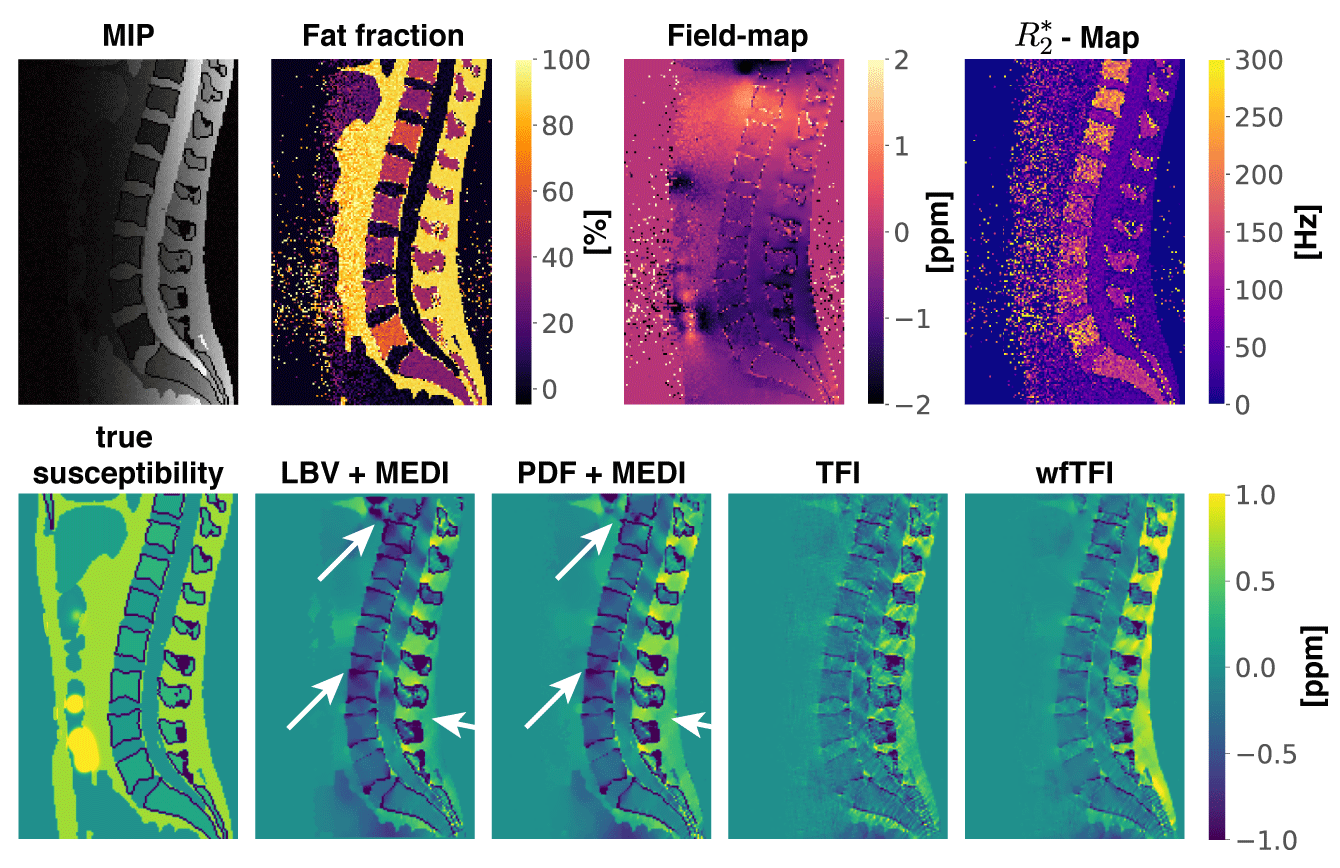
The proposed wfTFI algorithm consists of three main steps. First, the water- and fat-image, field-map and$$$\:{R_2^*}$$$-map were estimated using a recently proposed graph-cut-algorithm4. Second, a initial$$$\:\chi$$$-map in the background-region was estimated using the original TFI algorithm1. Finally, the susceptibility map was computed by estimating the susceptibility distribution directly from the complex multi-echo-data by using the well-established single-$$$R_2^*\:$$$multi-fat-peak water–fat signal model:$$y=\underset{y'}{\arg\min}=\sum_{j=1}^{N_{\text{echo}}}||(\rho_W+c_n\rho_F)e^{-R_2^*t_j}e^{it_j\;d\:{*}Py'}-S_j||_2^2+\lambda{||}M_g\nabla{P}y'||_1$$ $$c_n=\sum_{p=1}^{N_p}a_p e^{i \pi\Delta{f_p}t_j},\quad\text{with}\quad\sum_{p=1}^{N_p}a_p=1,$$ where $$$t_1,t_2,...,t_N$$$ are the different echo-times,$$$\:d$$$ is the dipole-kernel,$$$\:P$$$ is the preconditioner,$$$\:{M_G}\:$$$is the MEDI-like edge-mask5 and$$$\:\nabla\:$$$is the gradient-operation6,$$$\:\rho_W\:$$$and$$$\:\rho_F\:$$$are the complex signal of the water and fat components assuming to have an equal transverse relaxation-rate$$$\:{R_2}^*$$$. The final QSM map is computed as$$$\:\chi=Py$$$. The fat spectrum is assumed to have$$$\:{N_p}\:$$$spectral peaks with corresponding relative amplitudes$$$\:{a_p}\:$$$and chemical shift $$$\Delta{f_p}$$$. A multi-peak fat-model specific to bone-marrow was used7. The preconditioner was automatically adapted to the ROI following8. To investigate the performance of the wfTFI method a numerical simulation based on the Duke phantom was performed9. The whole body mesh data were converted into a three-dimensional volume corresponding to maps of$$$\:{1.5}\:$$$mm$$$^3$$$ isotropic resolution. Each tissue was assigned with either their literature value or values extracted from invivo scans. A fat-fraction-,$$$R_2^*$$$- and$$$\:\chi$$$-map were generated and forward-simulated to complex multi-echo-data. An additional parabolic signal-drop in posterior-anterior direction was added to account for the signal-drop observed in invivo body scans. Gaussian noise was added to the real and imaginary part of the echo-data with an SNR of. The proposed wfTFI-method was performed and compared to (a) the Laplacian boundary value (LBV)10 BFR-method and a LFI using MEDI2, (b) the projection onto dipole fields (PDF)11 BFR-method and a LFI using MEDI and (c) the original total-field-inversion (TFI) method1.Invivo measurements
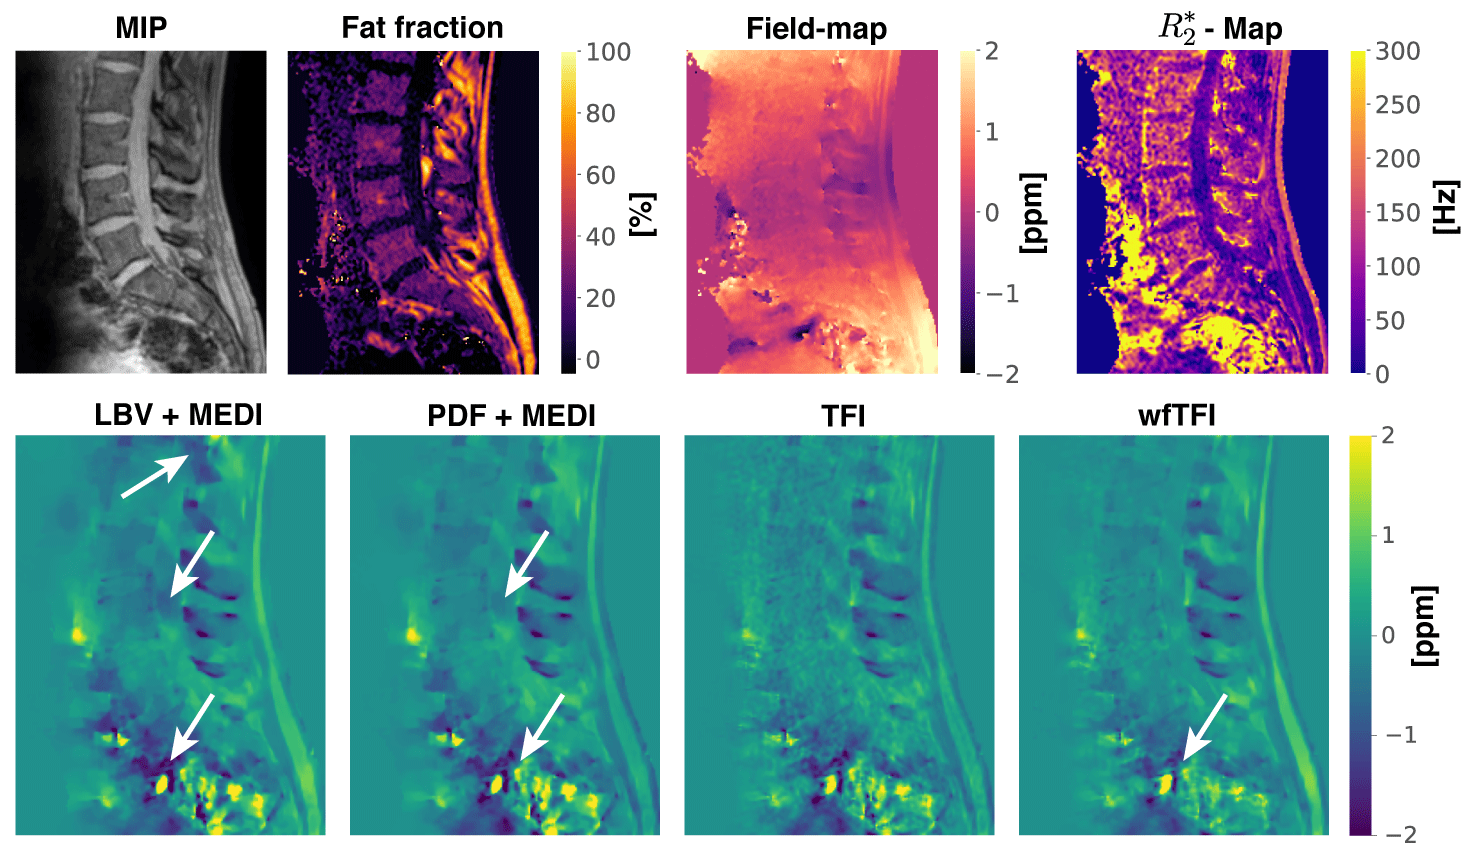
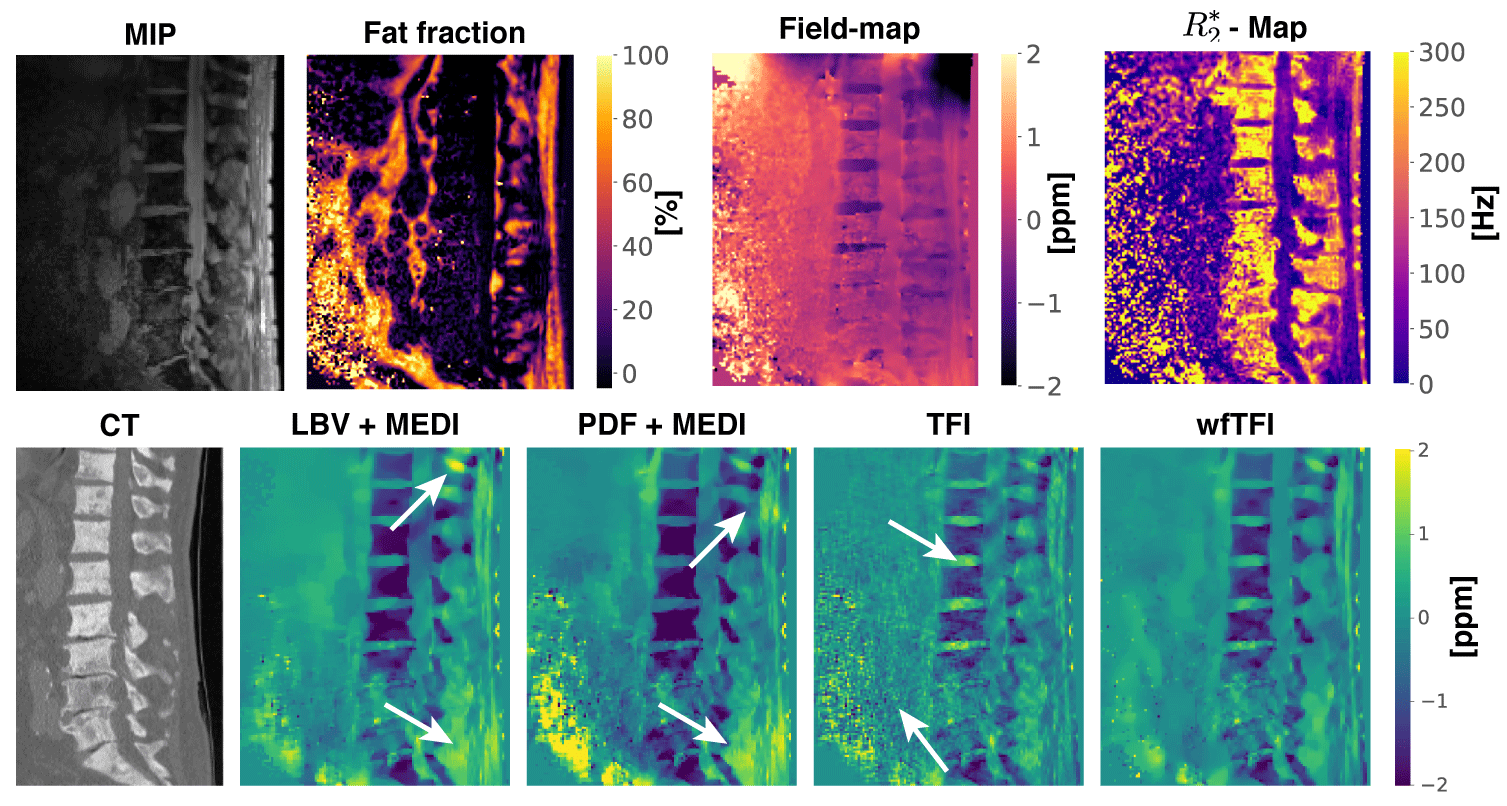
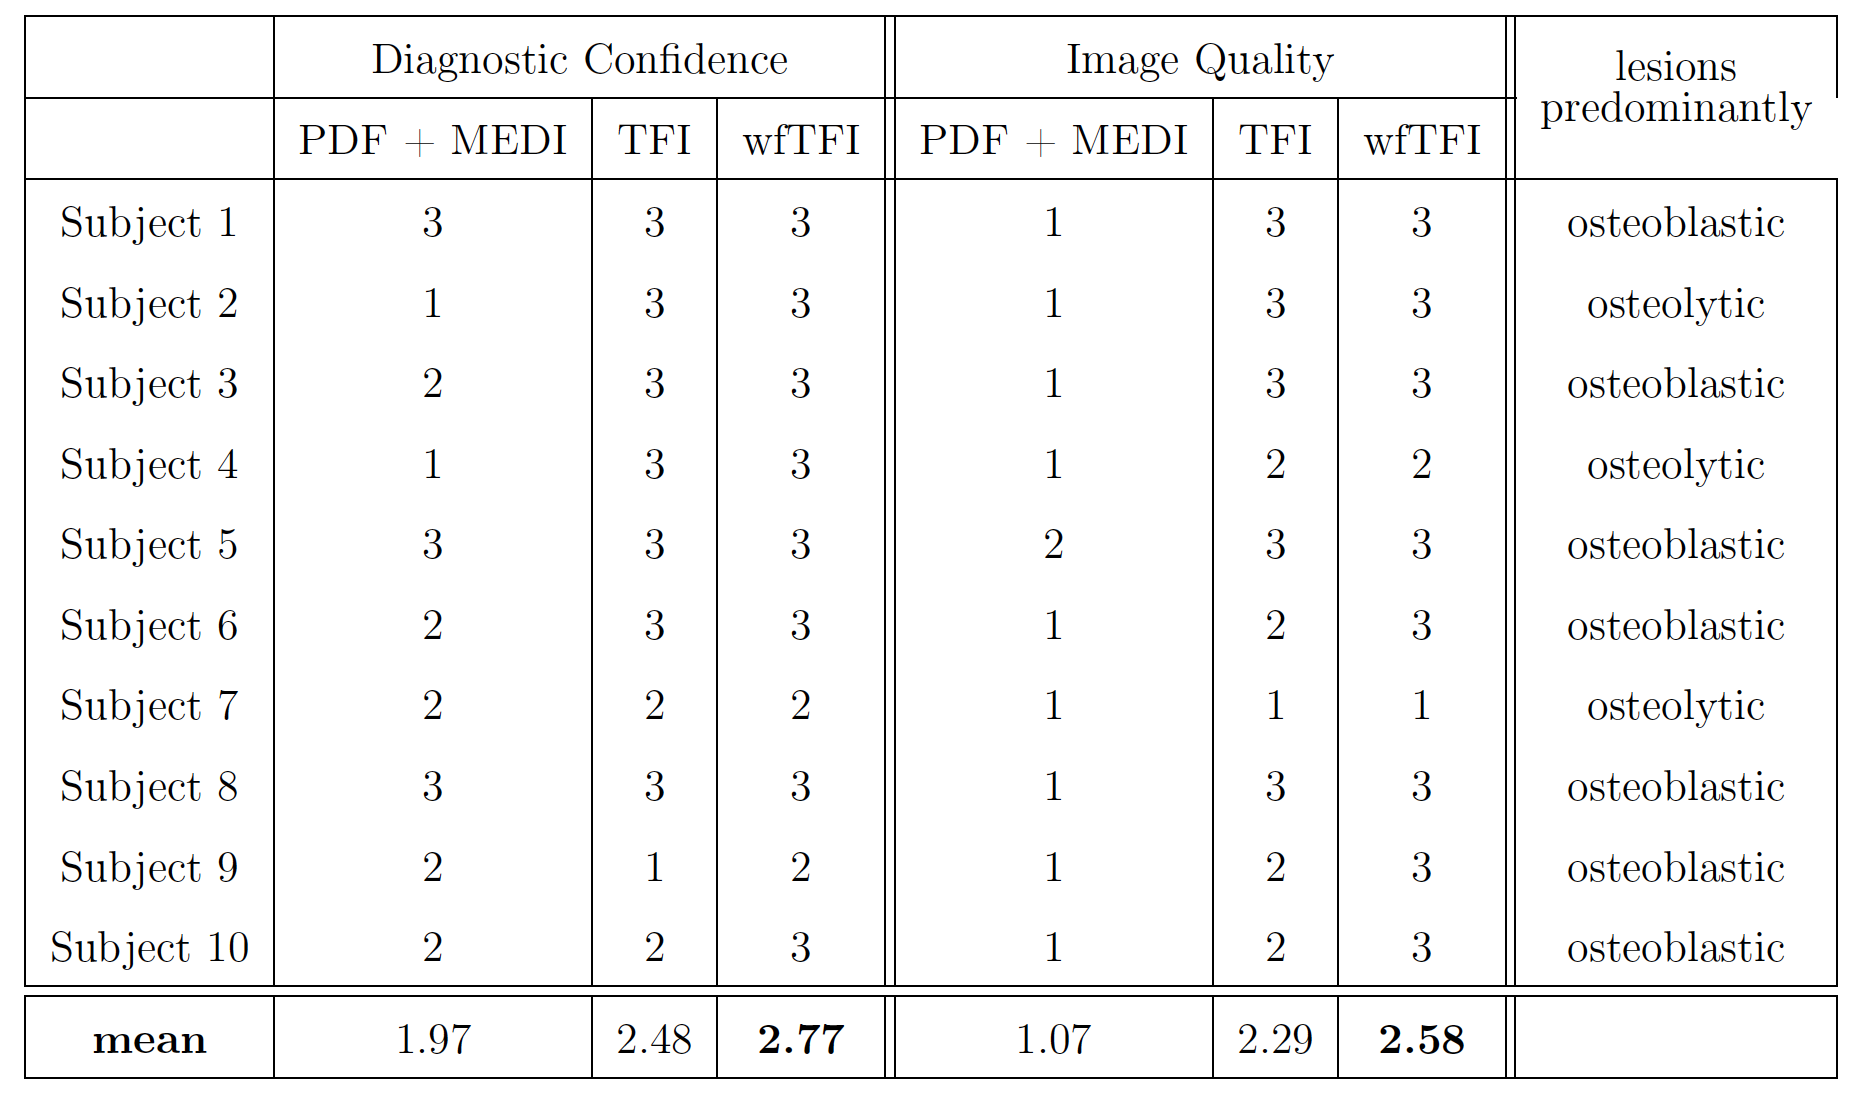
The aformentioned processing of graph-cut based field-mapping and water–fat separation followed by LBV+MEDI, PDF+MEDI, TFI and wfTFI QSM methods was applied to invivo spine scans of one healthy volunteer and$$$\:{10}\:$$$patients with metastatic disease. Scanning was performed on a $$$3\:$$$T scanner (Ingenia, Philips Healthcare) using a monopolar time-interleaved multi-echo gradient-echo sequence12, acquiring$$$\:{6}\:$$$echoes with$$$\:{3}\:$$$echoes per interleave. For all subjects the imaging parameters were set to TE$$$_{\text{min}}=1.12\:$$$ms,$$$\:\Delta$$$TE$$$=0.96\:$$$ms,FA$$$=3^{\circ}$$$,orientation = sagittal,readout-direction=anterior-posterior,FOV = $$$219.6\times 219.6\times{79.2}\:\text{mm}^3$$$ and an isotropic voxel-size of $$$1.8\:$$$mm$$$^3$$$. The$$$\:10\:$$$scans derived from the patients were evaluated and graded by two radiologists (board-certified radiologist with$$$\:11\:$$$years of experience and resident with$$$\:{8}\:$$$years of experience in neuroradiological imaging). The reading was performed in a consensus-like setting and the readers were strictly blinded to the reports created during clinical routine and the characteristics of the metastases (osteolytic/osteoblastic). Computed tomography$$$\:$$$(CT) severed as areference standard. The diagnostic confidence of the QSM methods to distinguish between osteolytic/osteoblastic changes was graded from$$$\:{1}\:$$$(low-confidence) to$$$\:{3}\:$$$(high-confidence) in addition to the overall image quality also graded from$$$\:{1}\:$$$to$$$\:{3}$$$.
Results
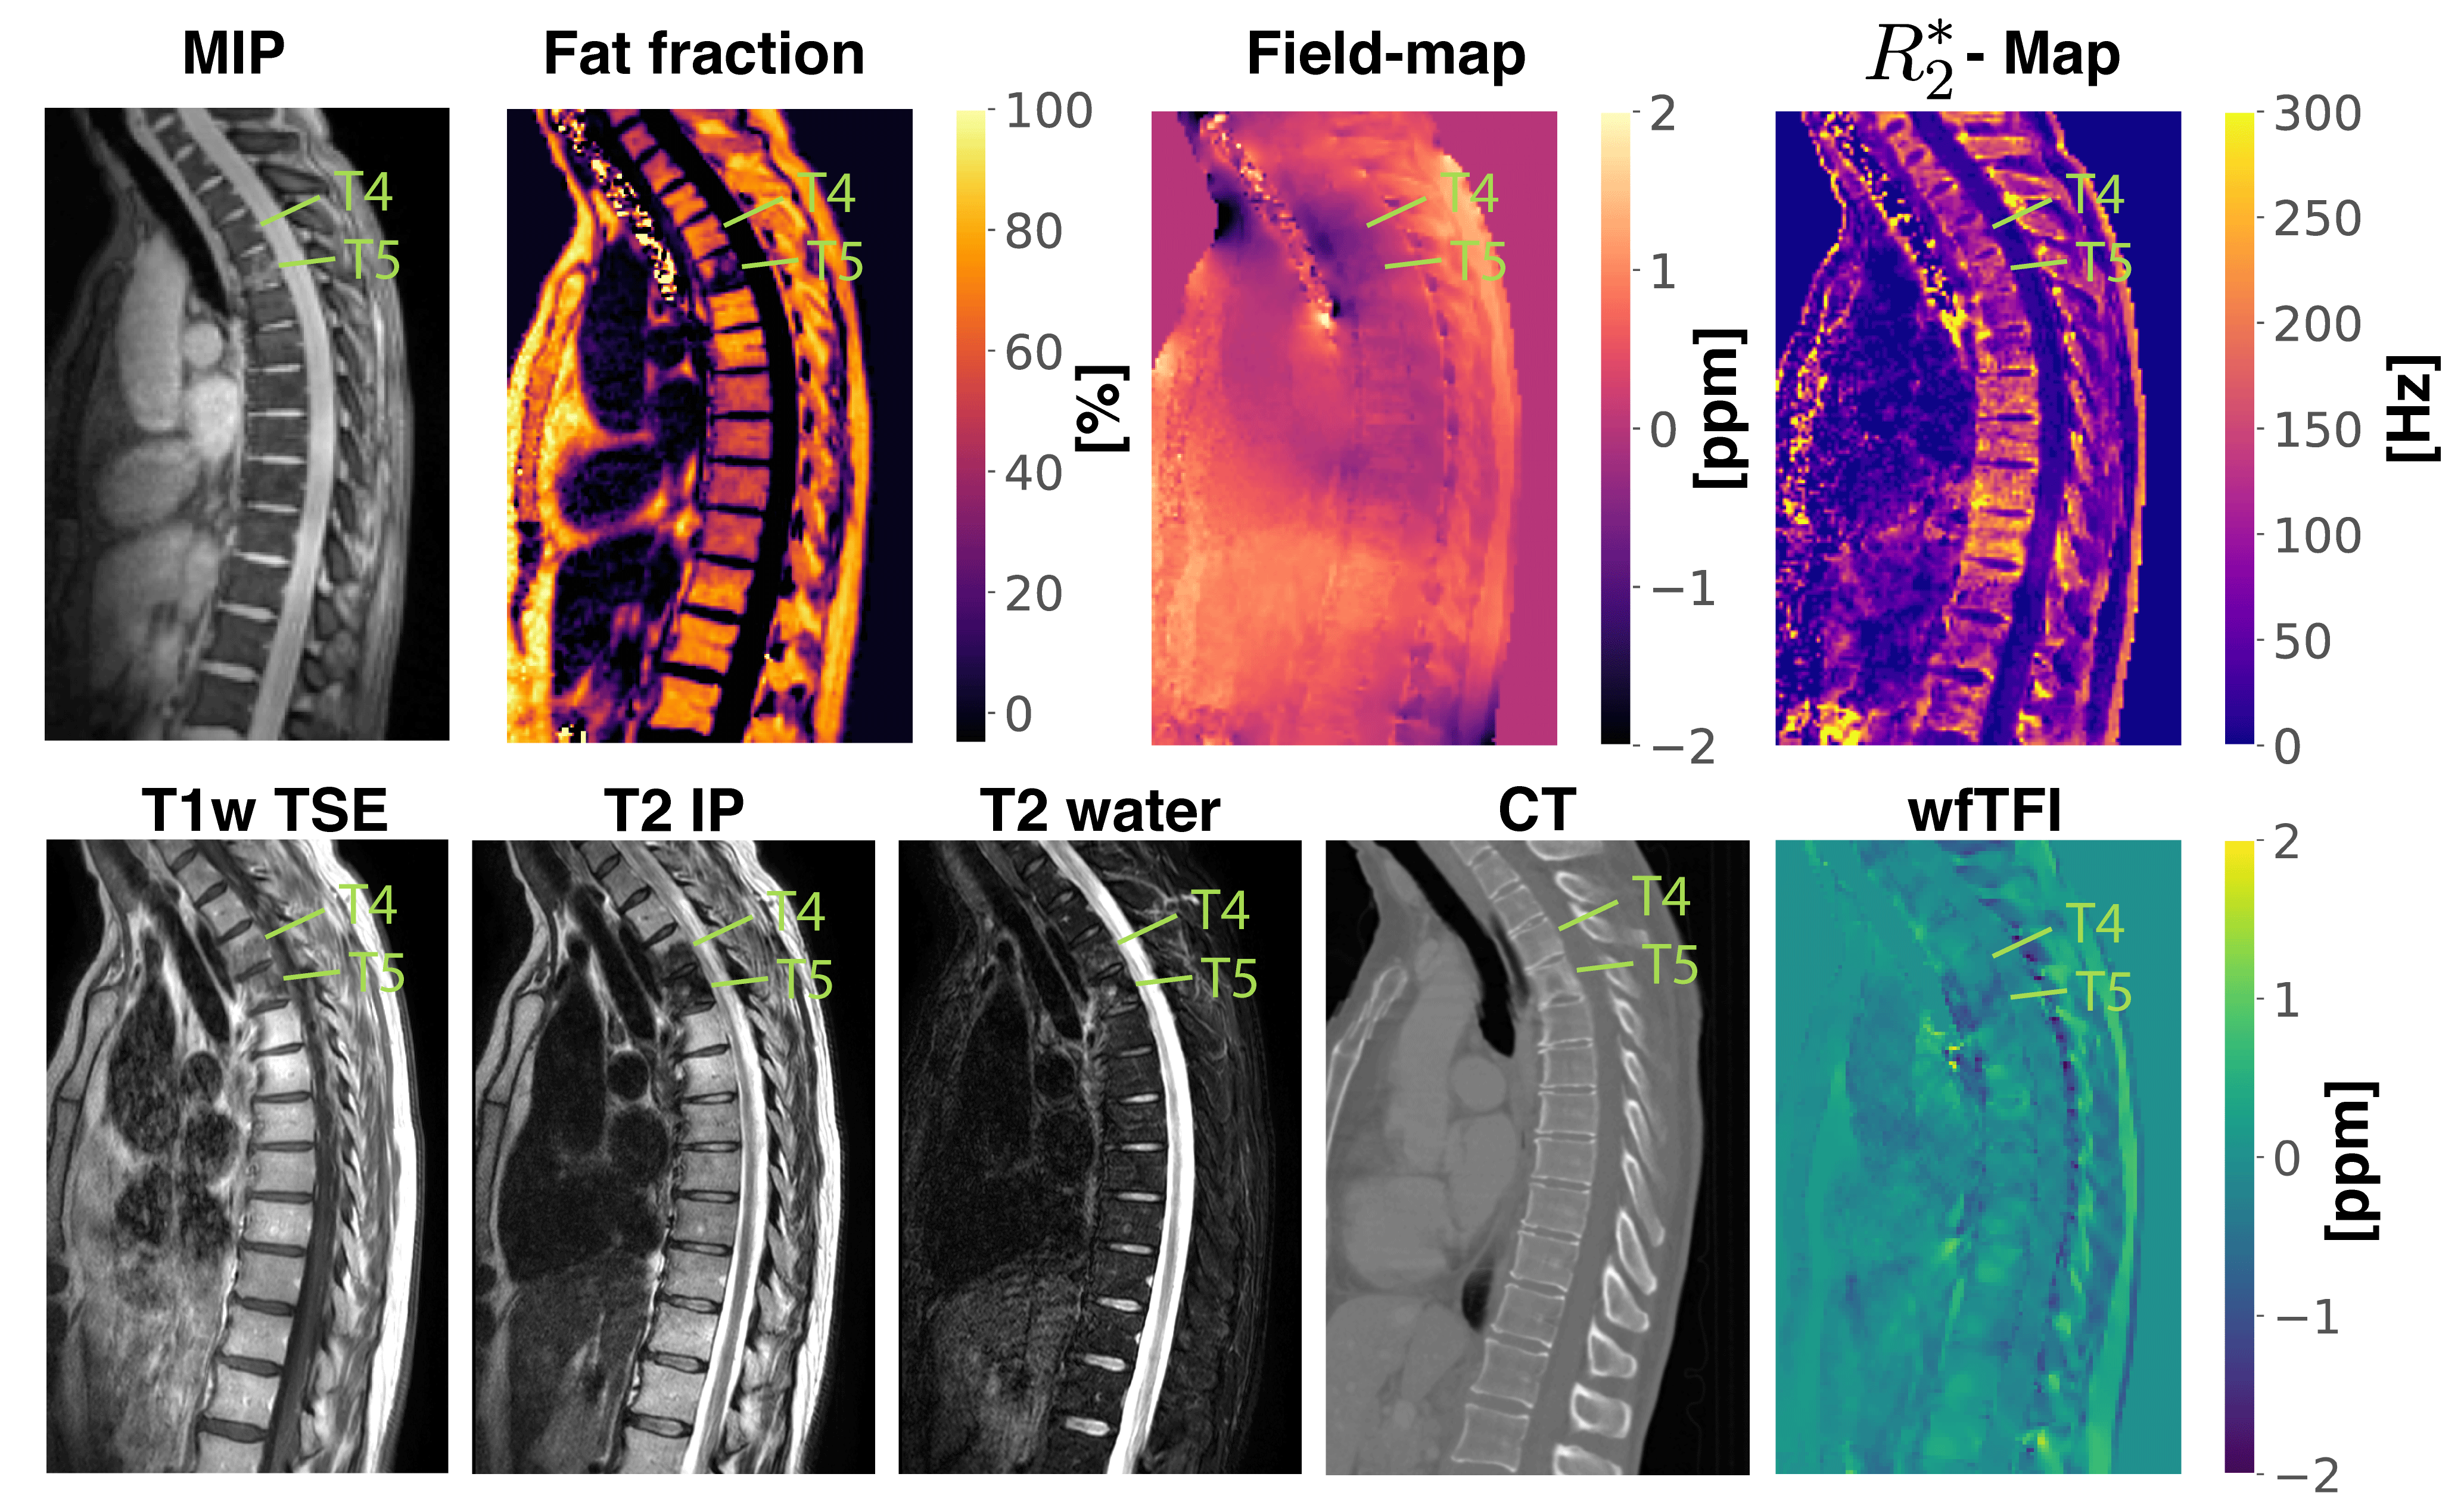
Separate BFR+LFI methods are challenged when applied to the spine anatomy both in simulation Fig.1 and in vivo Fig.2. The linear model of the original TFI shows enhanced noise and artifactual susceptibility values in proximity to strong susceptibility as in the IVDs in Fig.3. Fig.4 reveals the bone metastases in the$$$\:\text{T4}\:$$$and$$$\:\text{T5}\:$$$vertebra to be osteolytic while clinical routine images falsely indicate osteoblastic changes. The results of the reading show a mean diagnostic confidence for PDF+MEDI of$$$\:1.97/3,\:{2.48/3}\:$$$for TFI and$$$\:2.77/3\:$$$ for wfTFI. Further, the image quality of PDF+MEDI was estimated to be$$$\:1.07/3,\:{2.29/3}\:$$$for TFI and$$$\:{2.58/3}\:$$$ for wfTFI as shown in Fig.5.Discussion & Conclusion
The presently proposed preconditioned water–fat total-field-inversion method for QSM in water–fat regions showed the following significant improvements over former proposed QSM methods: (a) it significantly reduces background field artifacts, (b) noise amplification and (c) streaking artifacts. In the present study, the spine metastases in all subjects could be correctly graded to be predominantly osteolytic or osteoblastic based on the wfTFI while in standard$$$\:{T_1}\:$$$-and$$$\:{T_2}$$$-weighted spine MRI sequences the sensitivity to detect osteoblastic and osteolytic changes has been estimated to be $$$\:{89}\:\%$$$and$$$\:73\:\%$$$, respectively13. The proposed wfTFI method shows the potential to improve the robustness of QSM in water–fat regions.Acknowledgements
The present work was supported by the European Research Council (grant agreement No 677661, Pro-FatMRI). This work reflects only the authors view and the EU is not responsible for any use that may be made of the information it contains. The authors also acknowledge research support from DAAD (Projectnumber: 57514573) and Philips Healthcare.References
[1] Liu Z, Kee Y, Zhou D, Wang Y, Spince-maille P. Preconditioned Total Field Inversion (tfi) Method for Quantitative Susceptibil-ity Mapping. Magnetic Resonance in Medicine2016; 78:303–315. 10.1002/mrm.26331.
[2] Liu T, Wisnieff C, Lou M, Chen W, Spince-maille P, Wang Y. Nonlinear Formulation of theMagnetic Field To Source Relationship for Ro-bust Quantitative Susceptibility Mapping. Mag-netic Resonance in Medicine 2012; 69:467–476.10.1002/mrm.24272.
[3] Wen Y, Nguyen T, Cho J, Spincemaille P,Wang Y. Improved signal modeling in Quanti-tative Susceptibility Mapping using multi-echocomplex Total Field Inversion (mcTFI).In:Proceedings 28. Annual Meeting InternationalSociety for Magnetic Resonance in Medicine, on-line, 2020. p. 3200.
[4] Boehm C, Diefenbach MN, Makowski MR,Karampinos DC.Improved Body Quan-titative Susceptibility Mapping By Using aVariable-layer Single-min-cut Graph-cut forField-mapping. Magnetic Resonance in Medicine2020; nil:mrm.28515. 10.1002/mrm.28515.
[5] Liu T, Liu J, de Rochefort L, Spincemaille P,Khalidov I, Ledoux JR, Wang Y. MorphologyEnabled Dipole Inversion (medi) From a Single-Angle Acquisition: Comparison With Cosmos inHuman Brain Imaging. Magnetic Resonance inMedicine 2011; 66:777–783. 10.1002/mrm.22816.
[6] Wang Y, Liu T. Quantitative SusceptibilityMapping (QSM): Decoding MRI Data for a Tis-sue Magnetic Biomarker. Magnetic Resonance inMedicine 2014; 73:82–101. 10.1002/mrm.25358.
[7] Ren J, Dimitrov I, Sherry AD, Malloy CR.Composition of Adipose Tissue and MarrowFat in Humans By1h Nmr At 7 Tesla. Jour-nal of Lipid Research 2008; 49:2055–2062.10.1194/jlr.d800010-jlr200.
[8] Liu Z, Wen Y, Spincemaille P, Zhang S, Yao Y,Nguyen TD, Wang Y. Automated Adaptive Pre-conditioner for Quantitative Susceptibility Map-ping. Magnetic Resonance in Medicine 2019;83:271–285. 10.1002/mrm.27900.
[9] Gosselin MC, Neufeld E, Moser H, Huber E,Farcito S, Gerber L, Jedensjö M, Hilber I, Gen-naro FD, Lloyd B, Cherubini E, Szczerba D,Kainz W, Kuster N. Development of a New Gen-eration of High-Resolution Anatomical Mod-els for Medical Device Evaluation: the Vir-tual Population 3.0. Physics in Medicine andBiology 2014; 59:5287–5303.10.1088/0031-9155/59/18/5287.
[10] Zhou D, Liu T, Spincemaille P, Wang Y. Back-ground Field Removal By Solving the LaplacianBoundary Value Problem. NMR in Biomedicine2014; 27:312–319. 10.1002/nbm.3064.
[11] Liu T, Khalidov I, de Rochefort L, Spince-maille P, Liu J, Tsiouris AJ, Wang Y. ANovel Background Field Removal Method forMri Using Projection Onto Dipole Fields (pdf).NMR in Biomedicine 2011; 24:1129–1136.10.1002/nbm.1670.
[12] Ruschke S, Eggers H, Kooijman H, Diefen-bach MN, Baum T, Haase A, Rummeny EJ,Hu HH, Karampinos DC. Correction of PhaseErrors in Quantitative Water–Fat Imaging Usinga Monopolar Time-Interleaved Multi-Echo Gra-dient Echo Sequence. Magnetic Resonance inMedicine 2016; 78:984–996. 10.1002/mrm.26485.
[13] Böker SM, Adams LC, Bender YY,Fahlenkamp UL, Wagner M, Hamm B, Makowski MR.Differentiation of Predom-inantly Osteoblastic and Osteolytic SpineMetastases by Using Susceptibility-weightedMRI. Radiology 2019; 290:146–154. PMID:30375926, 10.1148/radiol.2018172727.
Figures