0791
Genetic associations of magnetic susceptibility in the brain1Wellcome Centre for Integrative Neuroimaging, FMRIB, Nuffield Department of Clinical Neurosciences, University of Oxford, Oxford, United Kingdom, 2Donders Institute for Brain, Cognition and Behaviour, Radboud University Nijmegen, Nijmegen, Netherlands, 3Sir Peter Mansfield Imaging Centre, School of Physics and Astronomy, University of Nottingham, Nottingham, United Kingdom, 4Department of Biomedical and Neuromotor Sciences, University of Bologna, Bologna, Italy, 5Department of Statistics and Actuarial Science, Simon Fraser University, Vancouver, BC, Canada
Synopsis
UK Biobank is scanning 100,000 participants using multi-modal MRI (including swMRI). This rich resource also includes genome-wide characterisation of individuals. This provides a powerful opportunity to relate swMRI-derived measures to genetics. The aim of this work is to identify genetic associations of QSM-based measures. We carried out genome-wide association studies (GWAS) in over 30,000 subjects for both QSM and T2* based measures. Our results demonstrate that susceptibility and T2* measures are associated with genetic loci involved in a range of biological functions. Susceptibility and T2* IDPs share many common genetic associations but there are also complementary associations.
Introduction
Susceptibility-weighted MRI (swMRI) provides quantitative measures of magnetic susceptibility via T2*-relaxometry and quantitative susceptibility mapping (QSM). Comparisons in ex-vivo tissue have demonstrated associations with tissue constituents including iron, myelin and calcification 1-3. Although T2* and susceptibility maps can be derived from a single swMRI scan, they are derived from different aspects of the signal (magnitude vs phase) and reflect different signal-forming mechanisms. They therefore provide complementary information.The brain imaging component of UK Biobank (UKB) is scanning 100,000 participants using multi-modal MRI (including swMRI) 4. This rich resource also includes genome-wide characterisation of individuals 5. This provides a powerful opportunity to relate swMRI-derived measures to genetics. Recently, genetic associations of T2* values in subcortical structures have been reported using UKB swMRI data, identifying associations with genes related to iron transport and storage 6.
The aim of the present work is to identify genetic associations of QSM-based image-derived phenotypes (IDPs, summary imaging measures), and investigate whether these IDPs provide complementary genetic associations to T2*-based IDPs.
Methods
Susceptibility-weighted MRI phase data from the current data release of 35,876 UKB subjects (53% female), aged 45-82y (mean = 64.0y, SD = 7.5y) at time of imaging, were processed using our QSM pipeline 7. Following careful evaluations of several reference strategies, the mean susceptibility value in CSF for each subject was subtracted from their susceptibility maps. Subsequently, susceptibility maps were transformed to both subjects’ native structural space and MNI152 space following the standard UKB image processing pipeline 8. Median susceptibility values were extracted from 8 subcortical structures (thalamus, caudate, putamen, pallidum, hippocampus, amygdala, accumbens and substantia nigra, left/right hemispheres separated), forming 16 IDPs for QSM. T2*-based IDPs of these subcortical structures for the same subjects were provided by UKB. Each IDP had outliers removed before further analyses.We carried out 32 genome-wide association studies (GWAS) for both QSM and T2* based IDPs in 30,082 unrelated subjects with recent UK ancestry. We further divided this set into a discovery cohort of 20,060 subjects, and a reproduction cohort of 10,022 subjects. We followed the approach used previously including quality thresholding and de-confounding 6. The GWAS consists of pair-wise associations of IDPs with 20 million genetic variants (primarily single nucleotide polymorphisms, SNPs). Conventional single-phenotype GWAS threshold (-log10P = 7.5) 6 and Bonferroni-corrected threshold (-log10P = 8.76) were used to identify SNPs that are significantly associated with IDPs. The lead SNPs identified in GWAS were related to genes 9 and classified into five categories according to their main biological functions: iron, calcium, myelin, brain development, immune system and general regulation of cell function (regulation).
Additionally, we carried out voxel-wise (univariate Pearson) correlations between the susceptibility/T2* maps (in MNI152 space) and SNPs identified to have significant associations with QSM-based IDPs in GWAS.
Results and Discussion
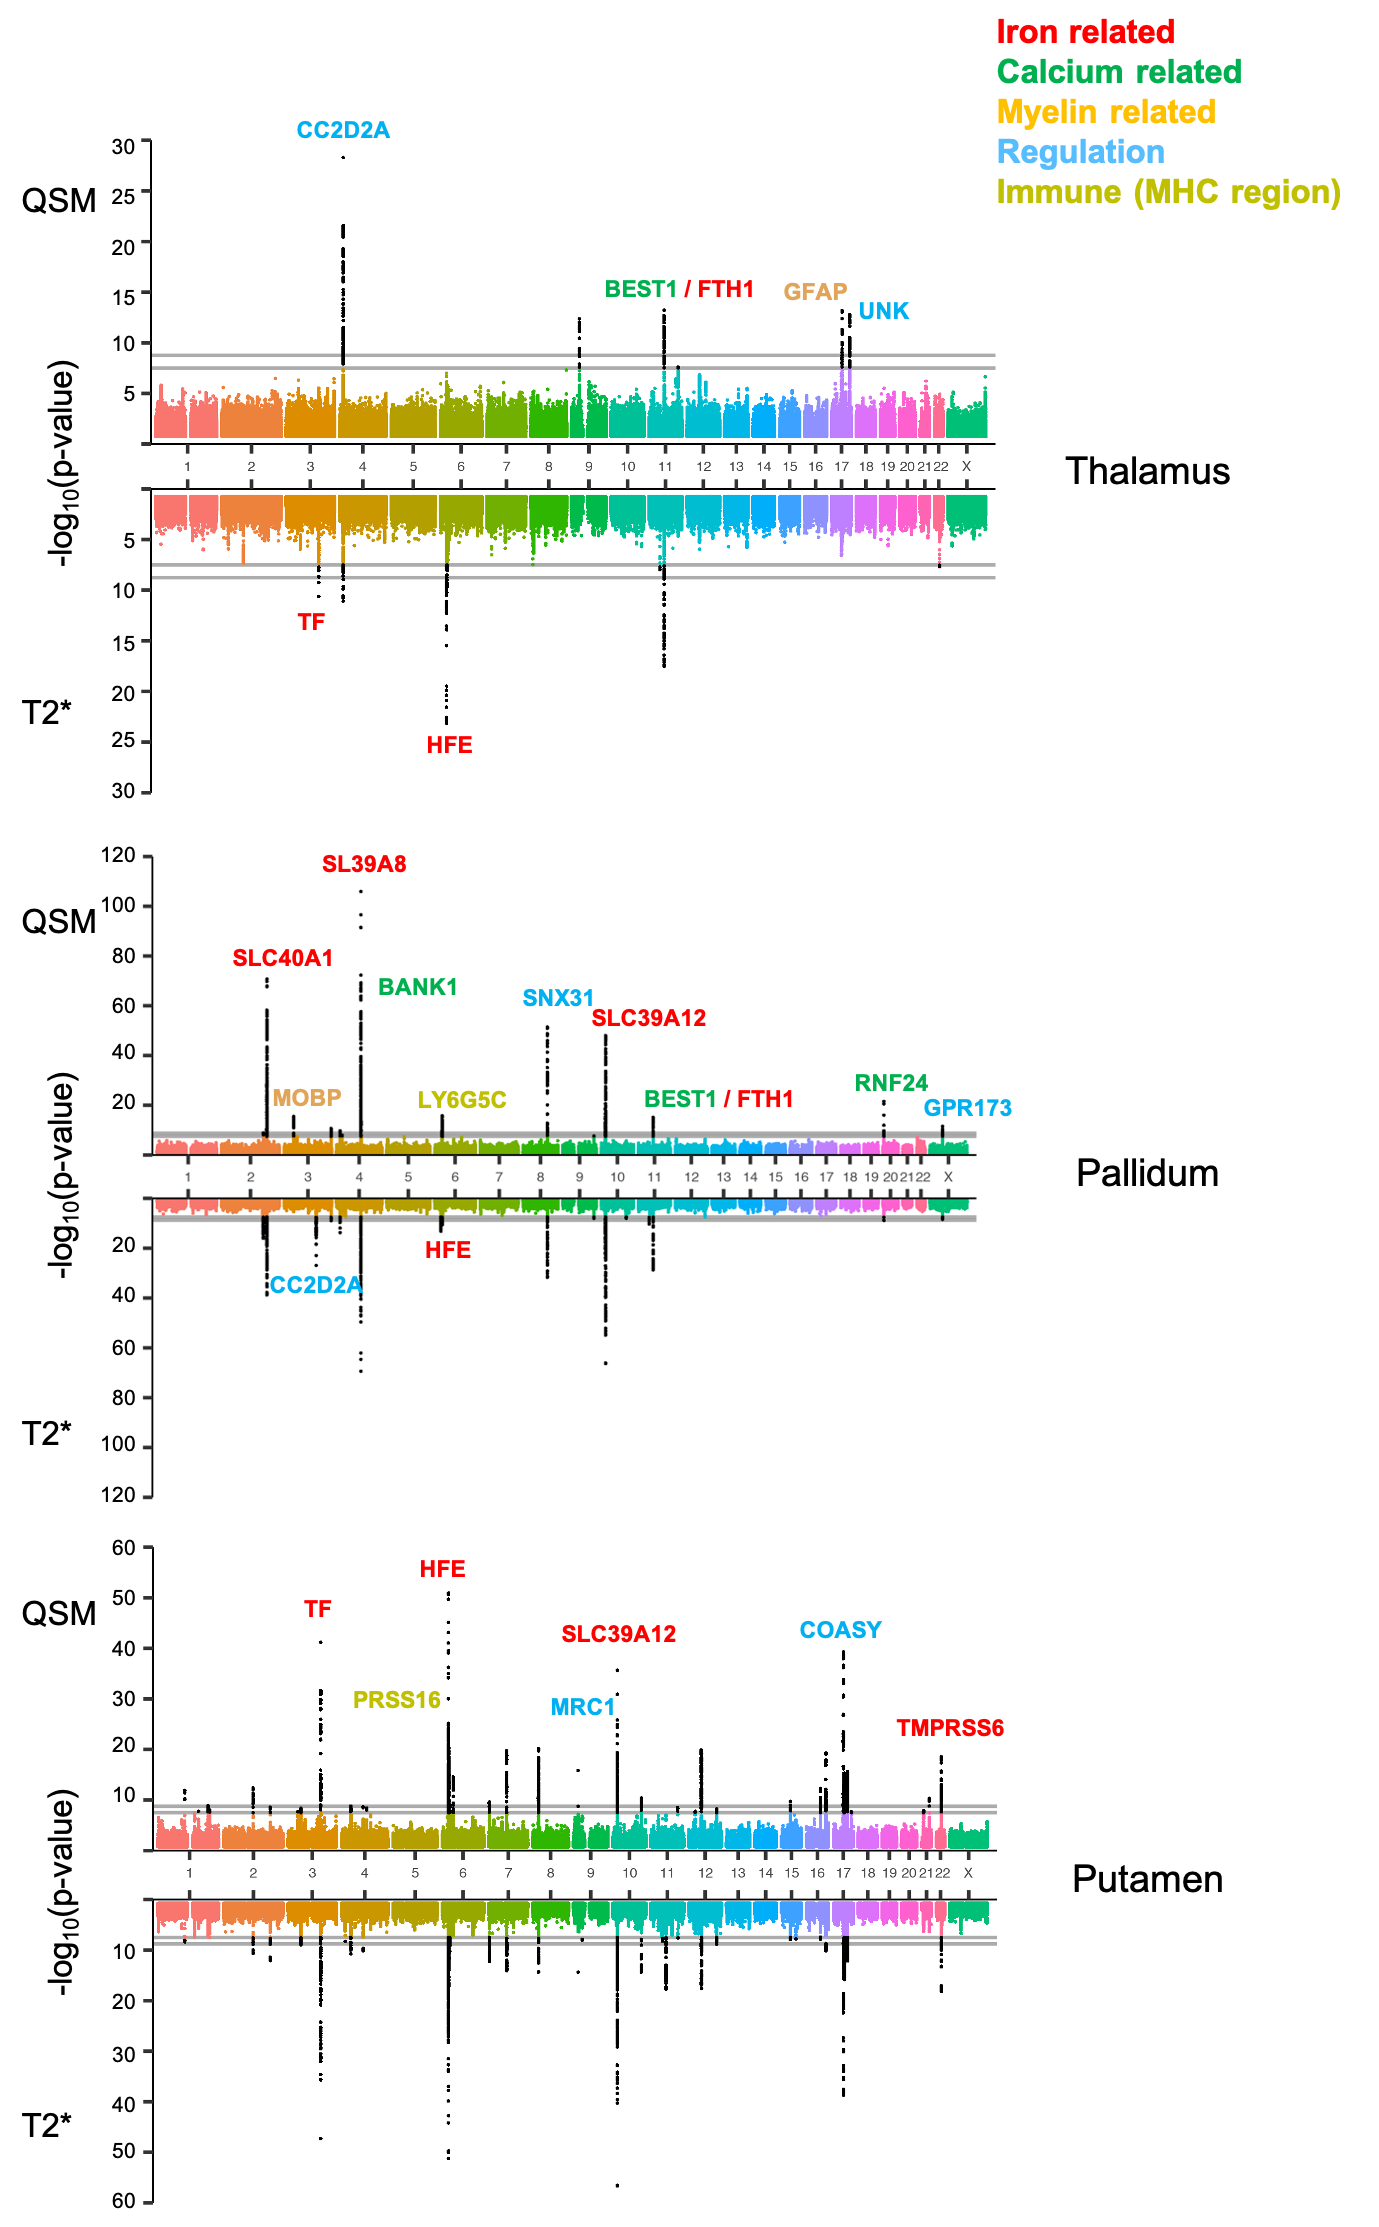
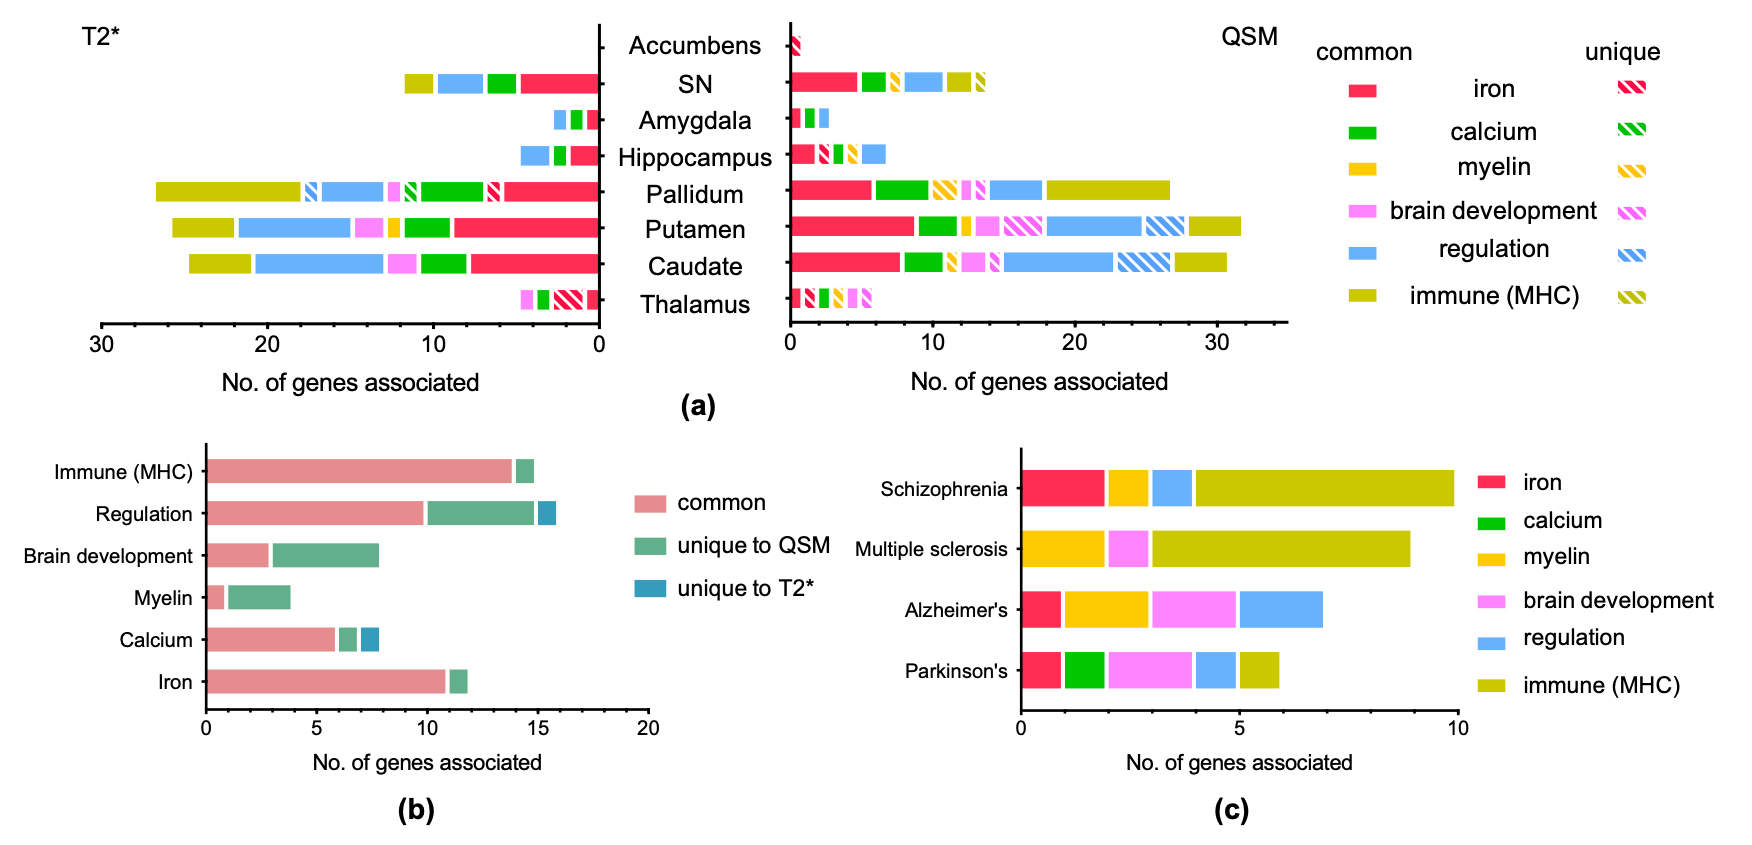
Comparisons of GWAS results from representative QSM and T2* based IDPs are shown in Figure 1. As expected, QSM and T2* IDPs are associated with many genetic loci involved in biological functions related to iron (e.g. TF, HFE), myelin (e.g. MOBP) and calcium (e.g. BANK1). We additionally found genetic loci involved in regulation (e.g. COASY) and the immune system (hits in the MHC region).Figure 2 shows summary statistics for lead SNPs of each genetic locus identified in GWAS. QSM and T2* IDPs identified many common genetic associations, but also complementary associations. Genes related to biological functions including iron, calcium and immune system are mostly common to both QSM and T2* IDPs, but a large portion of genes in myelin, brain development and regulation groups are only associated with QSM-based IDPs. Many of these genes are known to be associated with neurological (Alzheimer’s, Parkinson’s diseases and multiple sclerosis) and psychiatric (schizophrenia) disorders. (Fig. 2c).
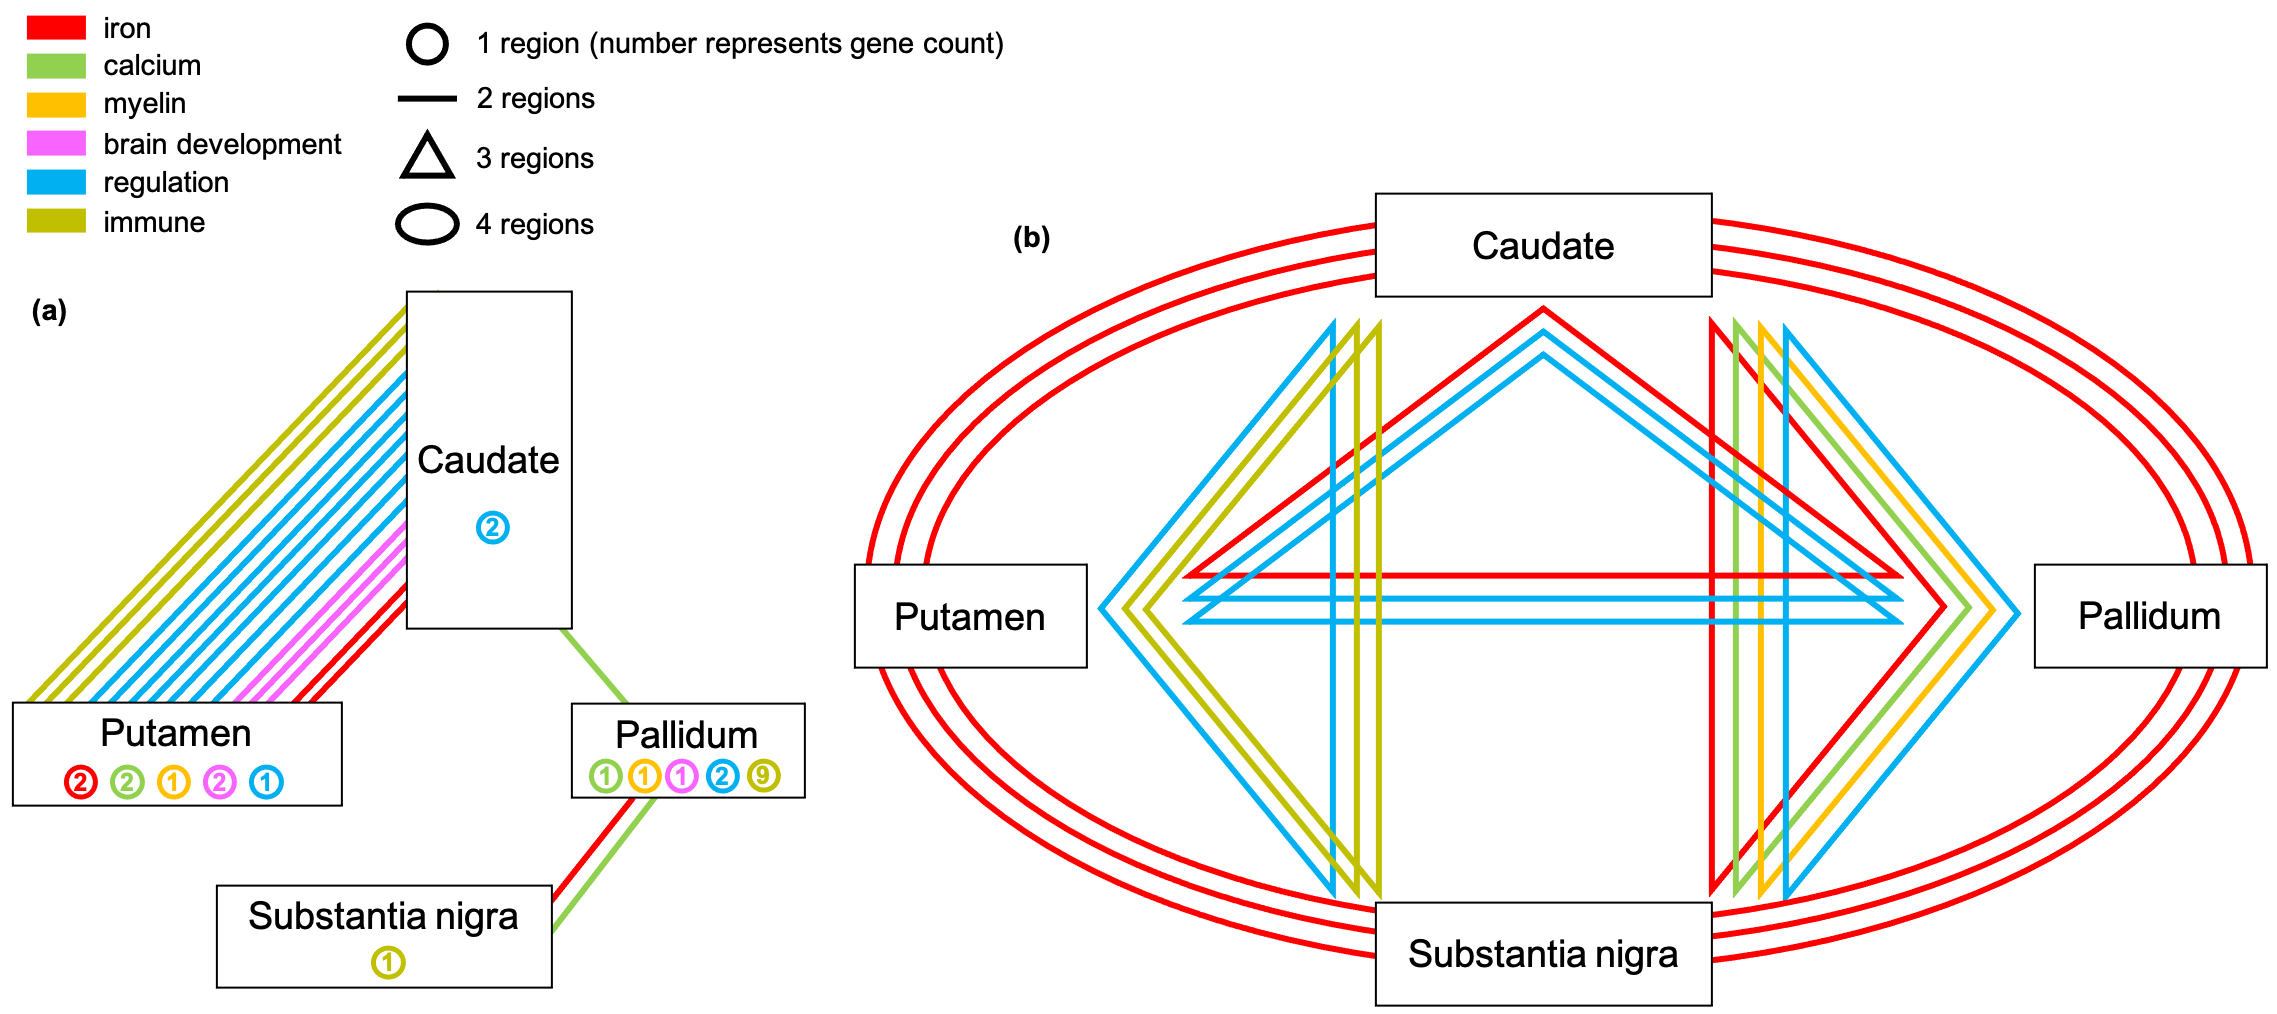
Figure 3 depicts the genetic relationships between 4 subcortical regions that showed the strongest genetic associations in GWAS. Distinct patterns of genetic associations are found between these subcortical regions. Iron-related genes are most shared across the 4 subcortical regions, consistent with subcortical swMRI contrast being predominantly driven by iron content 2,3. The caudate in particular shares many genetic associations with other regions. Many immune-related genes are only associated with the pallidum.
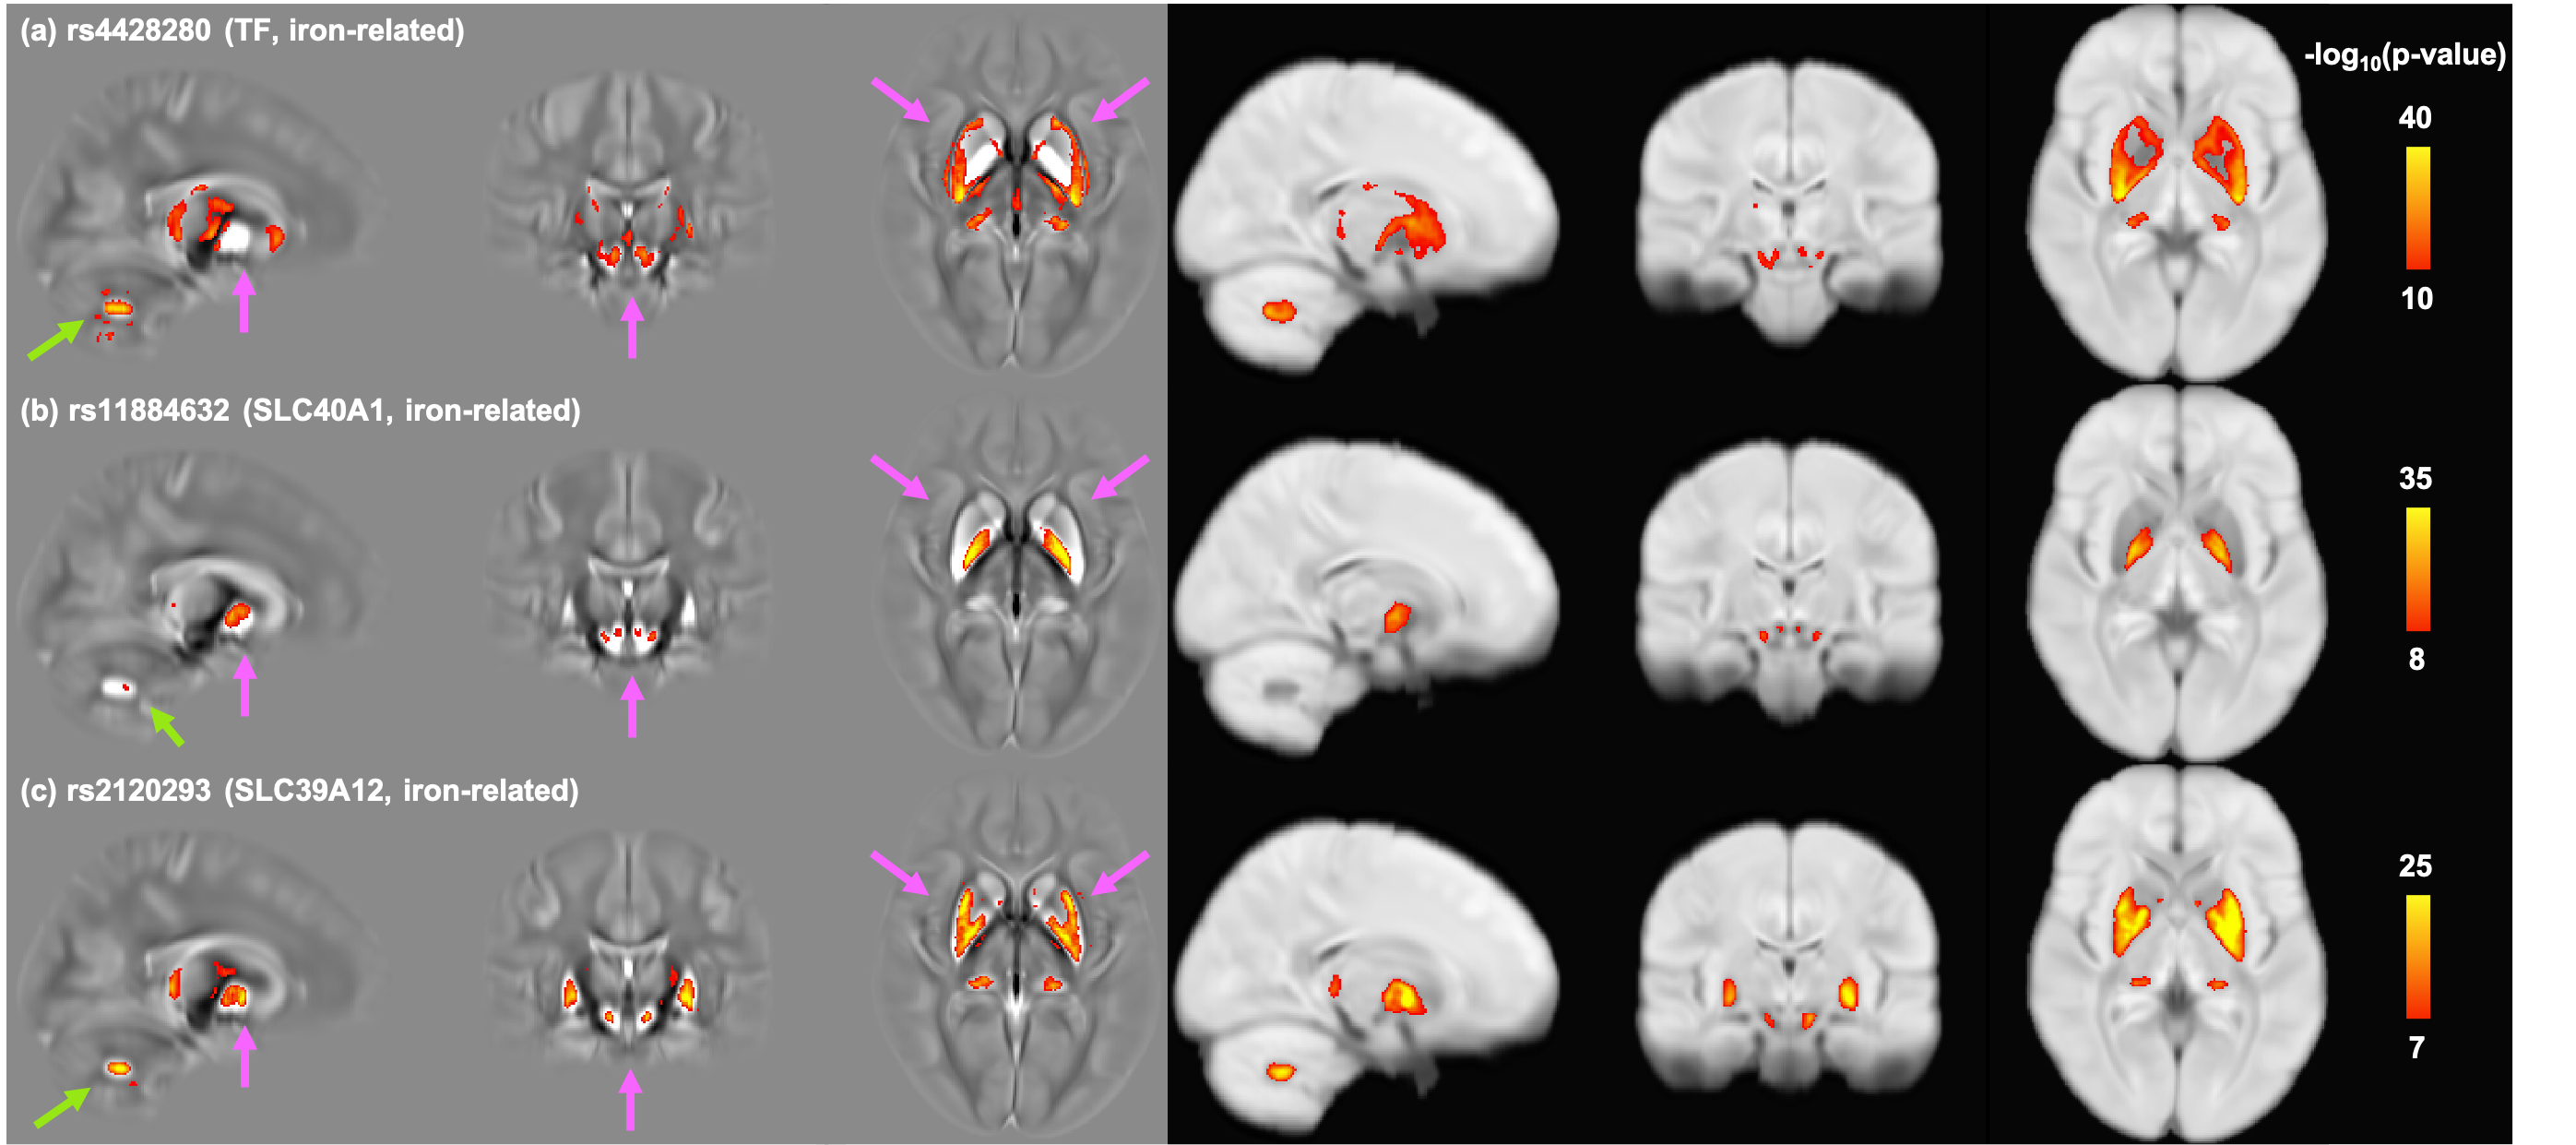
Figure 4 shows voxel-wise correlation maps between the susceptibility/T2* maps (in MNI152 space) and iron-related SNPs. Interestingly, although these SNPs are all related to genes involved in iron homeostasis, they have very distinct spatial patterns of associations. Furthermore, additional associated areas that were not captured by subcortical IDPs were identified, such as the dentate nucleus in the cerebellum (Fig.4a, 4c).
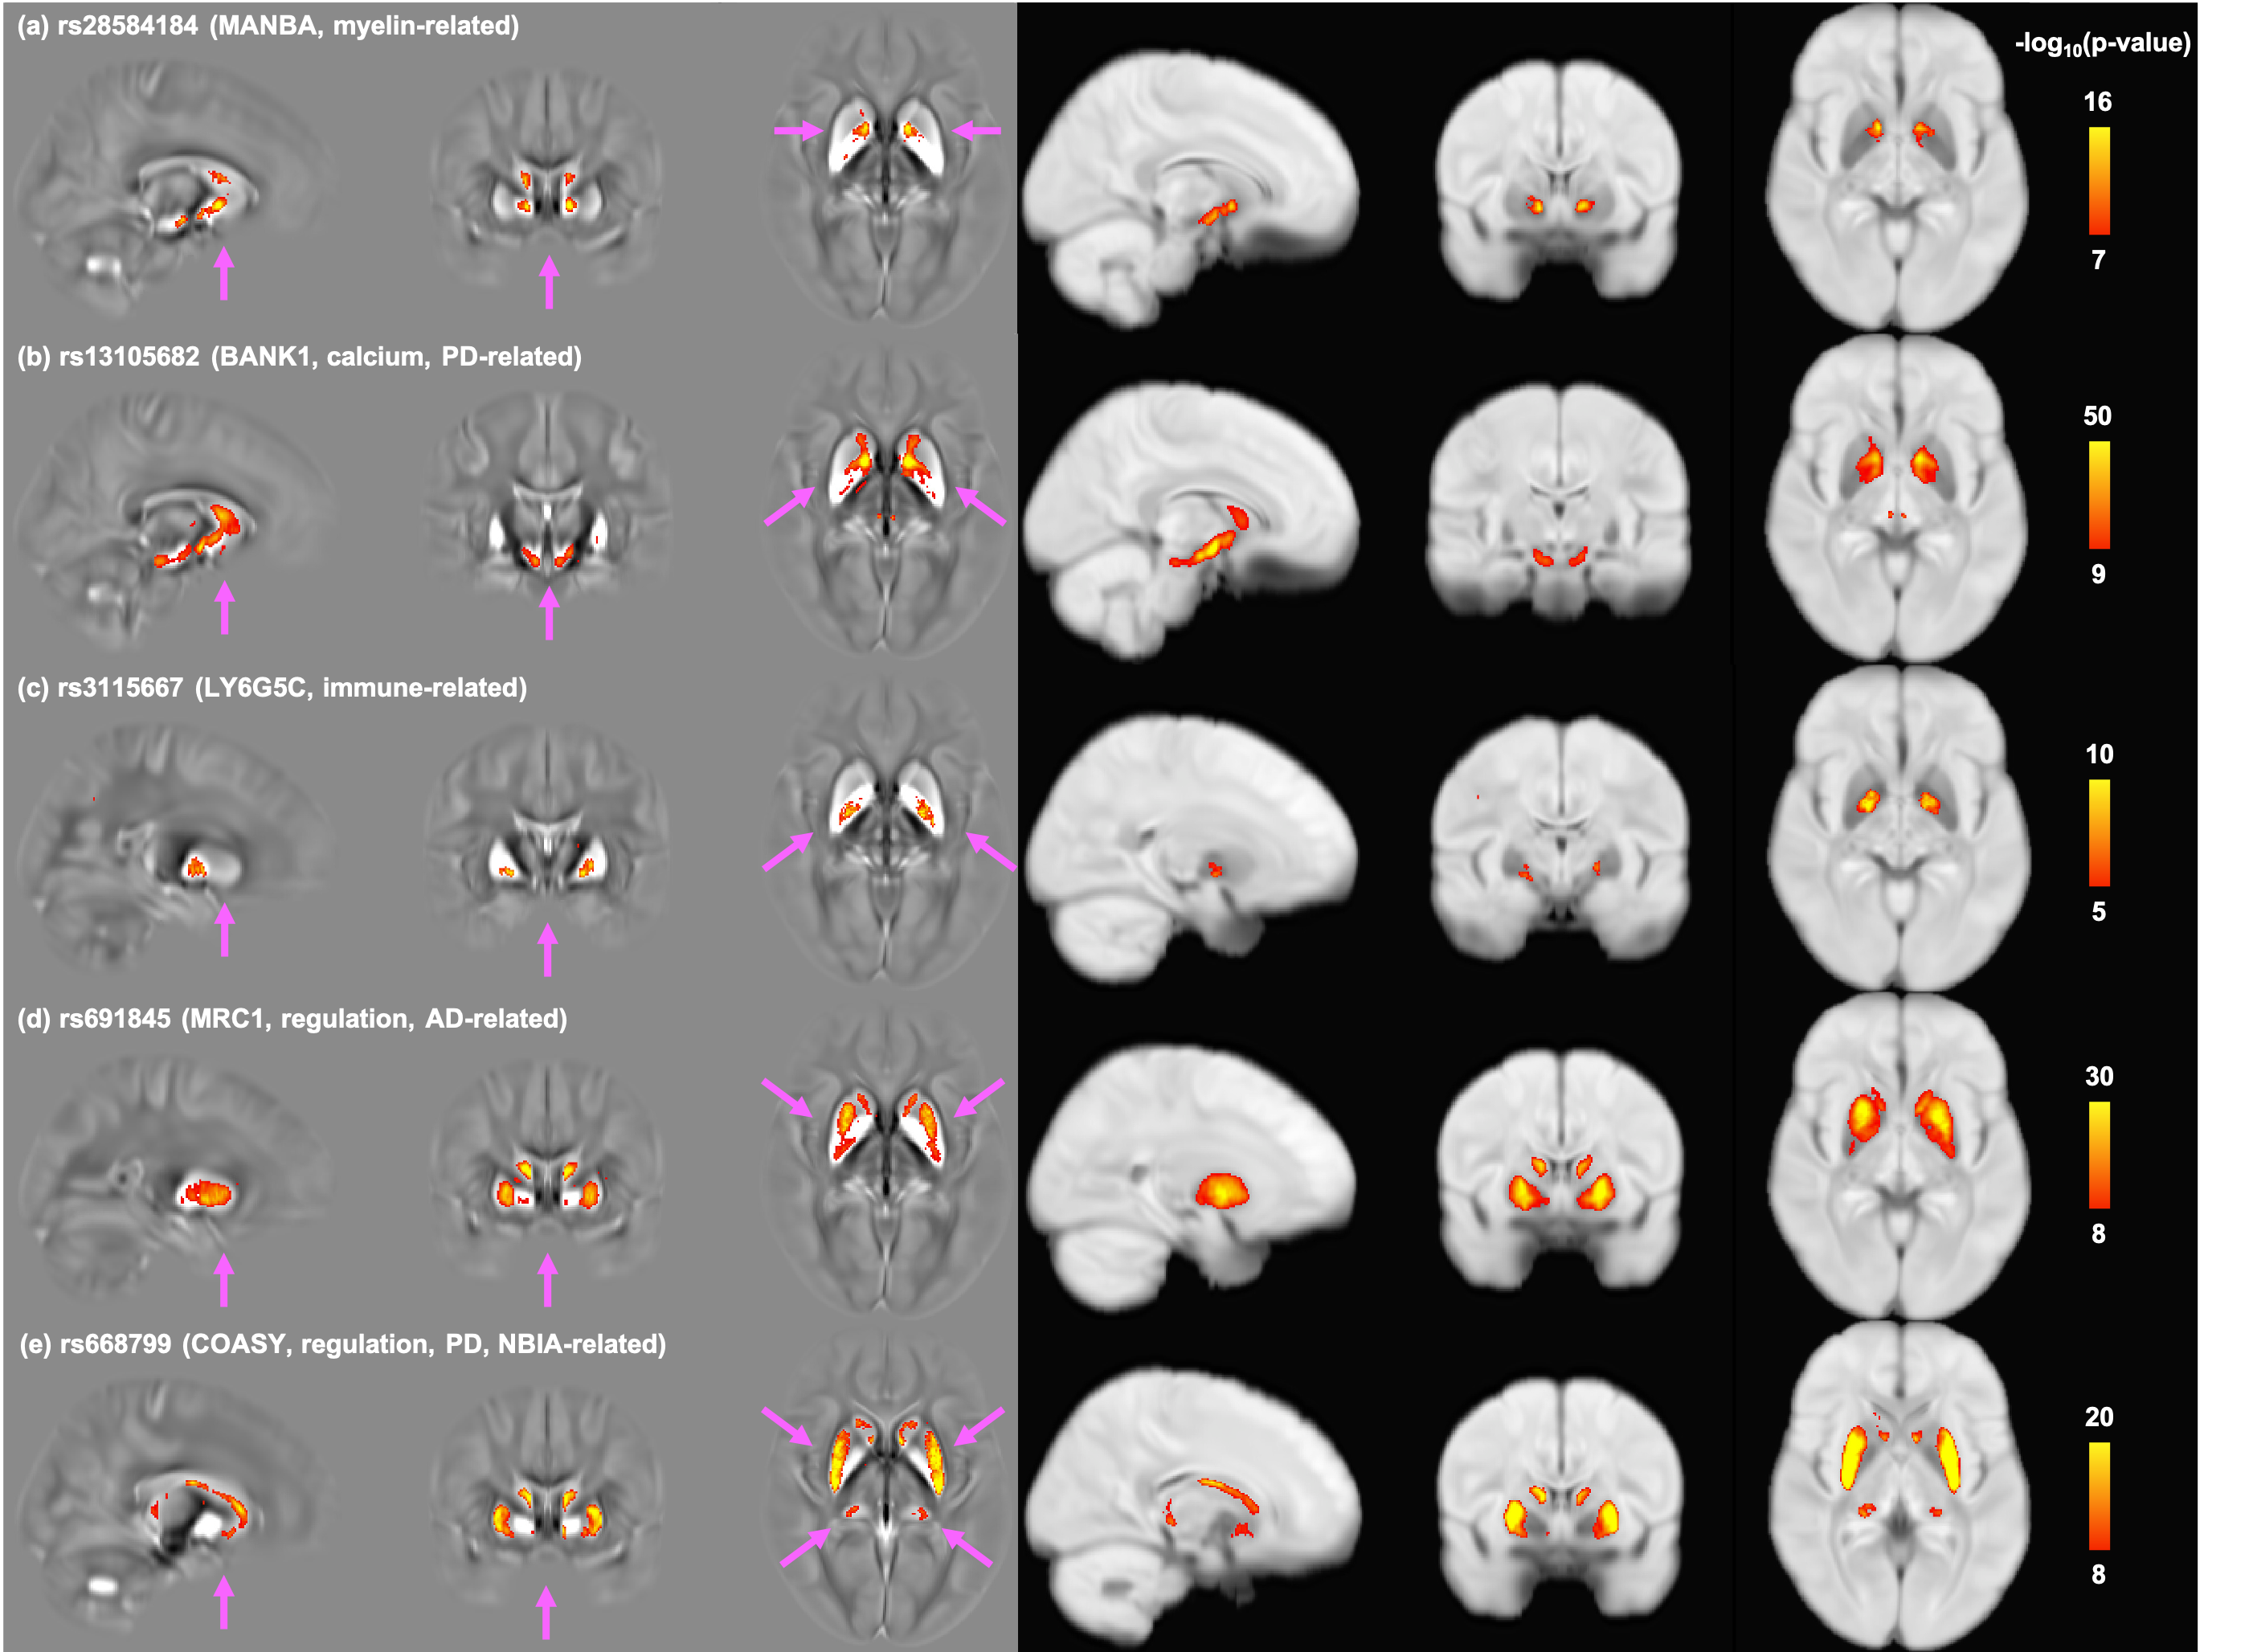
Figure 5 shows spatial patterns of association relating to SNPs involved in other biological functions. While some SNPs have spatial patterns of association similar to iron-related SNPs (Fig. 5e), many differ, including highly-localized associations (Fig. 5c, this immune-related SNP is only associated with voxels in the pallidum) or more widely distributed association patterns (Fig. 5d).
Conclusion
Our results demonstrate that susceptibility and T2* measures are associated with genetic loci involved in a range of biological functions. Susceptibility and T2* IDPs share many common genetic associations but there are also complementary associations.Acknowledgements
Karla L. Miller and Aurea B. Martins-Bach contributed equally to this work.
This research has been conducted using the UK Biobank Resource under Application Number 8107.
References
1. Wang, Y. and Liu, T., Quantitative susceptibility mapping (QSM): Decoding MRI data for a tissue magnetic biomarker. Magn. Reson. Med. (2015), 73: 82-101.
2. Langkammer, C., et al. Quantitative susceptibility mapping (QSM) as a means to measure brain iron? A post mortem validation study. Neuroimage 62.3 (2012): 1593-1599.
3. Langkammer, C., et al. Quantitative MR imaging of brain iron: a postmortem validation study. Radiology 257.2 (2010): 455-462.
4. Miller, K., Alfaro-Almagro, F., Bangerter, N. et al. Multimodal population brain imaging in the UK Biobank prospective epidemiological study. Nat Neurosci 19, 1523–1536 (2016).
5. Bycroft, C., Freeman, C., Petkova, D. et al. The UK Biobank resource with deep phenotyping and genomic data. Nature 562, 203–209 (2018).
6. Elliott, L.T., Sharp, K., Alfaro-Almagro, F. et al. Genome-wide association studies of brain imaging phenotypes in UK Biobank. Nature 562, 210–216 (2018).
7. Wang, C., et al. Quantitative susceptibility mapping in UK Biobank brain imaging: pipeline and preliminary results in 2400 subjects. In Proceedings of the 28th AnnualMeeting of ISMRM, 2020, p. 153
8. Alfaro-Almagro, F., et al. Image processing and Quality Control for the first 10,000 brain imaging datasets from UK Biobank. Neuroimage 166 (2018): 400-424.
9. Watanabe, K., Taskesen, E., van Bochoven, A. et al. Functional mapping and annotation of genetic associations with FUMA. Nat Commun 8, 1826 (2017).
Figures