0789
Quantitative mapping of susceptibility and non-susceptibility frequency with DEEPOLE QUASAR1Department of Computer Science and Automation, Technische Universität Ilmenau, Ilmenau, Germany, 2Buffalo Neuroimaging Analysis Center, Department of Neurology at the Jacobs School of Medicine and Biomedical Sciences, University at Buffalo, The State University of New York, Buffalo, NY, United States, 3Center for Biomedical Imaging, Clinical and Translational Science Institute, University at Buffalo, The State University of New York, Buffalo, NY, United States
Synopsis
Besides magnetic susceptibility, MRI phase contrast is caused by chemical exchange, anisotropic magnetic susceptibility, and anisotropic microstructural compartmentalization. These additional contributions are neglected by conventional QSM. This work presents an improved version of DEEPOLE QUASAR, a phase processing method that accounts for non-susceptibility signal contributions. We present preliminary results from studies on mice, volunteers, and multiple sclerosis (MS) patients.
Introduction
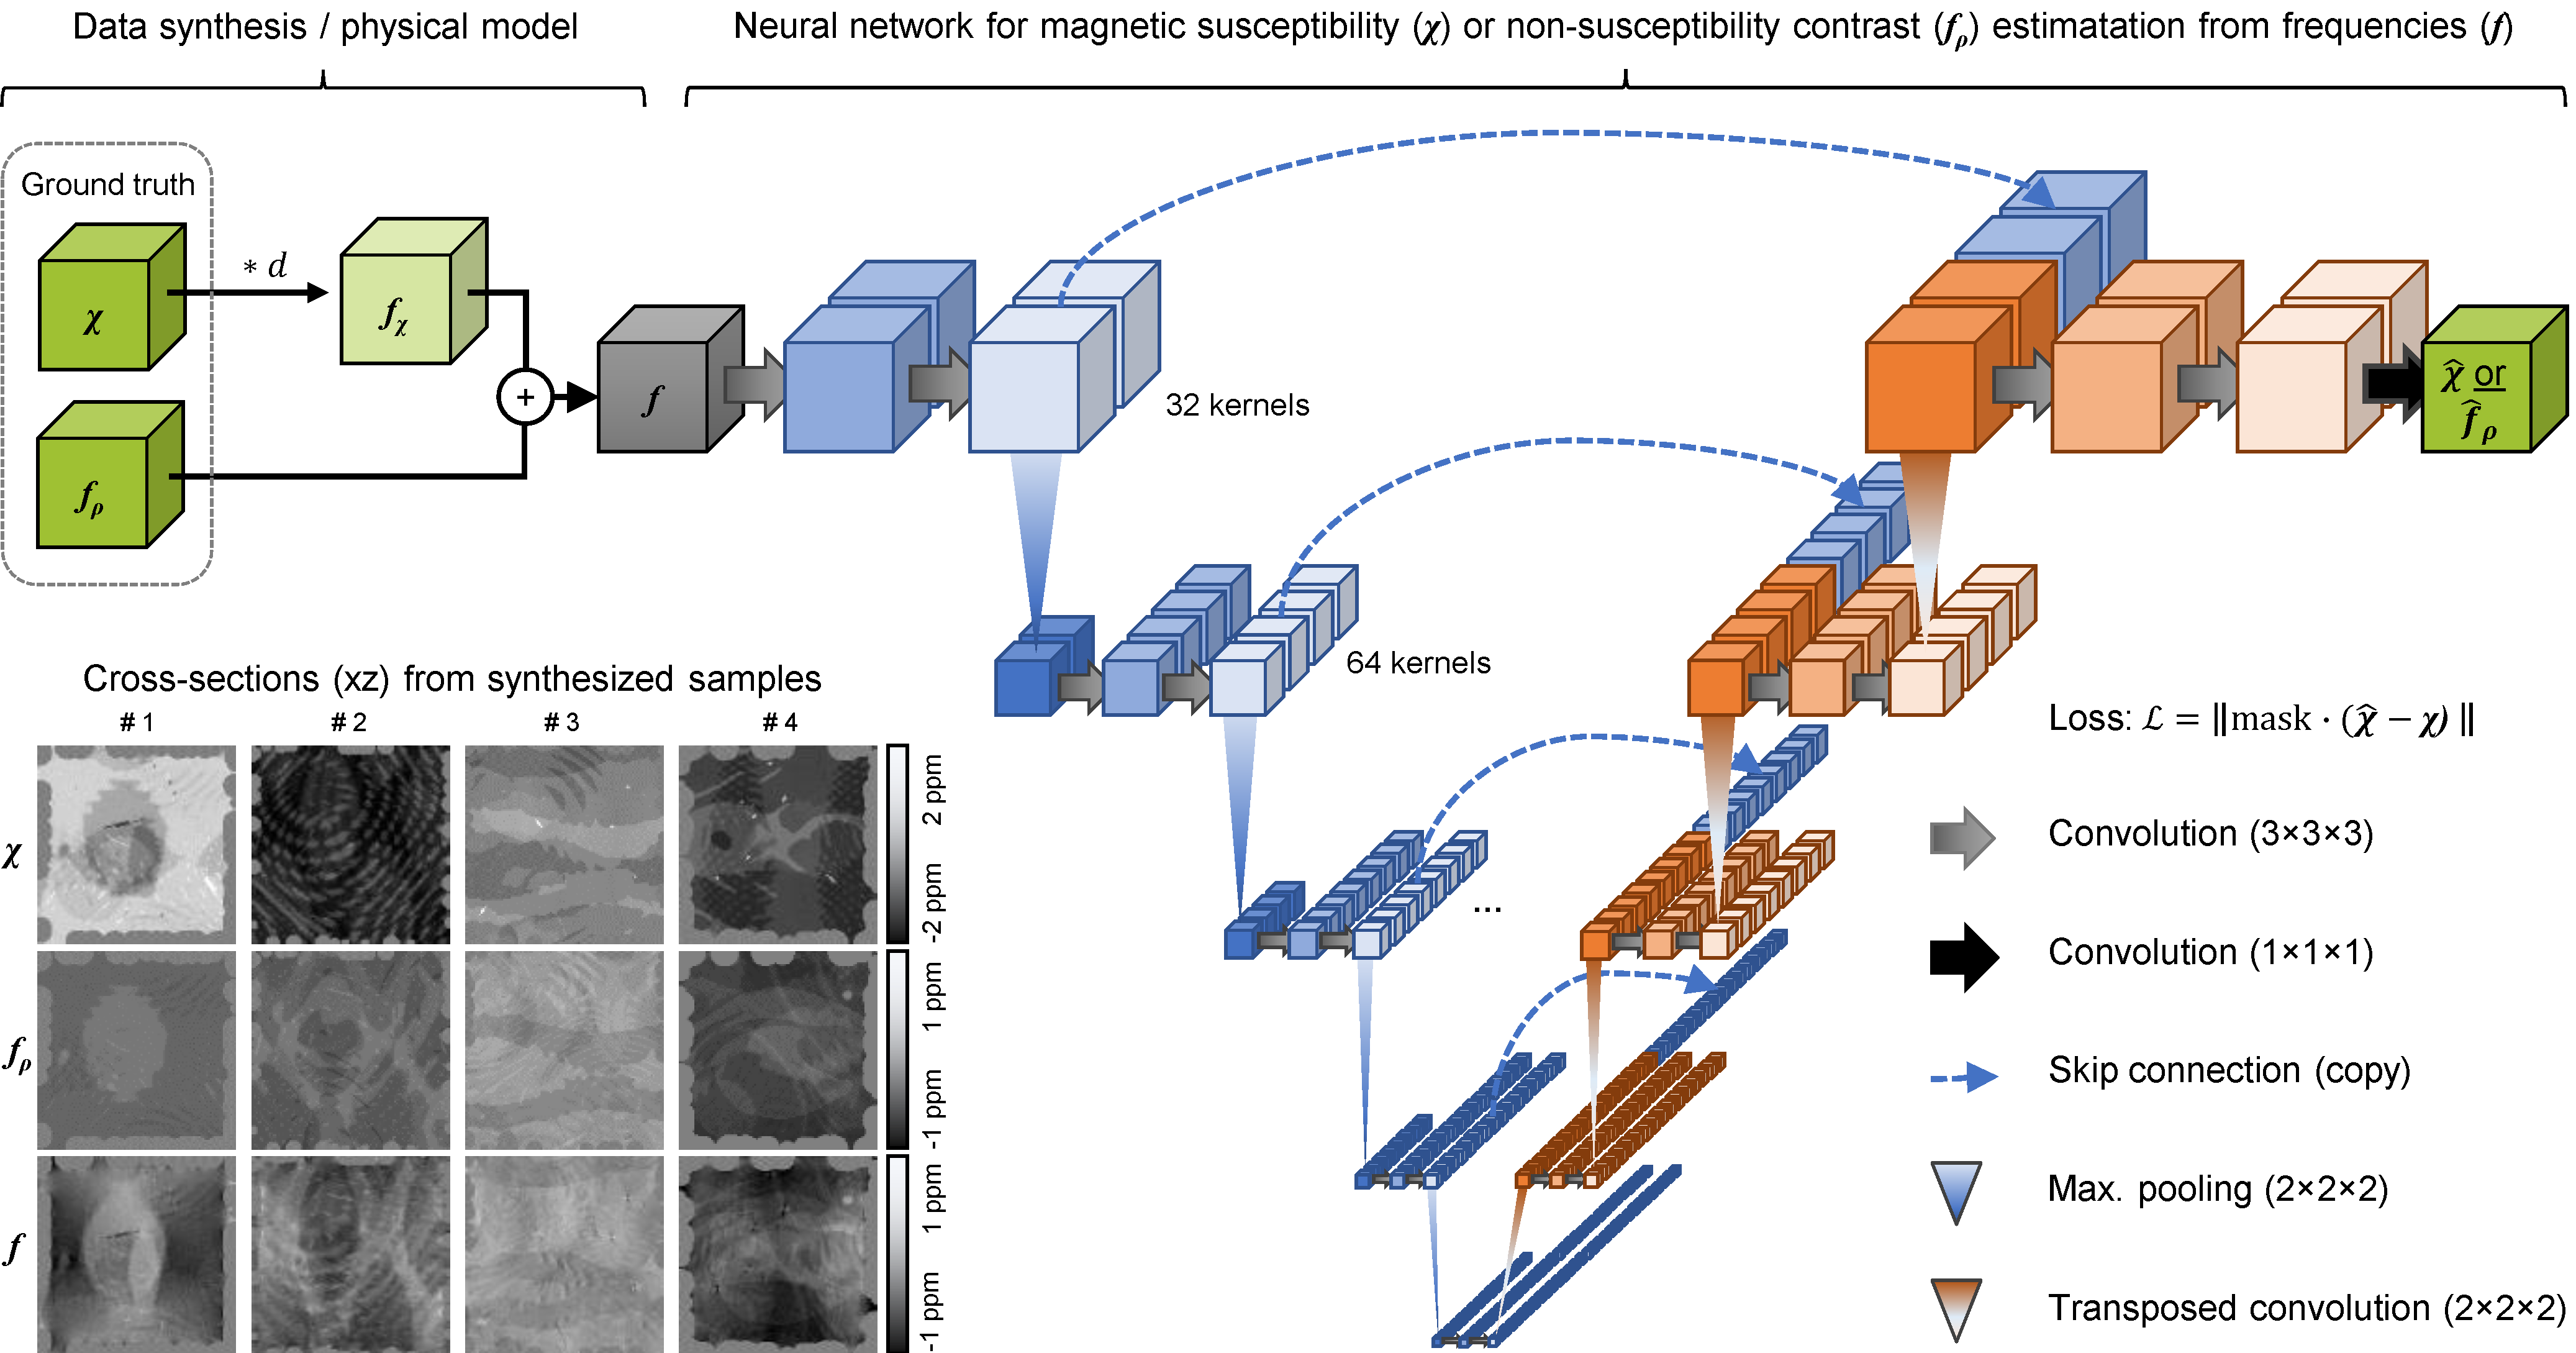
Frequency maps from gradient-recalled echo MRI phase are affected by multiple biophysical contrast mechanisms. Most prominently, the frequency perturbation is explained with voxel-average (bulk) isotropic magnetic susceptibility of the tissue. Besides that, theoretical predictions and experimental evidence exist for additional contributions from (i) chemical exchange,1–3 (ii) anisotropic magnetic susceptibility,4,5 and (iii) anisotropic microstructural compartmentalization.2,6 Neglecting these additional, confounding contributions by assuming bulk isotropic susceptibility as the sole generator of the frequency shift leads to errors in the susceptibility estimates4 in quantitative susceptibility mapping (QSM).7 These errors are particularly problematic since QSM is increasingly being used in clinical studies8,9 for its quantitative information. Furthermore, the current simplistic physical model of QSM obscures the highly interesting information about microstructural tissue pathology. The non-susceptibility-contrast bears the potential of a unique and highly sensitive assessment of myelin-related pathology because its sign and magnitude could indicate the type of tissue alteration, even before bulk changes of the chemical tissue composition change the voxel-average magnetic susceptibility. The assumptions in the literature on each non-susceptibility frequency contribution’s individual extend are conflicting.4,5,10,11 Of all contributions, the isotropic susceptibility presumably causes the strongest non-local field perturbation, described through a convolution (denoted *) with a dipole12 d. Our recently presented DEEPOLE QUASAR approach13 uses this dipole pattern as a hallmark for separating the susceptibility-related frequency contribution, and yields separate maps for the magnetic susceptibility χ versus the other frequency contributions fρ combined, according to the QUASAR model14 f=d*χ + fρ. Here we present an improved version of DEEPOLE QUASAR and preliminary results from studies on mice, volunteers, and multiple sclerosis (MS) patients.Methods
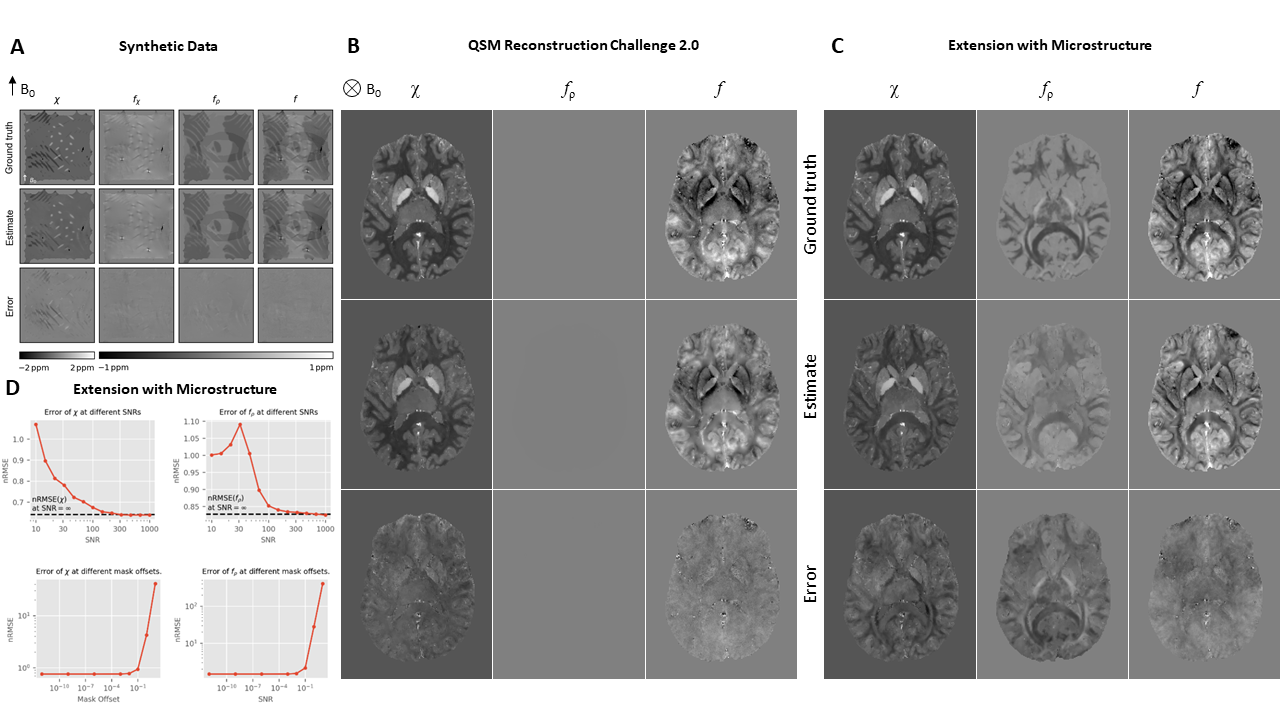
Deep learning: We set up a U-Net15 (TensorFlow 2.2.0) to approximate the inverse mapping from f to χ, similar to Bollmann et al.16 and Yoon et al.,17 but trained it on synthetic random distributions18 of f (1603 voxels) that contained non-susceptibility contributions (Fig. 1). We augmented 1200 training samples with complex Gaussian noise,18,19 set random parts of f to zero (masking), and calculated the loss (mean-squared error) in the unmasked regions. We trained a second network to directly approximate fρ. For evaluation, we extended the dataset of the 2019 QSM Reconstruction Challenge20 with a DTI-based microstructure model.21–24 We explored how signal-to-noise ratio and masking affected the normalized root mean-squared error (nRMSE). Application: We applied the method on (i) volunteer data (N=12, 12 echoes, 3T), (ii) clinical multiple sclerosis data (N=10, 12 echoes, 3T) in comparison with FLAIR, T1, T1 with Gadolinium, and “classical” QSM (HEIDI),7 and (iii) on Swiss Jim Lambert (SJL)/J mice (N=23, 9 echoes, 9.4T). In all cases, phase images were acquired with axial 3D multi-echo spoiled gradient recalled echo. The local Ethical Standards Committee approved the human experiments, and a written informed consent form was obtained.Results and Discussion
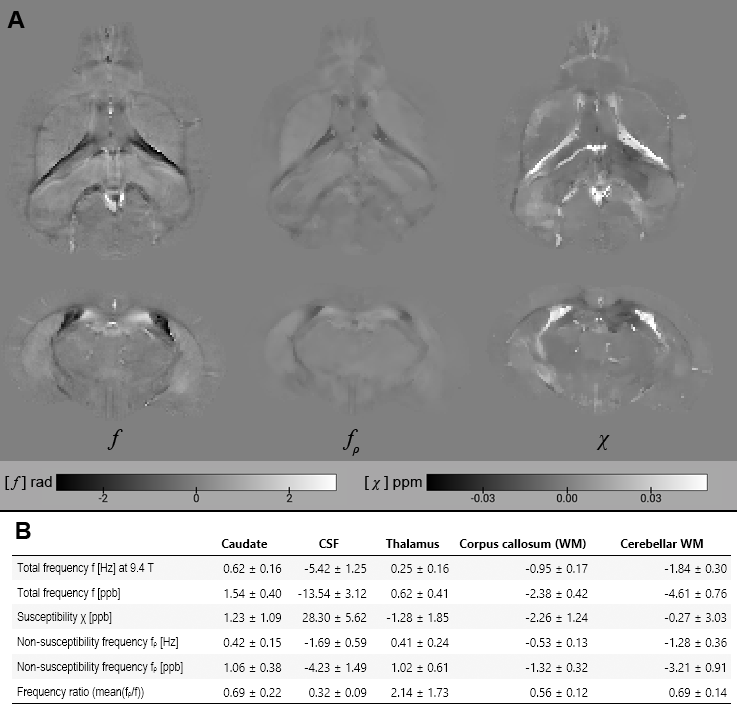
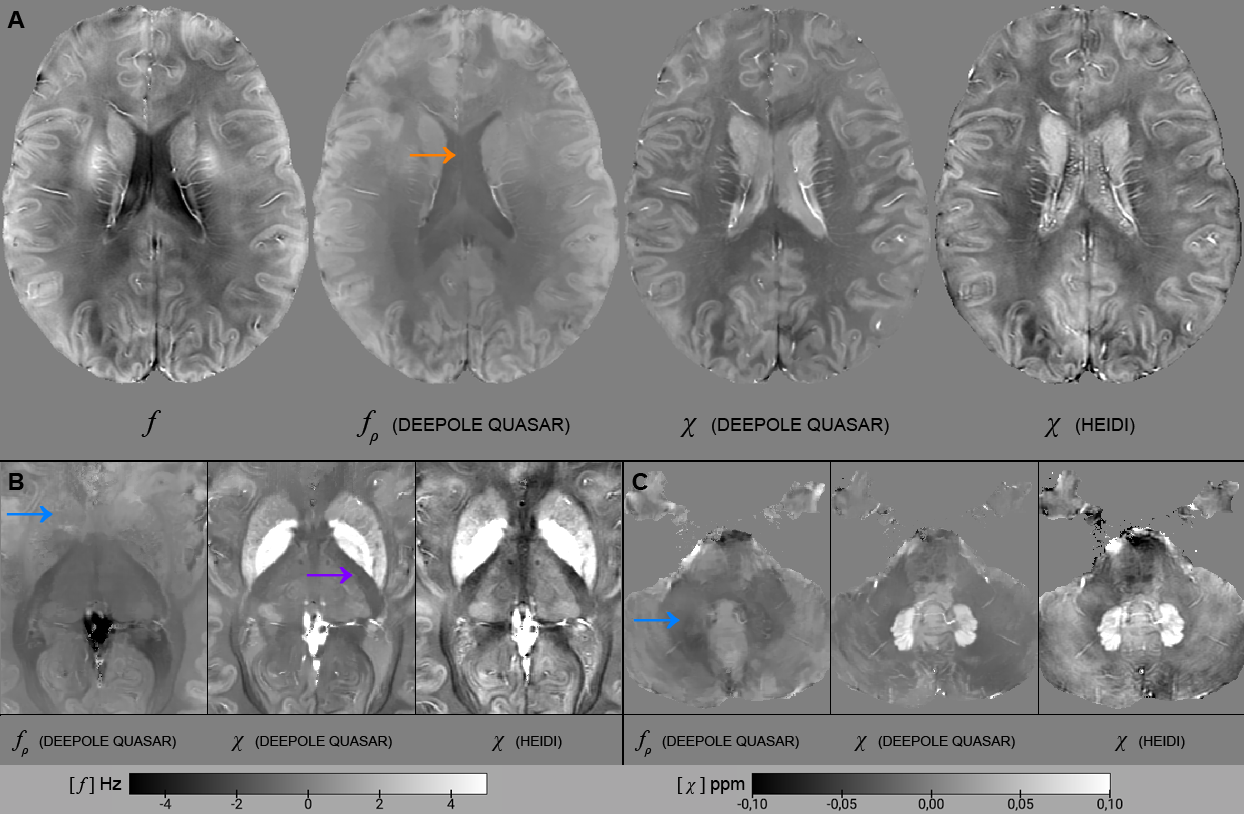
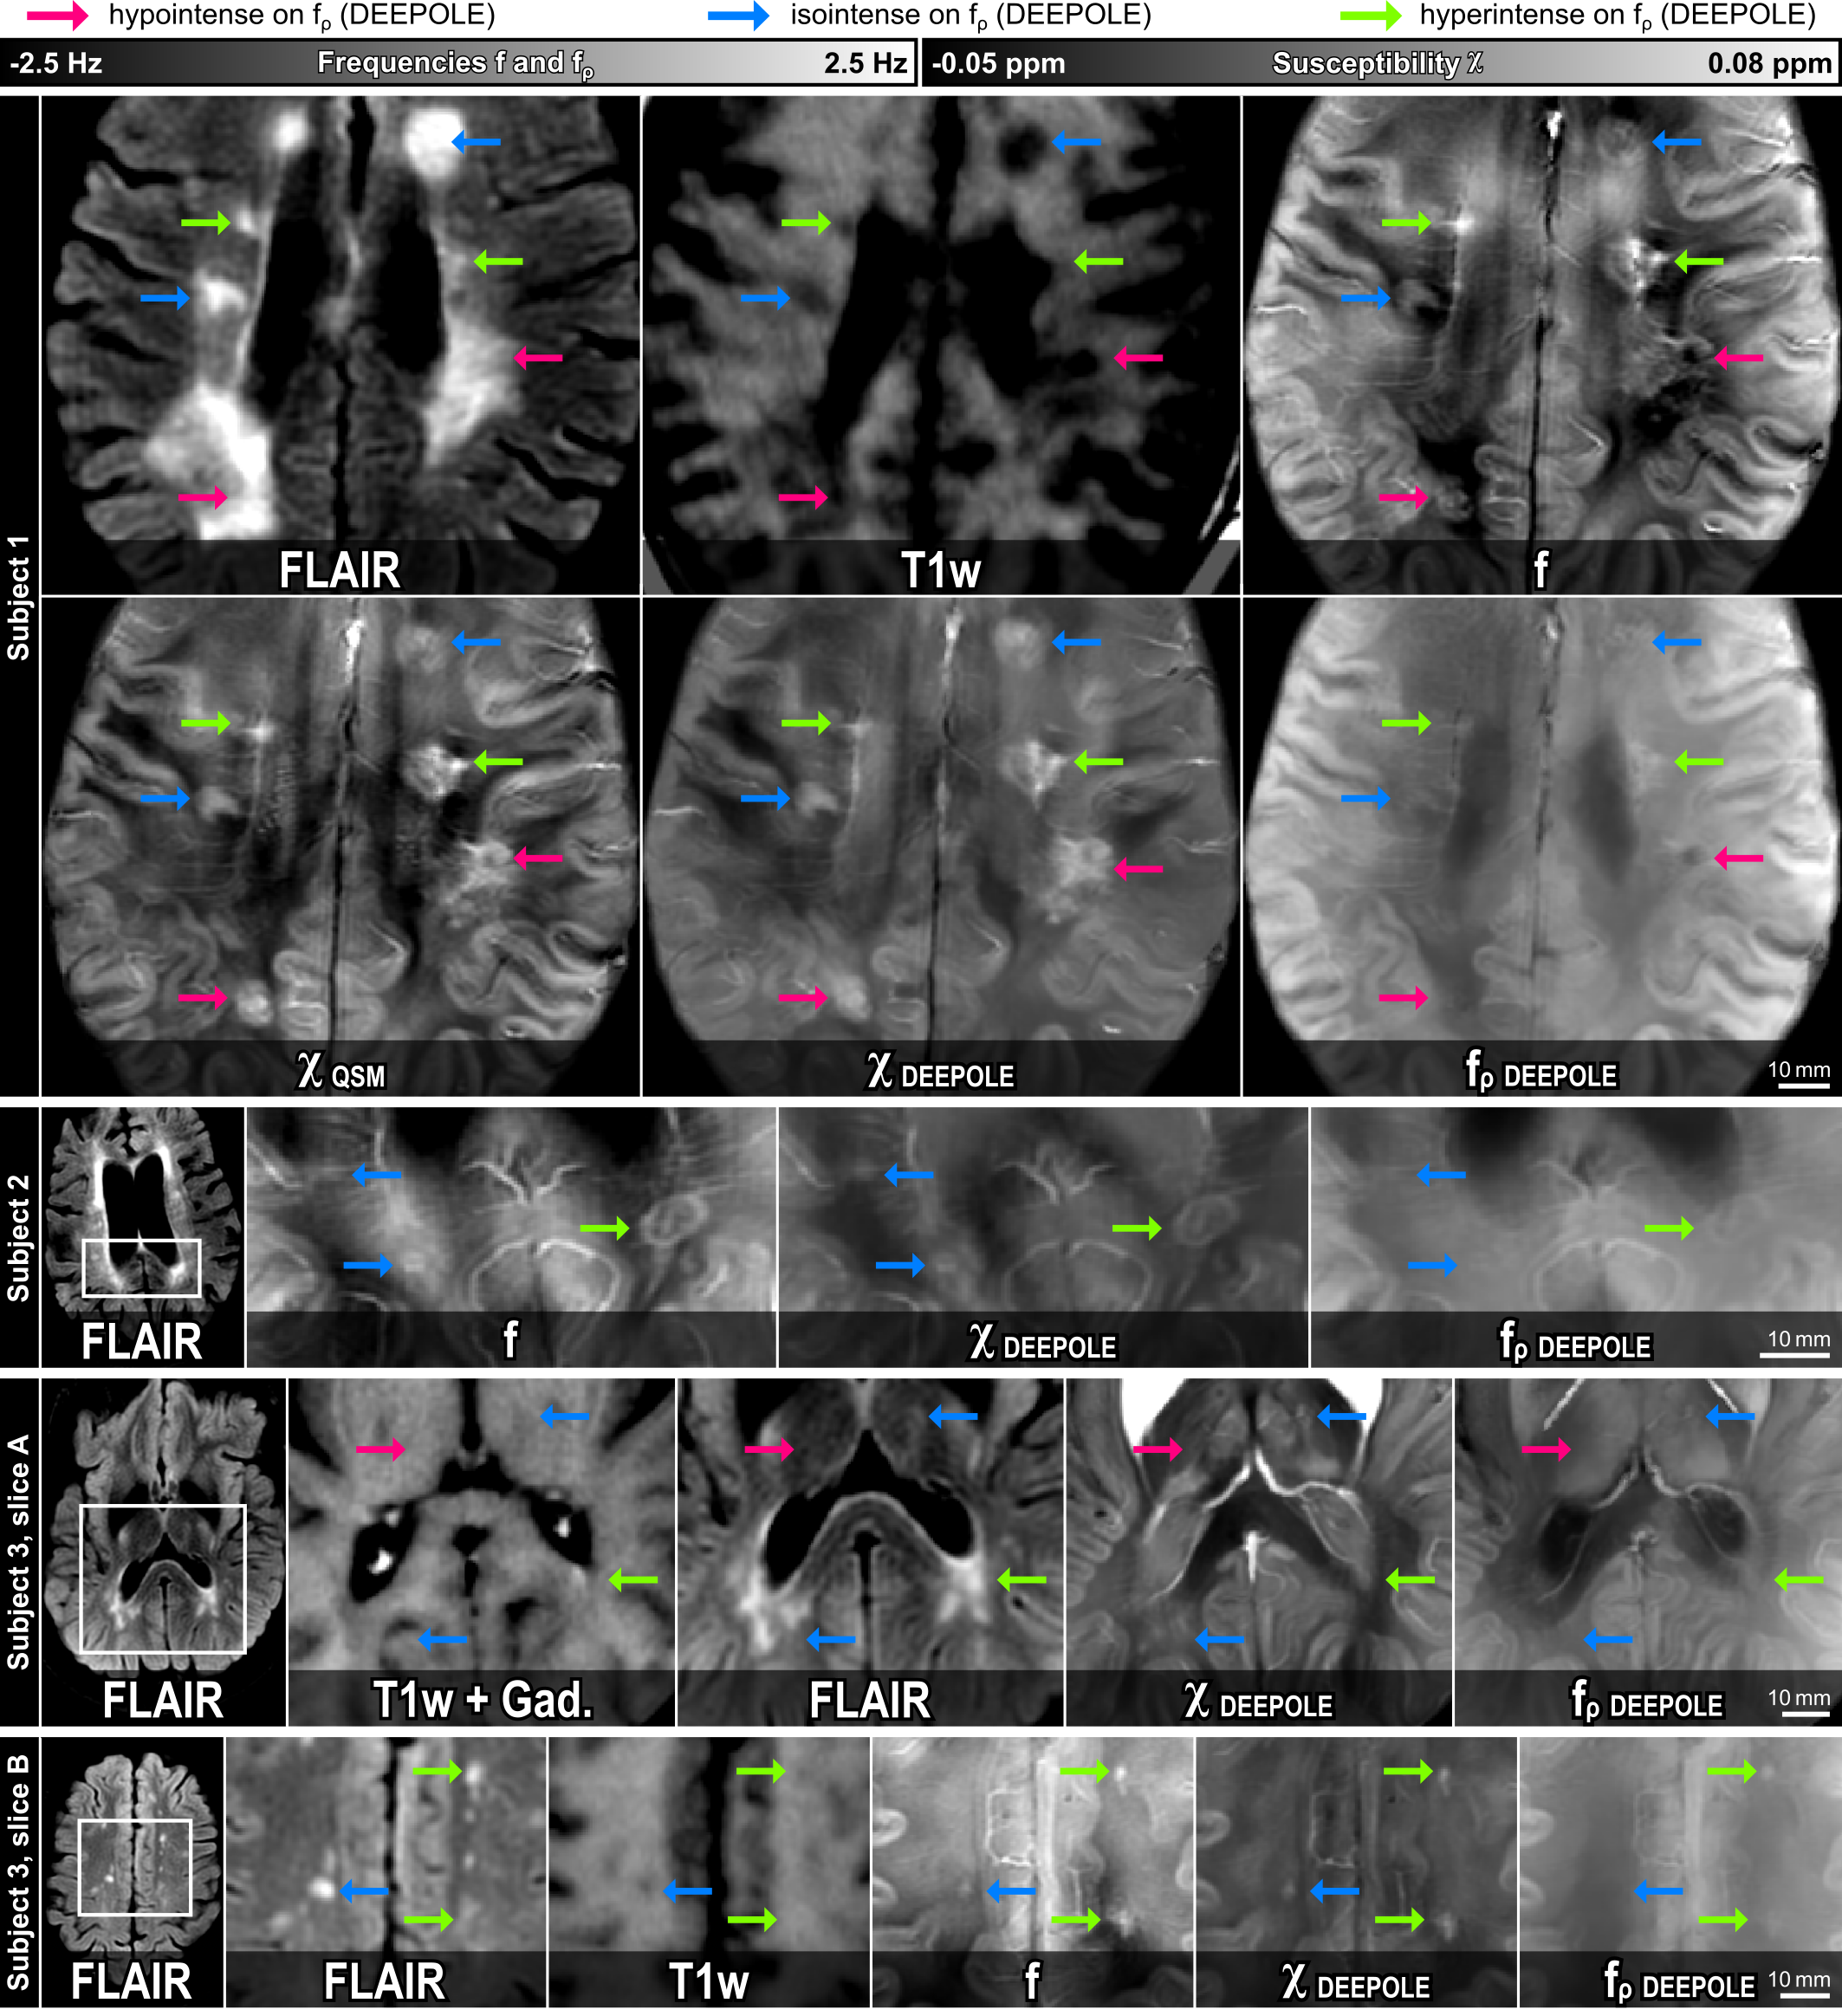
The in silico results in Fig. 2A-C demonstrated the method’s ability to find valid and accurate solutions for χ and fρ. Fig. 2A showed visible estimation errors for χ, but not in the corresponding fχ, where these contributions (and errors) disappeared due to the magic angle effect. The errors in Fig. 2C are likely related to those contributions from χ and fρ that are mathematically inseparable. Fig. 2D shows that nRMSE plateaued at SNR values exceeding 100 and nRMSE drastically increased when offsetting the out-of-brain region with values >0.1, showing the zero-masked training data taught the network to detect masks. Fig. 3 shows in vivo results from mice, where fρ was higher in gray matter (GM) than in white matter (WM), identically to our in vivo results from volunteers (Fig. 4).Fig. 5 shows MS lesions with fρ being hypointense, isointense and hyperintense for different lesions, respectively. This could indicate different stages, as well as different types of tissue damage.26 An iron-enhanced rim lesion had a strong susceptibility and a small positive fρ, potentially pointing at myelin dysintegration, as opposed to neurofilament (where fρ would be decreased).
Conclusion
DEEPOLE QUASAR is the first method for estimating the non-susceptibility frequency without requiring restrictive boundary assumptions. It forms a new MRI contrast and in combination with its improved susceptibility estimates allows assumptions about the microstructural causes of frequency contrast.Our solutions agree with the existing evidence of iron-caused contrast in deep GM. Our finding of larger non-susceptibility frequency in cortical GM compared to WM might stimulate new theories about the biophysical mechanisms of phase contrast in cortical GM.
Acknowledgements
We thank José P. Marques for providing data and support for the generation of the digital microstructure phantom.
The research reported in this publication was funded by the National Center for Advancing Translational Sciences of the National Institutes of Health under Award Number UL1TR001412 (F.S.). The content is solely the responsibility of the authors and does not necessarily represent the official views of the NIH. Furthermore, the research was supported by the German Federal Ministry of Education and Research (BMBF) grant TeleBrain (01DS19009A) and the Free State of Thuringia within the ThiMEDOP project (2018 IZN 0004) with funds of the European Union (EFRE).
References
1. Shmueli, K., Dodd, S. J., Li, T.-Q. & Duyn, J. H. The contribution of chemical exchange to MRI frequency shifts in brain tissue. Magnetic Resonance in Medicine 65, 35–43 (2011).
2. Wharton, S. & Bowtell, R. Fiber orientation-dependent white matter contrast in gradient echo MRI. PNAS 109, 18559–18564 (2012).
3. Leutritz, T., Hilfert, L., Smalla, K.-H., Speck, O. & Zhong, K. Accurate quantification of water–macromolecule exchange induced frequency shift: Effects of reference substance. Magnetic Resonance in Medicine 69, 263–268 (2013).
4. Wharton, S. & Bowtell, R. Effects of white matter microstructure on phase and susceptibility maps. Magnetic Resonance in Medicine 73, 1258–1269 (2015).
5. Lee, J. et al. Sensitivity of MRI resonance frequency to the orientation of brain tissue microstructure. Proceedings of the National Academy of Sciences 107, 5130–5135 (2010).
6. He, X. & Yablonskiy, D. A. Biophysical mechanisms of phase contrast in gradient echo MRI. Proceedings of the National Academy of Sciences 106, 13558–13563 (2009).
7. Schweser, F., Sommer, K., Deistung, A. & Reichenbach, J. R. Quantitative susceptibility mapping for investigating subtle susceptibility variations in the human brain. NeuroImage 62, 2083–2100 (2012).
8. Wang, Y. et al. Clinical quantitative susceptibility mapping (QSM): Biometal imaging and its emerging roles in patient care. Journal of Magnetic Resonance Imaging 46, 951–971 (2017).
9. Eskreis‐Winkler, S. et al. The clinical utility of QSM: disease diagnosis, medical management, and surgical planning. NMR in Biomedicine 30, e3668 (2017).
10. Yablonskiy, D. A. & Sukstanskii, A. L. Effects of biological tissue structural anisotropy and anisotropy of magnetic susceptibility on the gradient echo MRI signal phase: theoretical background. NMR in Biomedicine 30, e3655 (2017).
11. Ruh, A. & Kiselev, V. G. Larmor frequency dependence on structural anisotropy of magnetically heterogeneous media. Journal of Magnetic Resonance 307, 106584 (2019).
12. Marques, J. P. & Bowtell, R. Application of a Fourier‐based method for rapid calculation of field inhomogeneity due to spatial variation of magnetic susceptibility. Concepts in Magnetic Resonance Part B: Magnetic Resonance Engineering 25B, 65–78 (2005).
13. Jochmann, T., Haueisen, J., Zivadinov, R. & Schweser, F. U2-Net for DEEPOLE QUASAR–A Physics-Informed Deep Convolutional Neural Network that Disentangles MRI Phase Contrast Mechanisms. (2019).
14. Schweser, F. & Zivadinov, R. Quantitative susceptibility mapping (QSM) with an extended physical model for MRI frequency contrast in the brain: a proof‐of‐concept of quantitative susceptibility and residual (QUASAR) mapping. NMR in Biomedicine (2018) doi:10.1002/nbm.3999.
15. Ronneberger, O., Fischer, P. & Brox, T. U-Net: Convolutional Networks for Biomedical Image Segmentation. arXiv:1505.04597 [cs] (2015).
16. Bollmann, S. et al. DeepQSM - using deep learning to solve the dipole inversion for quantitative susceptibility mapping. NeuroImage 195, 373–383 (2019).
17. Yoon, J. et al. Quantitative susceptibility mapping using deep neural network: QSMnet. NeuroImage 179, 199–206 (2018).
18. Jochmann, T., Haueisen, J. & Schweser, F. How to train a Deep Convolutional Neural Network for Quantitative Susceptibility Mapping (QSM). in International Society of Magnetic Resonance in Medicine (ISMRM) 28th Annual Meeting, Virtual Conference (2020).
19. Gudbjartsson, H. & Patz, S. The rician distribution of noisy mri data. Magnetic Resonance in Medicine 34, 910–914 (1995).
20. Bilgic, B. et al. QSM Reconstruction Challenge 2.0: Design and Report of Results. bioRxiv 2020.11.25.397695 (2020) doi:10.1101/2020.11.25.397695.
21. José P. Marques et al. QSM Reconstruction Challenge 2.0: a realistic in silico head phantom for MRI data simulation and evaluation of susceptibility mapping procedures. (submitted; Magn Reson Med).
22. Schweser, F. & Jochmann, T. [DEEPOLE] Parametric Maps for Digital Brain Model with Microstructure Effects. doi:10.5281/zenodo.3998284.
23. Schweser, F. & Jochmann, T. [DEEPOLE] Digital Brain Model GRE Data (with and without Microstructure Effects). doi:10.5281/zenodo.3998425.
24. Schweser, F. & Jochmann, T. Code for generating the phantom. doi:10.5281/zenodo.4021019.
25. Lawrenz, M. & Finsterbusch, J. Detection of microscopic diffusion anisotropy in human cortical gray matter in vivo with double diffusion encoding. Magnetic Resonance in Medicine 81, 1296–1306 (2019).
26. Yablonskiy, D. A., Luo, J., Sukstanskii, A. L., Iyer, A. & Cross, A. H. Biophysical mechanisms of MRI signal frequency contrast in multiple sclerosis. Proceedings of the National Academy of Sciences 109, 14212–14217 (2012).
Figures