0787
Submillimeter, Sub-Minute Quantitative Susceptibility Mapping using a Multi-Shot 3D-EPI with 2D CAIPIRINHA Acceleration1Centre for Advanced Imaging, University of Queensland, Brisbane, Australia, 2ARC Training Centre for Innovation in Biomedical Imaging Technology, University of Queensland, Brisbane, Australia, 3Siemens Healthcare Pty Ltd, Brisbane, Australia, 4School of Information Technology and Electrical Engineering, University of Queensland, Brisbane, Australia, 5High Field Magnetic Resonance Centre, Department of Biomedical Imaging and Image-guided Therapy, Medical University of Vienna, Vienna, Austria, 6Department of Neurology, Medical University of Graz, Graz, Austria
Synopsis
High-resolution Quantitative Susceptibility Mapping (QSM) has the potential to improve multiple sclerosis imaging and pre-surgical planning for deep brain stimulation. Using a conventional 3D-gradient echo sequence, imaging times for submillimeter scans can be as long as 8 to 15 minutes. In this work, we implemented a multi-shot 3D-EPI sequence combined with 2D CAIPIRINHA acceleration to achieve high-quality susceptibility maps, with no visible distortions, at 0.80 mm and 0.65 mm isotropic resolutions in 58 and 87 seconds, respectively. Multi-echo 3D-GRE sequences producing similar QSMs required up to a 9-fold increase in acquisition time.
Introduction
Quantitative Susceptibility Mapping (QSM) uses phase information to produce maps of magnetic susceptibility that give insight into tissue composition and structural organization. The conventional sequence for acquiring QSM data is a 3D gradient-echo (3D-GRE) which, coupled with the need for isotropic voxels, results in long scan times. This is particularly true for a number of applications where submillimeter voxel size and large imaging volumes are beneficial. For example, in detecting and evaluating the thin, iron-rich rim in multiple sclerosis (MS) lesions, associated with more progressive MS phenotypes1; detection of cerebral micro-bleeds (CMBs)2; and in deep brain stimulation (DBS) pre-surgical mapping, where submillimeter QSM has been shown to provide superior delineation of features of the subthalamic nuclei3. In each of these cases, scan times can be as long as 8 to 15 minutes1,2,3. 3D-EPI4 phase data can produce high-quality susceptibility-based images at reduced scan times5,6,7. When a muli-shot acquisition approach is used, typical EPI artefacts, such as blurring and distortions, can also be reduced.6,7 Previous submillimeter imaging has used multi-shot 3D-EPI to produce QSMs with isotropic resolutions of 0.65 mm and 0.55 mm in 3 to 4 minutes using GRAPPA or SENSE acceleration schemes7,8. In this work, we implemented a multi-shot 3D-EPI sequence combined with 2D-CAIPIRINHA acceleration to achieve high-quality susceptibility maps, with no visible distortions, at 0.80 mm and 0.65 mm isotropic resolutions in 58 and 87 seconds, respectively.Methods
All images were acquired on a MAGNETOM Prisma 3T MR scanner (Siemens Healthcare, Erlangen, Germany) on software version syngo.MR E11 with a 64-channel head/neck coil. The prototype 3D-EPI sequence used a binomial water excitation RF pulse with TBW = 24, FA = 16º, FOV = 250 mm, EPI Factor = 13, BW = 395 Hz/pixel. Table 1 shows the TE/TR and acquisition times (TA) for protocols using different submillimeter resolutions and acceleration factors. For CAIPIRINHA acceleration, a shift = 1 was applied in the kz direction. A multi-echo 3D-GRE sequence with FA = 15º, FOV=250 mm, BW = 210 Hz/Px was acquired for comparison. Data were processed offline with the QSMxT pipeline, using TGV-QSM5 with brain masks produced by thresholding the signal magnitude and morphological filling operations. For the multi-echo 3D-GRE, phase data were combined over coils online using ASPIRE9, QSMs were reconstructed for each echo with an echo-dependent mask, and the final QSMs were computed as the average across all echoes.Results and Discussion
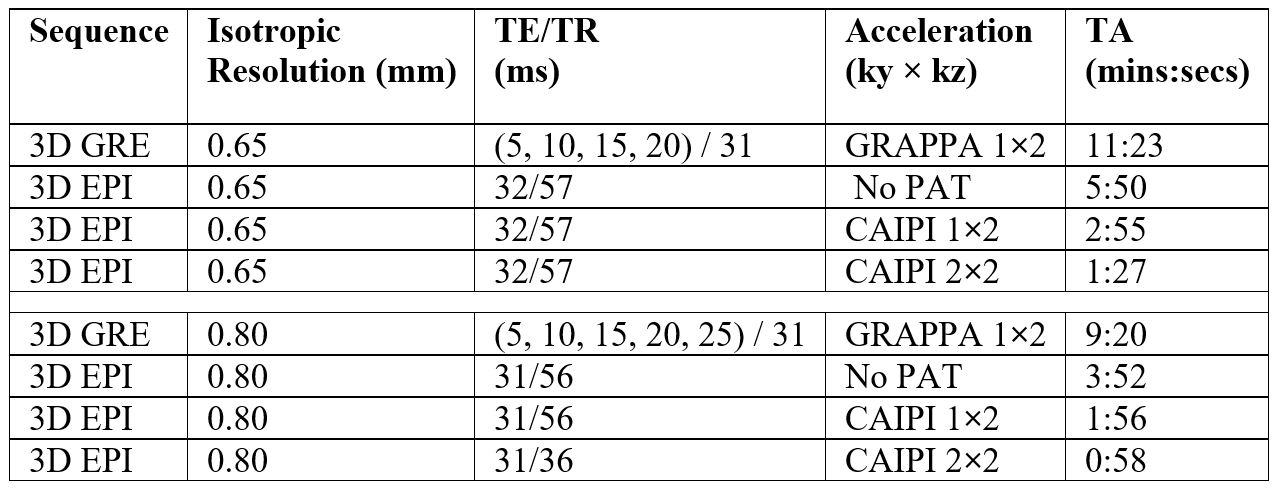
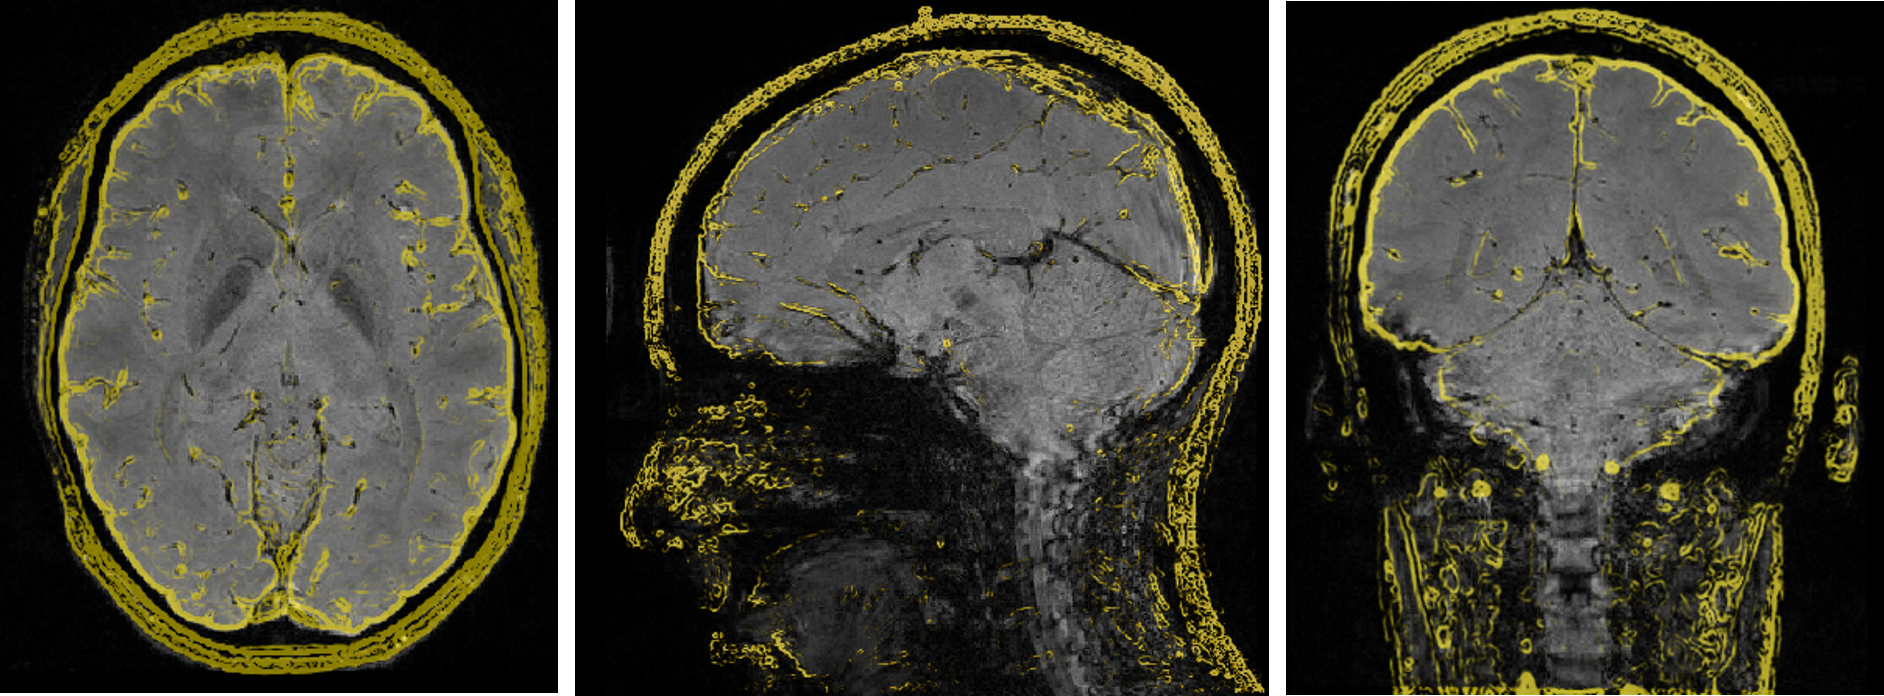
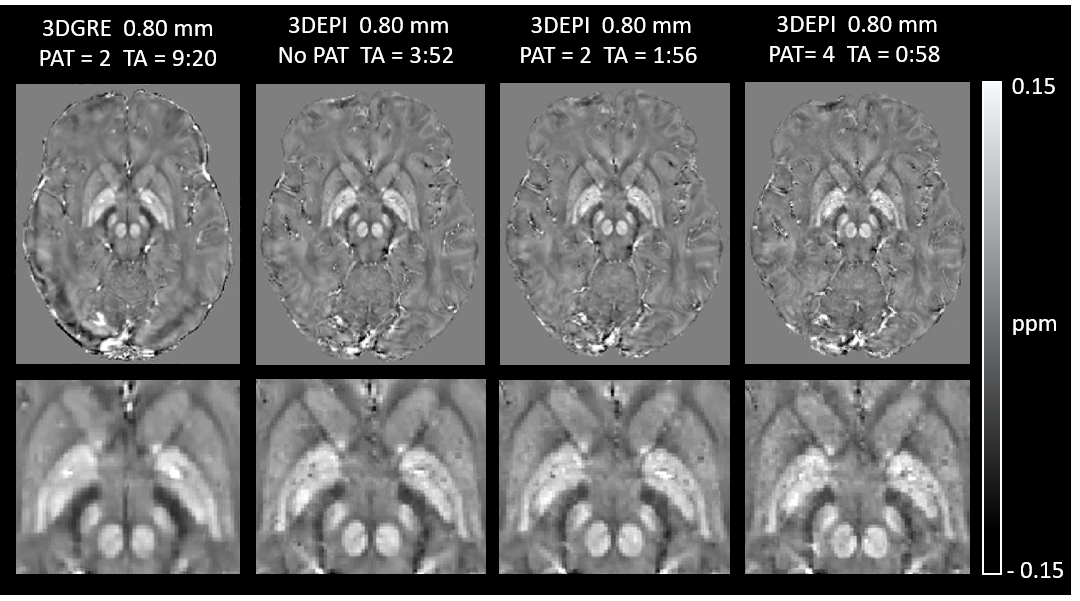
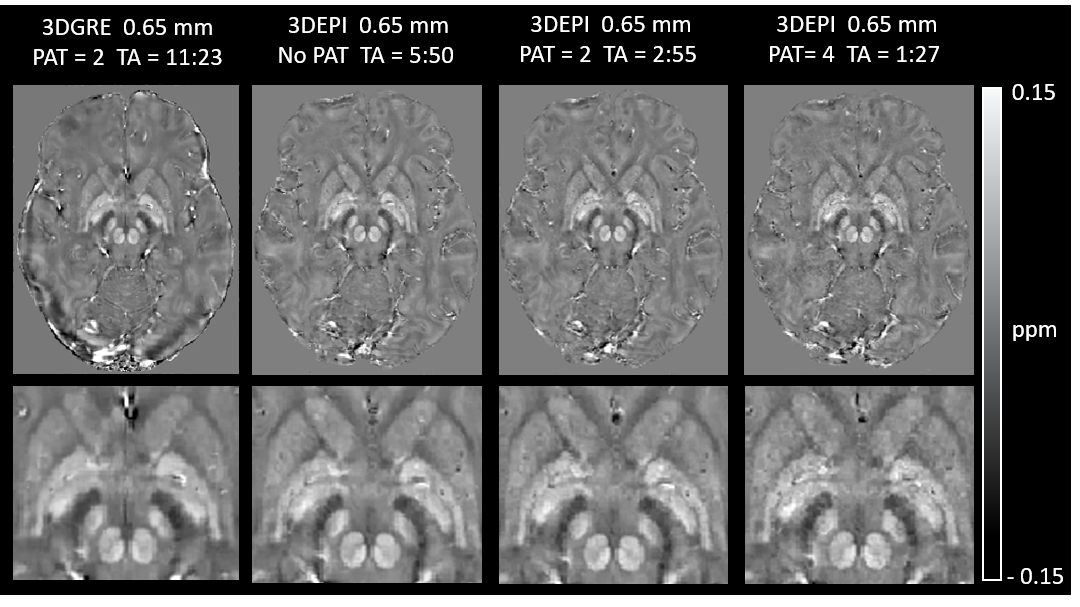
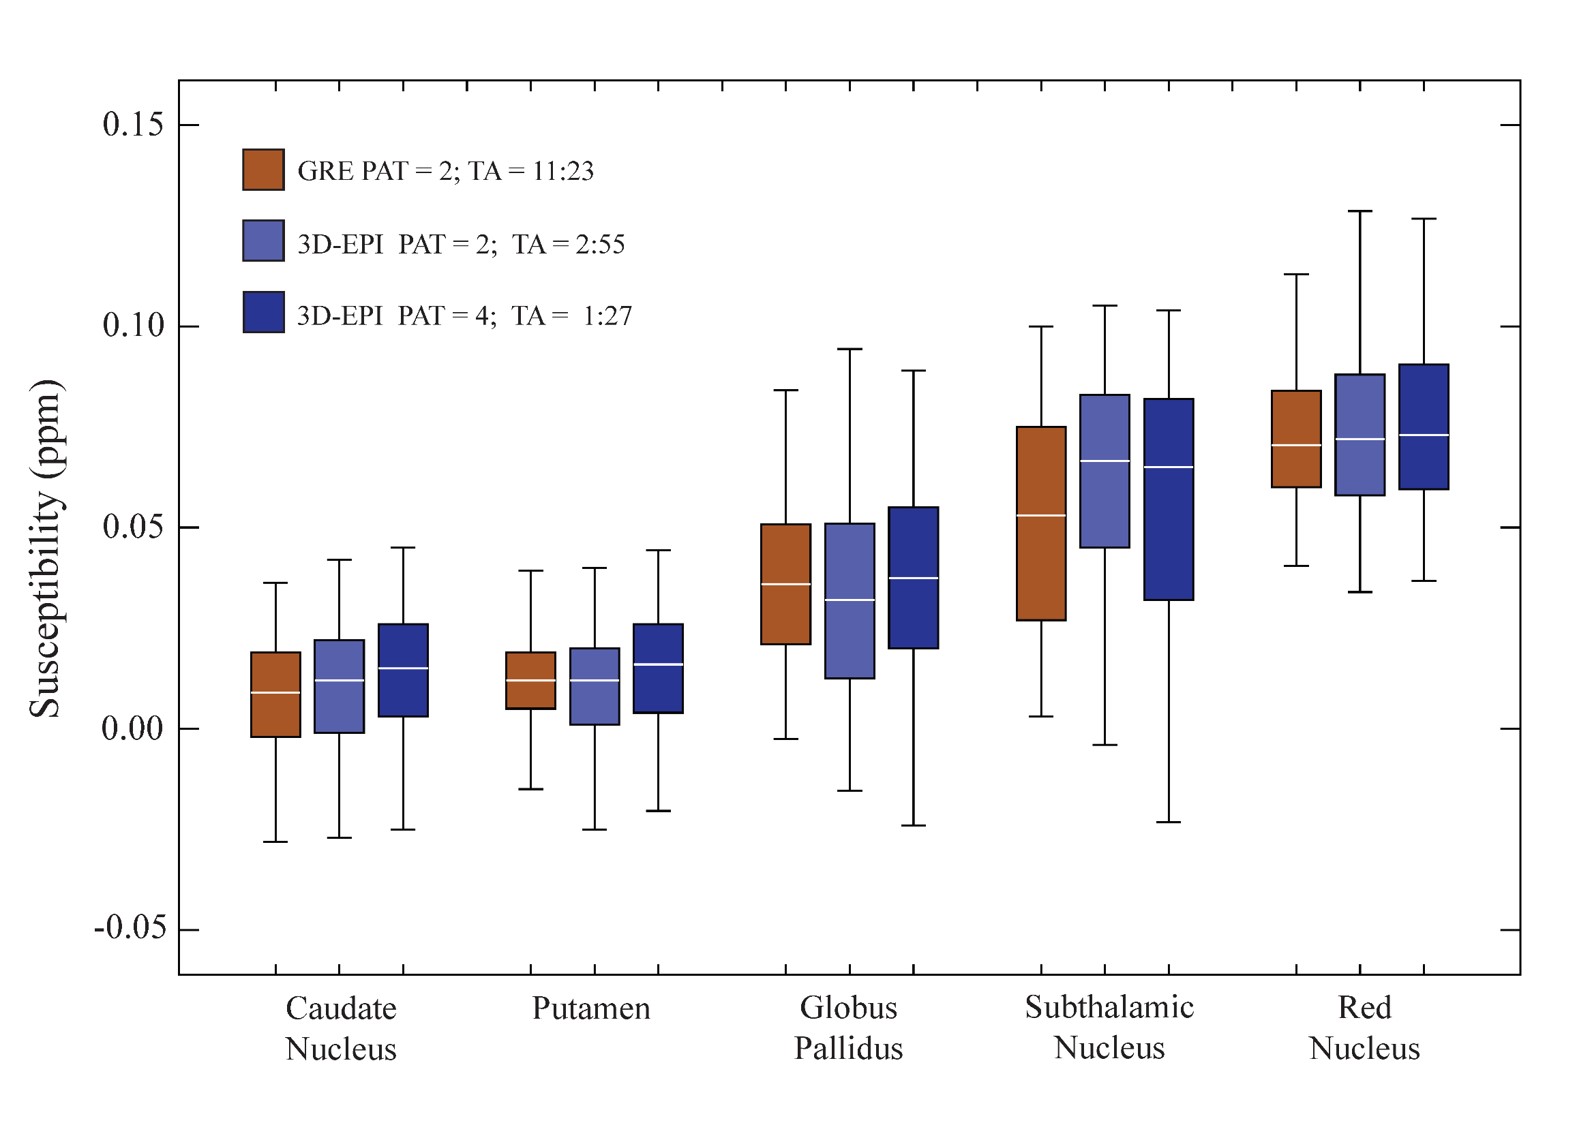
Figure 1 shows example axial, sagittal and coronal 3D-EPI images at 0.65 mm resolution with features from the corresponding 3D-GRE acquisition overlayed in yellow. B0–related distortion correction was not performed, as no obvious distortions were observed. Reducing the length of the echo train through segmentation reduces distortions and shifts in echo time, which could also potentially affect derived susceptibility values. In this work, an EPI factor of 13 (13 phase-encoding lines per shot) was a good compromise between acquisition time and a reduction in EPI artefacts. Susceptibility maps for the 0.8 mm and 0.65 mm resolution 3D-GRE and 3D-EPI scans are shown in Figures 2 and 3. The 3D-GRE QSM is visibly smoother, with higher SNR than the 3D-EPI as a result of the multi-echo acquisition and lower receiver bandwidth. However, the contrast of the maps and the ability to differentiate between anatomical structures are comparable across the sequences and increasing acceleration factors. This is further demonstrated in Figure 4, which shows the distribution of measured susceptibility values for five regions of interest. Given the difference in echo times for the 3D-GRE and 3D-EPI acquisitions, some variation in susceptibility values can be expected10. For the 3D-GRE acquisitions, TR, and as a result TE, was kept as short as possible to avoid acquisition times longer than 12 minutes. The 3D-EPI sequence could achieve a shorter TE than the one used here, for example 15 to 20 ms, by increasing the number of shots (decreasing the EPI factor) with a cost to total acquisition time, or by employing partial Fourier in the ky direction. Despite the variations in TE, the susceptibility distributions are comparable across the sequences, and are comparable to values previously reported in the literature5,6. The spread of values for each region was typically larger for the 3D-EPI sequences than the 3D-GRE, but did not always increase with increasing acceleration factor. The difference in spread of values across the sequences may be a result of the lower SNR in the 3D-EPI acquisitions, or the different TE. Future work will focus on evaluating the reduced sensitivity to motion of the 3D-EPI sequence.Conclusion
We have demonstrated that the multi-shot 3D-EPI sequence with 2D CAIPIRINHA acceleration presented here can produce high-quality susceptibility maps at 3 T with minimal blurring and distortion at 0.8 mm and 0.65 mm isotropic resolution in 57 and 87 seconds, respectively. Multi-echo 3D-GRE sequences producing similar QSMs required up to a 9-fold increase in acquisition time.Acknowledgements
This research was funded by the Australian Government through the Australian Research Council (project number IC170100035). SB acknowledges funding from the NHMRC-NIH BRAIN Initiative Collaborative Research Grant APP1117020, NIH grant 1R01MH111419.References
1. B. Tolaymat, et al. Multiple Sclerosis and Related Disorders 45 (2020): 102317.
2. M.J. Cronin, et al. Neuroimage 149 (2017): 98-113.
3. A.V. Dimov, et al. Journal of neurosurgery 131.2 (2018): 360-367.
4. B.A. Poser, et al, Neuroimage, 51 (2010), 261–266.
5. C. Langkammer, et al., Neuroimage, 111 (2015), 622–630.
6. D. Stäb, et al., NMR in Biomedicine, 30.4 (2017): e3620.
7. S. Patil, et al., ISMRM (2018) Abstract No: 5289
8. P. Sati, et al., Multiple Sclerosis Journal (2014): 1464-1470
9. K. Eckstein, et al., Magnetic resonance in medicine. 2018 Jun;79(6):2996-3006
10. S. Sood, et al., Magnetic resonance in medicine 77.5 (2017): 1946-1958.
Figures