0780
Asymmetric GOIA pulses for highly selective B1 and T1 independent outer volume suppression1Department of Radiology and Biomedical Imaging, Magnetic Resonance Research Center, Yale University, New Haven, CT, United States
Synopsis
An asymmetric GOIA pulse was developed (Tp = 6.66 ms, BW = 20 kHz) by combining two adiabatic half passage pulses (hyperbolic secant and hyperbolic tangent GOIA modulations). The pulse achieves an asymmetrical excitation/inversion profile, thus was used in a multi-pulse OVS sequence to achieve an efficient, highly-selective, B1 and T1-independent signal suppression with a transition width of only 1.7% of the bandwidth.
Introduction
Highly selective RF pulses provide the ability to interrogate tissues of interest in close proximity to contaminant tissue types (eg skull lipids). Localization performance of an RF pulse or a sequence of pulses, can be primarily characterized by the selectivity factor (bandwidth (BW) to transition width (TW) ratio), and fractional chemical shift displacement (CSD). CSD can be reduced by moving towards high BW pulses, such as GOIA pulses1 without reaching prohibitive SAR. High selectivity RF pulses have been achieved with: 1) very selective pulses for outer volume suppression (OVS)2, 2) and asymmetric adiabatic full passage (AFP) pulses3. However, such highly selective pulses have limited BW, or become SAR intensive for increased BW. In this study we have developed a highly selective GOIA asymmetric pulse (Tp = 6.66 ms, BW = 20 kHz) that combines the power efficiency of GOIA pulses, and selectivity of asymmetric AFP pulses, for applications in in vivo MRS and MRSI.Methods
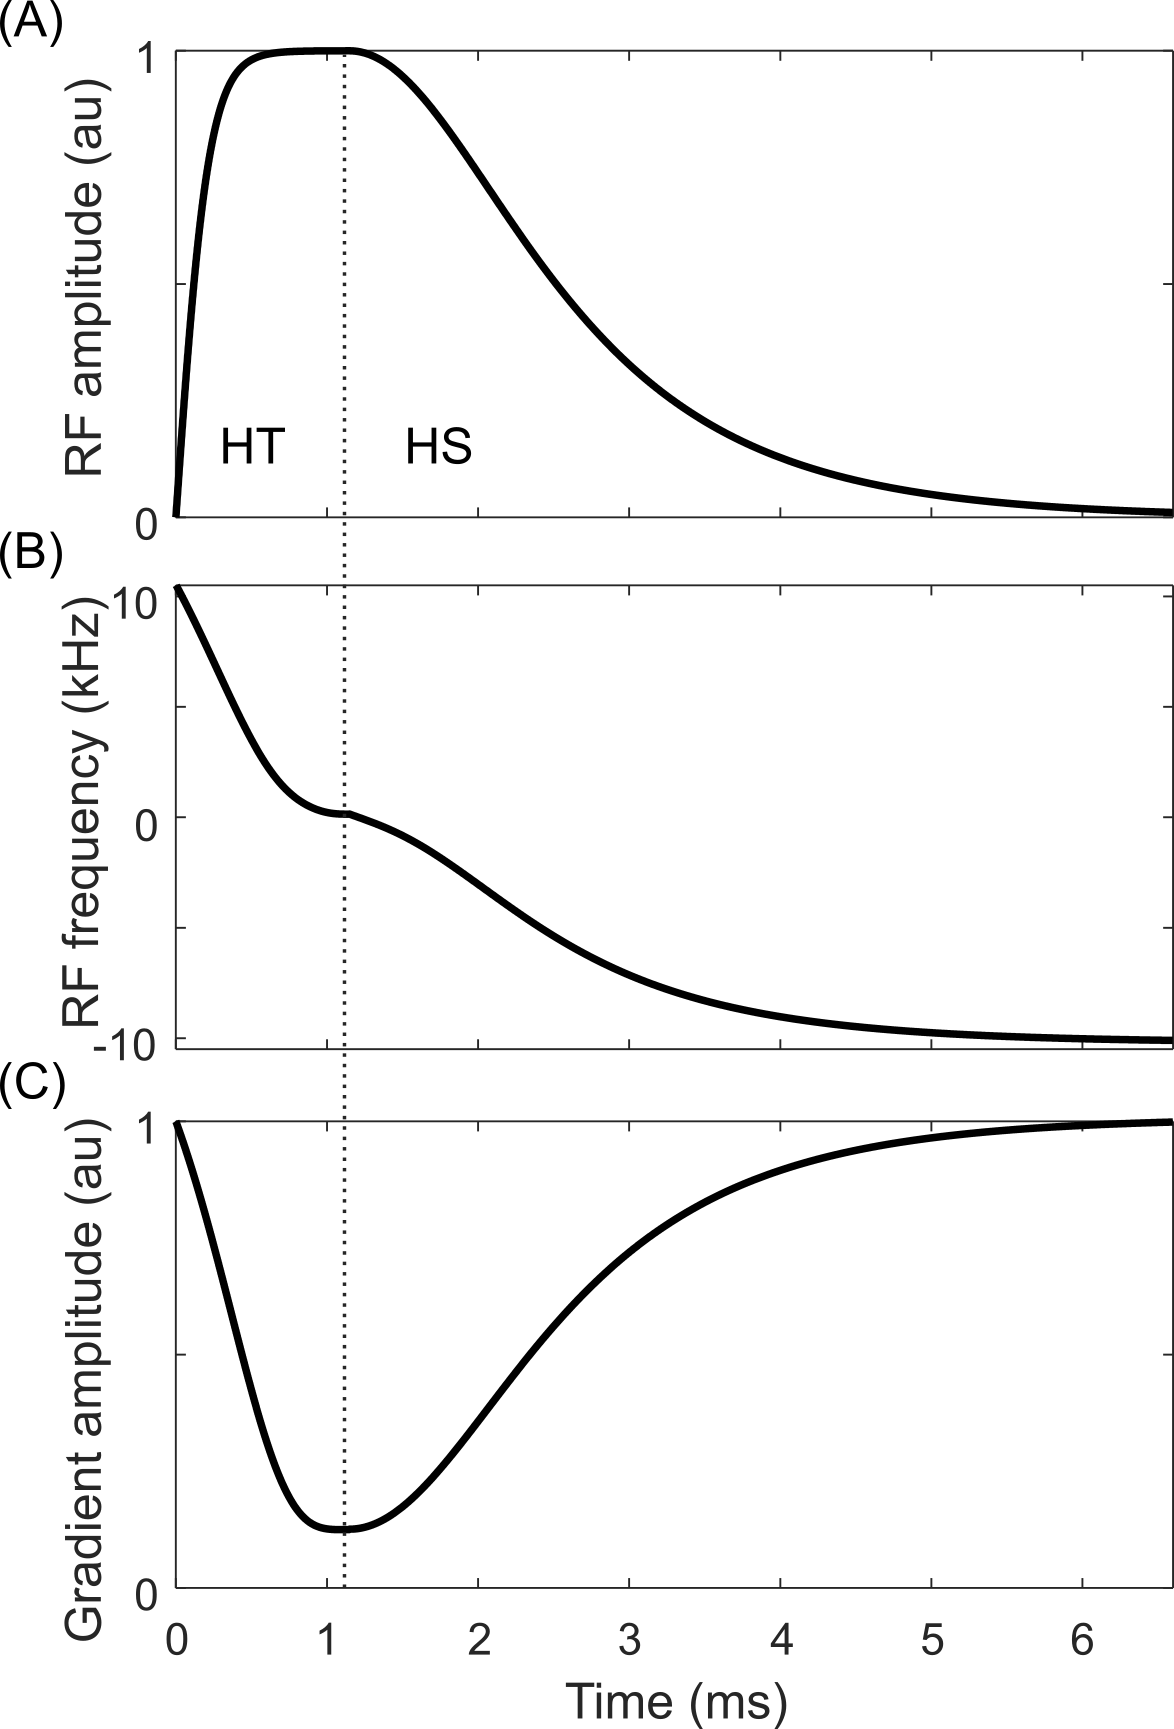
The asymmetric GOIA pulse constitutes of hyperbolic secant (HS) and hyperbolic tangent (HT) modulations, similar to previous reports3. The GOIA HS pulse has amplitude modulation (AM) and gradient modulation (GM) exponents (AM, GM) of (1, 1) with a BW x length product (= R) of 248. The GOIA HT pulse has (AM, GM) exponents of (1,4), with an R = 22 (Figure 1). A gradient amplification factor GA = 8 was used for both pulses. The frequency modulation (FM) function was computed numerically according to the GOIA algorithm1.The asymmetric GOIA pulse (hereafter labelled GOIA-asymmetric) was compared against two reference RF pulses with similar power requirements to achieve saturation: 1) an HS2 pulse with R = 40, and 2) a GOIA-HS4 pulse with R = 133 and GA = 5. The GOIA-HS4 was selected as it provides excellent TW metrics.
Though the developed GOIA-asymmetric pulse has a skewed inversion profile, saturation across the slice (Mz/M0 <0) is achieved efficiently; thus was integrated within a 4-pulse OVS configuration (analogous to a WET4 styled water suppression method) to achieve B1 and T1 independent OVS. The four pulses in the OVS method are place 1181, 560, 218, and 50 ms before the excitation pulse with relative B1 amplitudes of 0.64, 0.71, 0.83, and 1, respectively, as previously described5.
All MR experiments were performed on a 4T 94 cm Medspec scanner (Bruker corporation. Ettlingen, Germany). An 8-element Tx/Rx volume head coil was used for all experiments. The system contains actively shielded gradients capable of switching 30 mT/m in 1150 µs. The ECLIPSE system6 is a home-built, unshielded gradient insert consisting of Z2, X2Y2, and XY second order spherical harmonic magnetic fields, interfaced to a home-built multi-channel gradient controller7.
Results
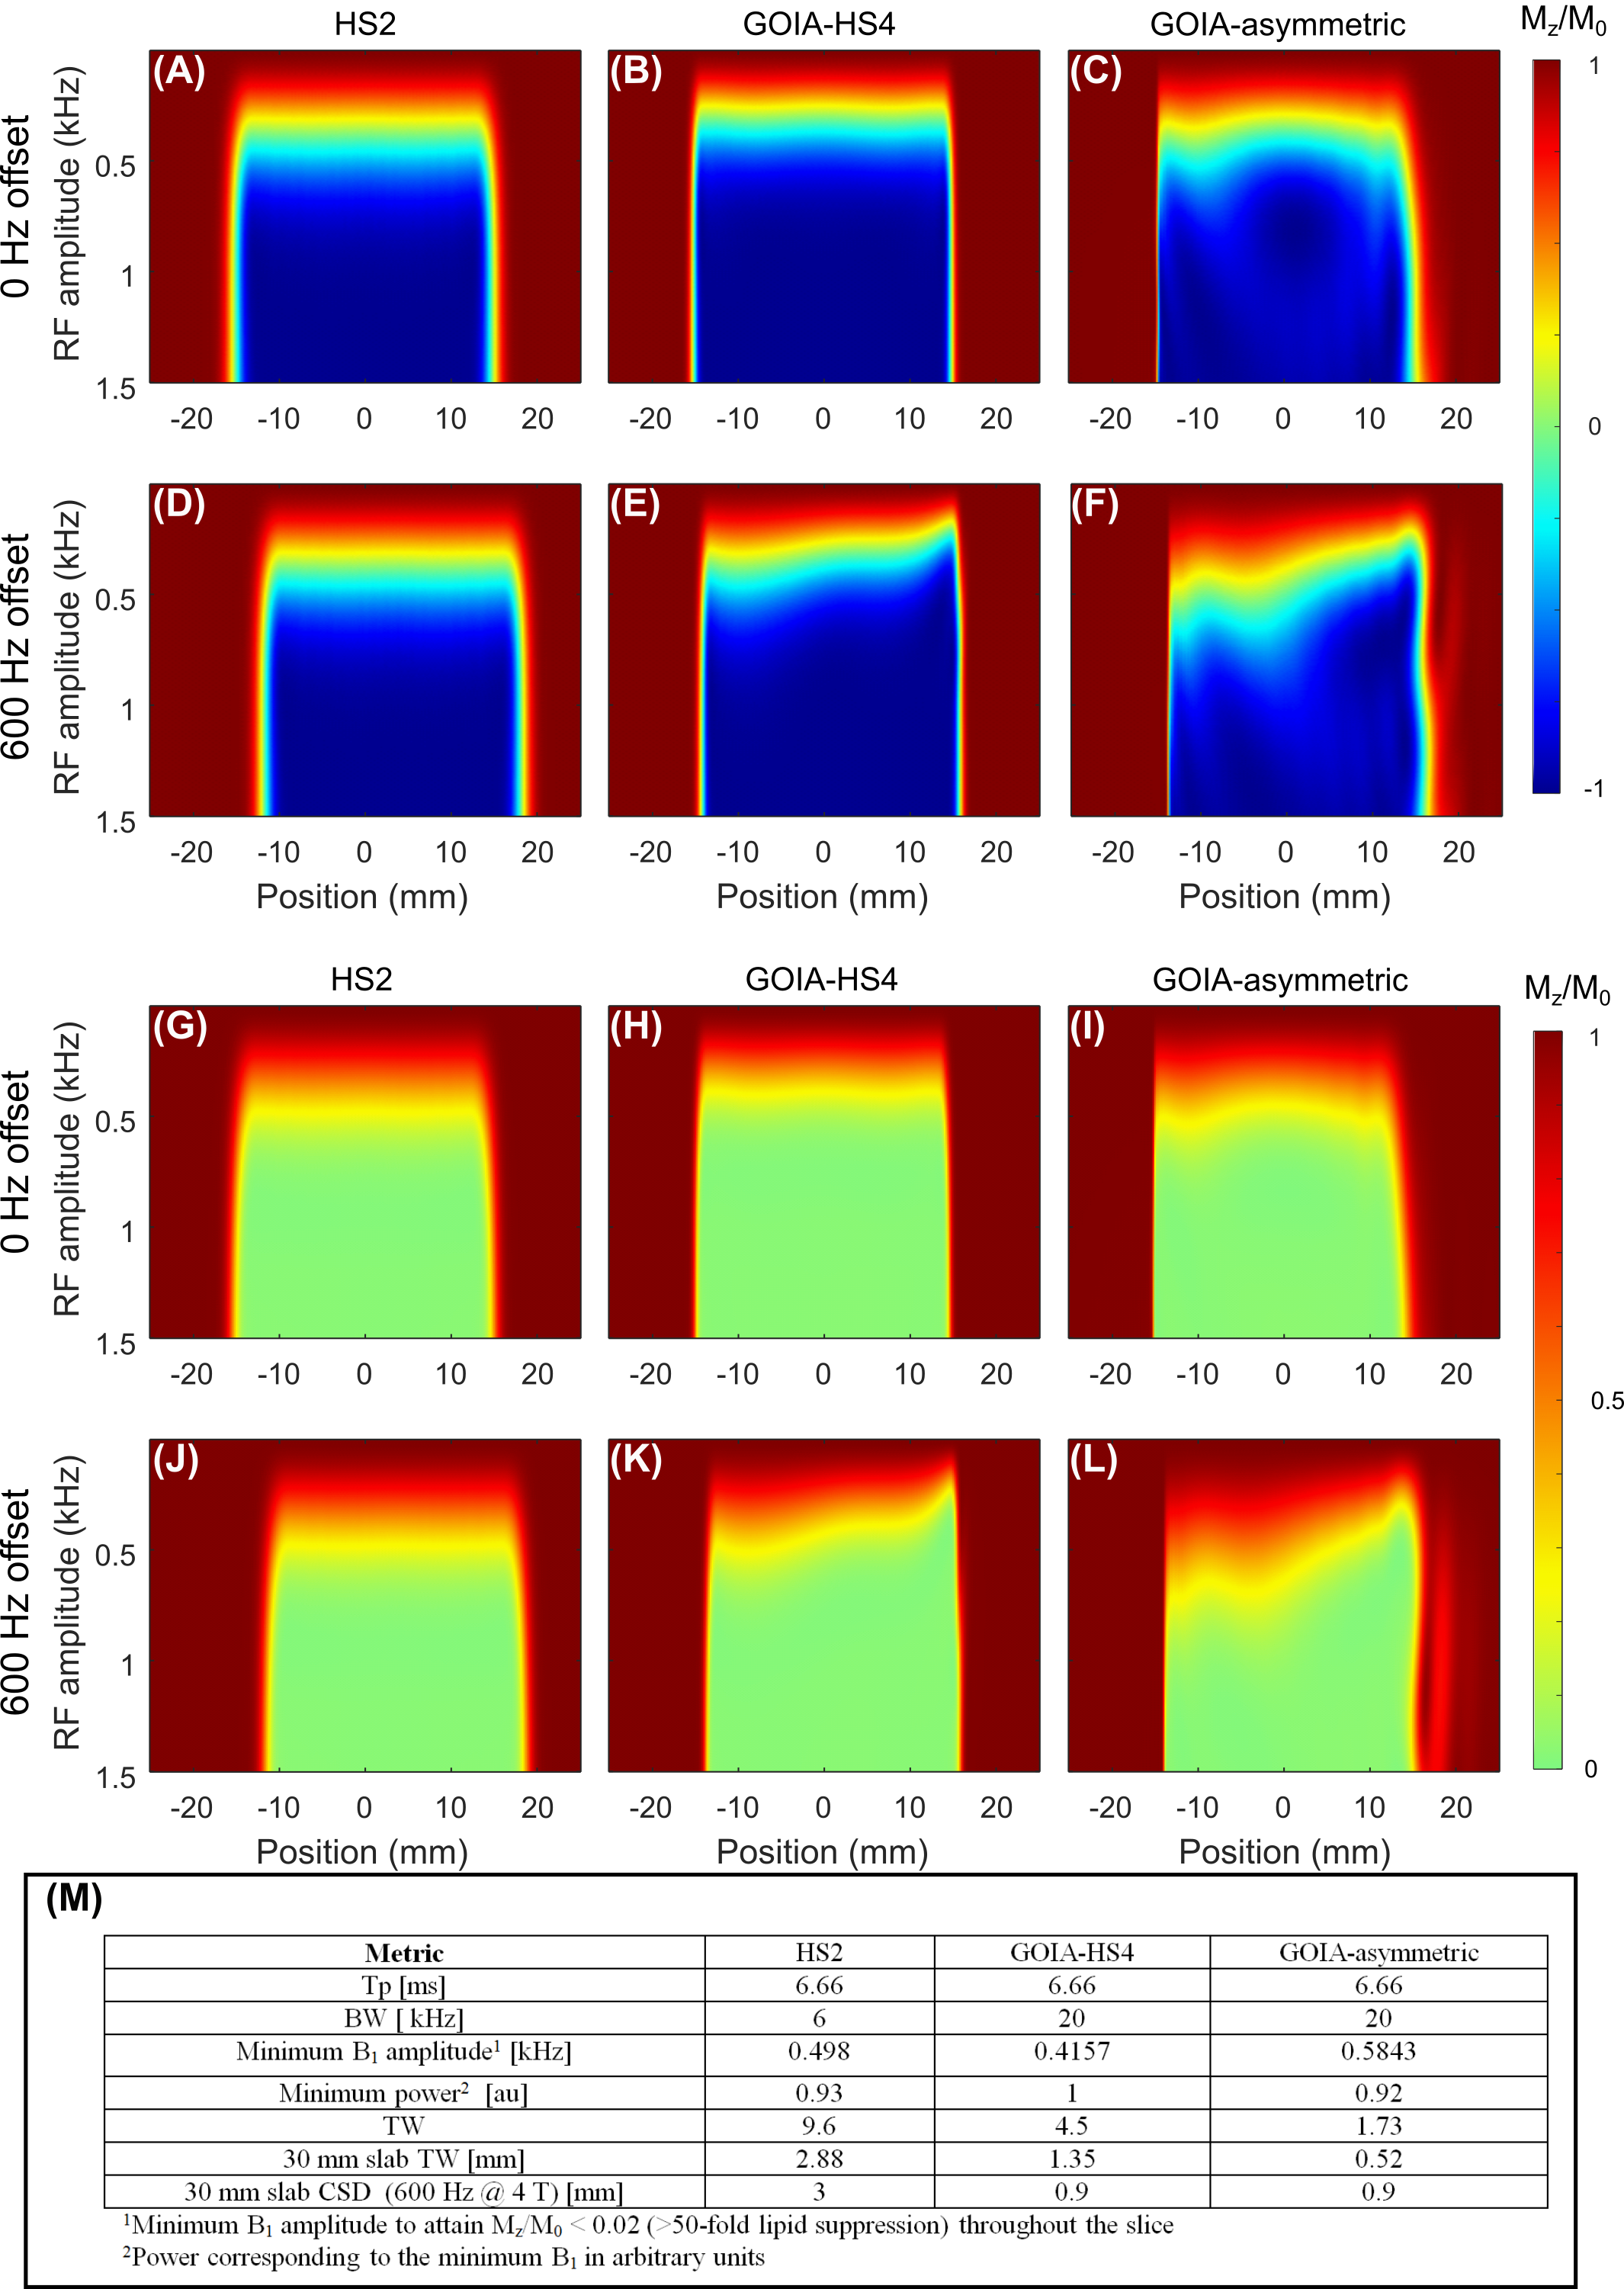
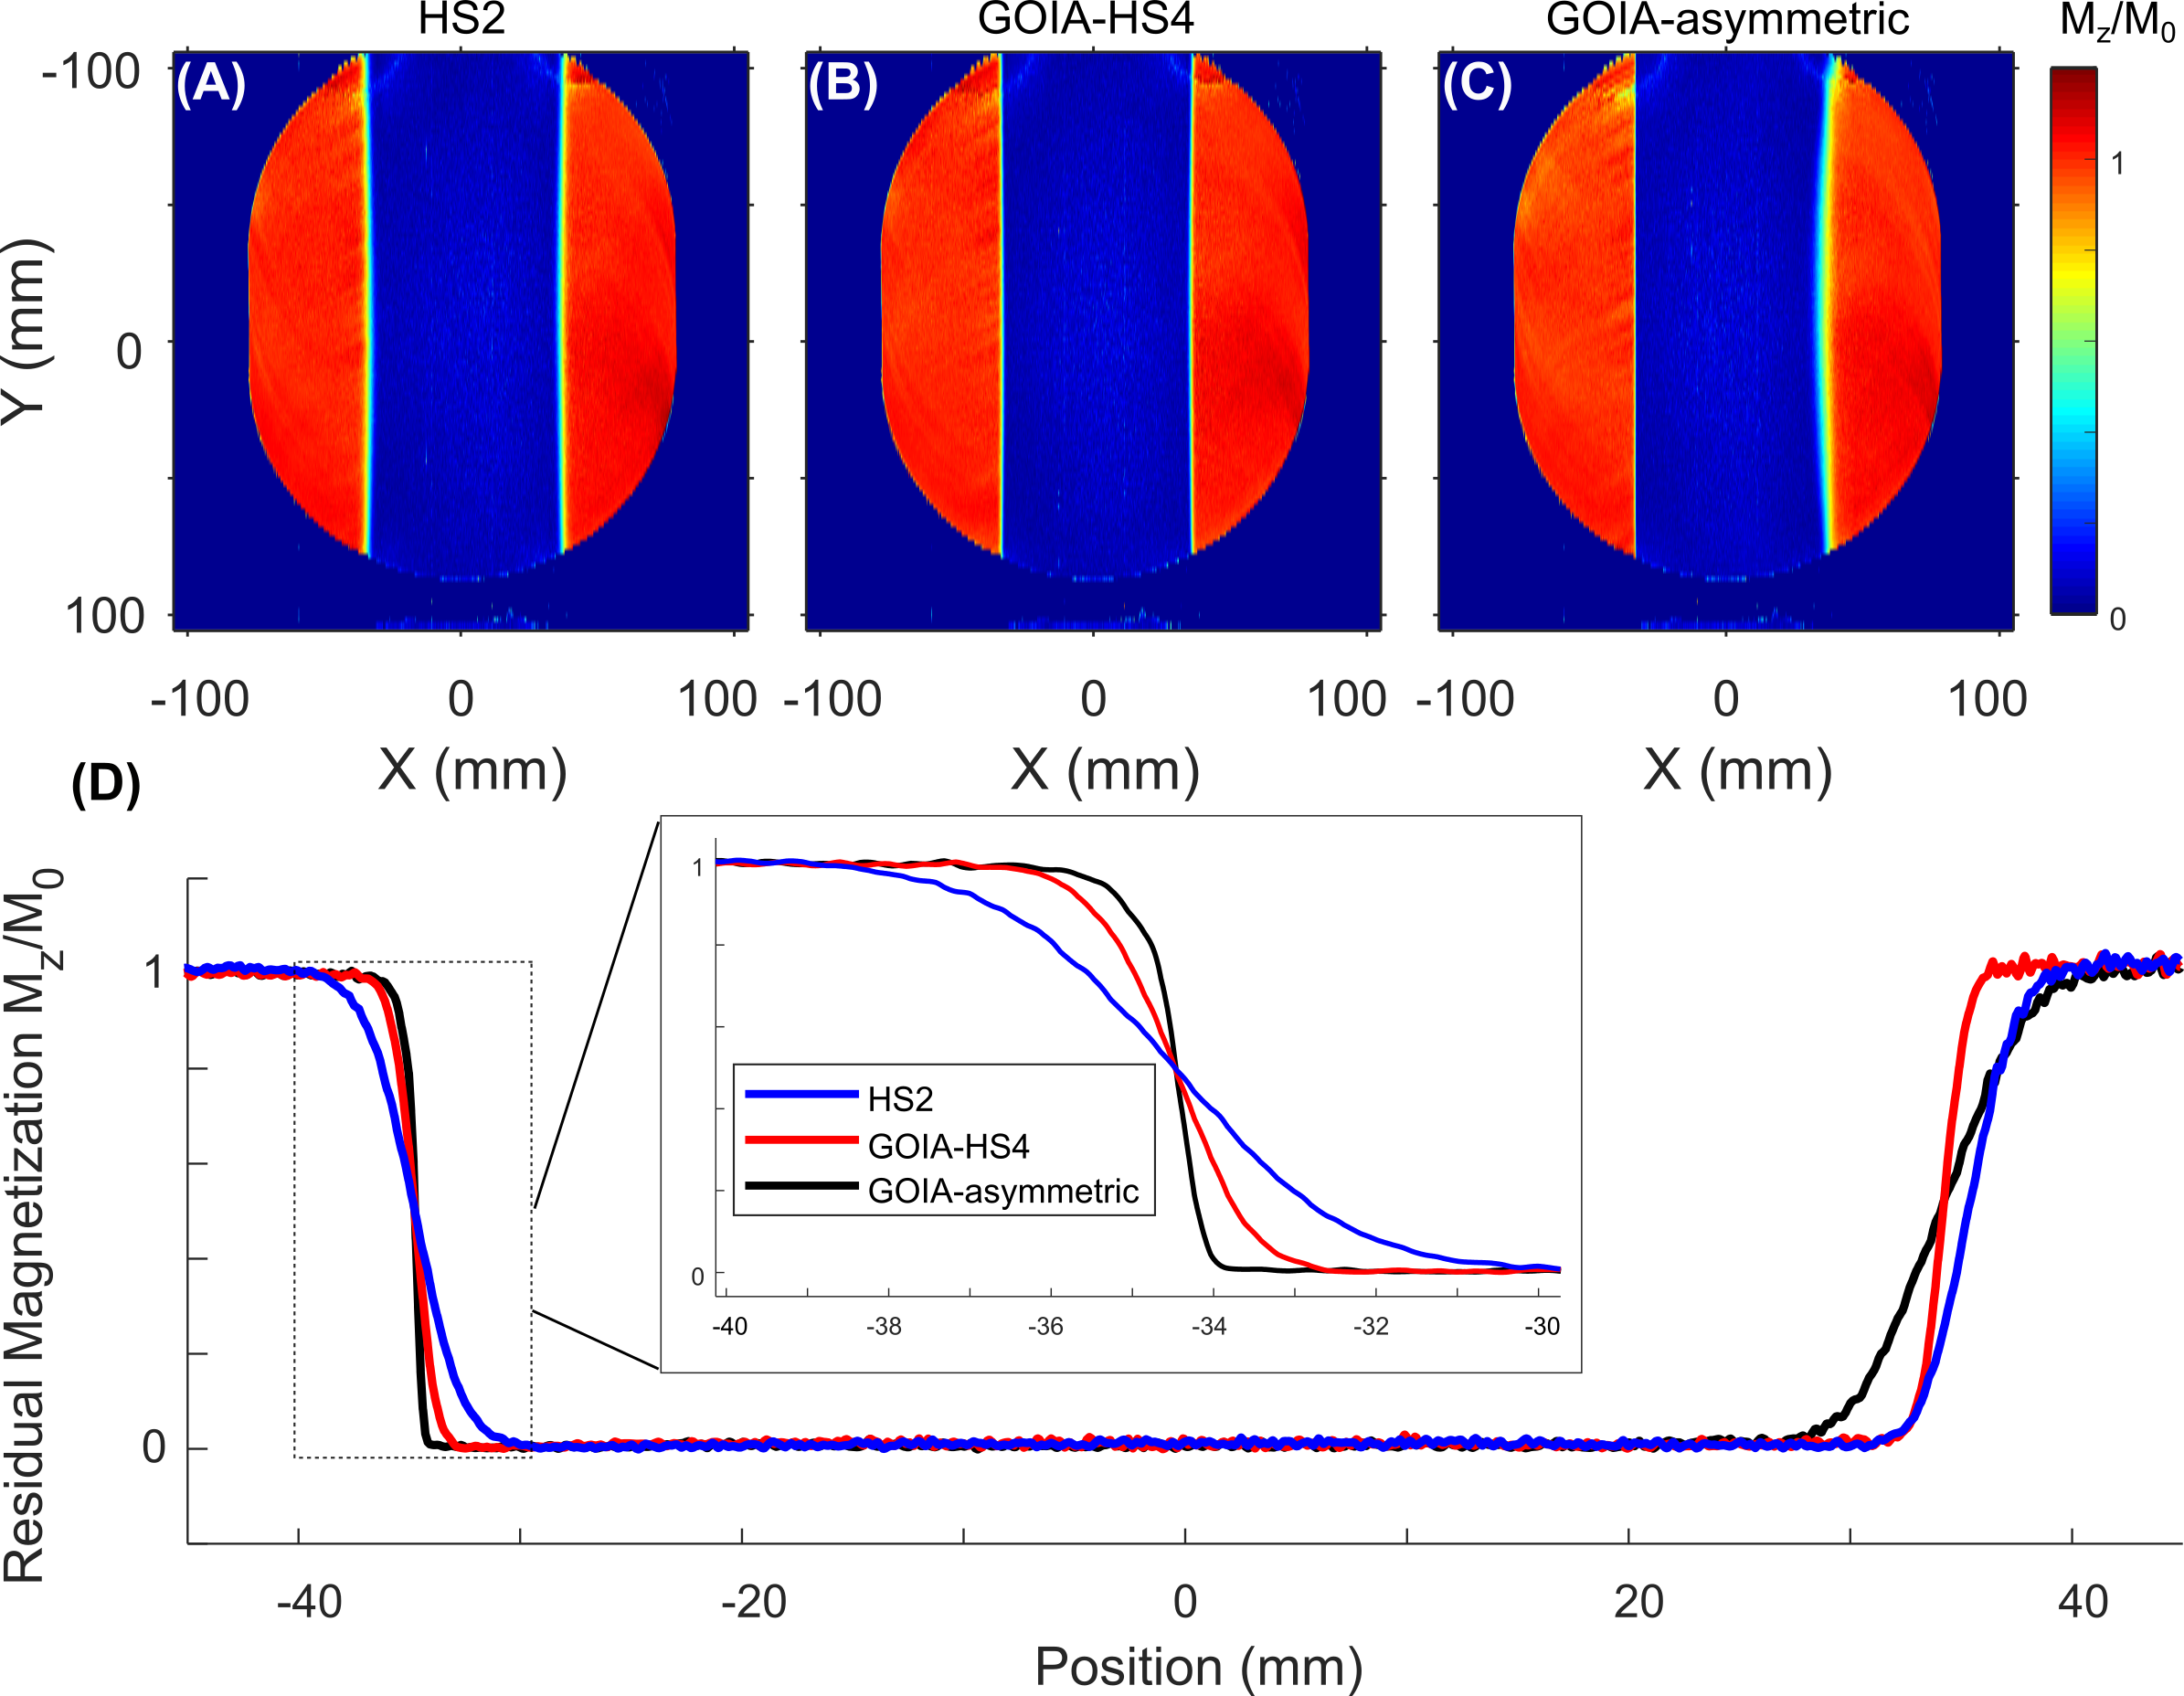
Figure 2 illustrates Bloch simulations for the three pulses vs B1 amplitude for on-resonance (A-C) and (D-F) 600 Hz off-resonance conditions. Figure 2 (G-L) illustrate residual (Mz/M0), given T1 = 400 ms, for the three RF pulses within the 4-pulse OVS module as described in the order presented in (A-F). (M) Summary of metrics for the three RF pulses in simulation. TW of the GOIA-asymmetric pulse is 1.7%, which represents a > 2-fold improvement relative to the GOIA-HS4 pulse.Figure 3 illustrates localization performance in a silicone oil phantom with the three pulse types (A-C), (D) spatial traces along the X direction for the cases in (A-C). The experimentally measured mean TW fractions for the HS2, GOIA-HS4, and GOIA-asymmetric pulses are 9.2%, 4.0%, and 1.9%, respectively, in good agreement with the simulated values.
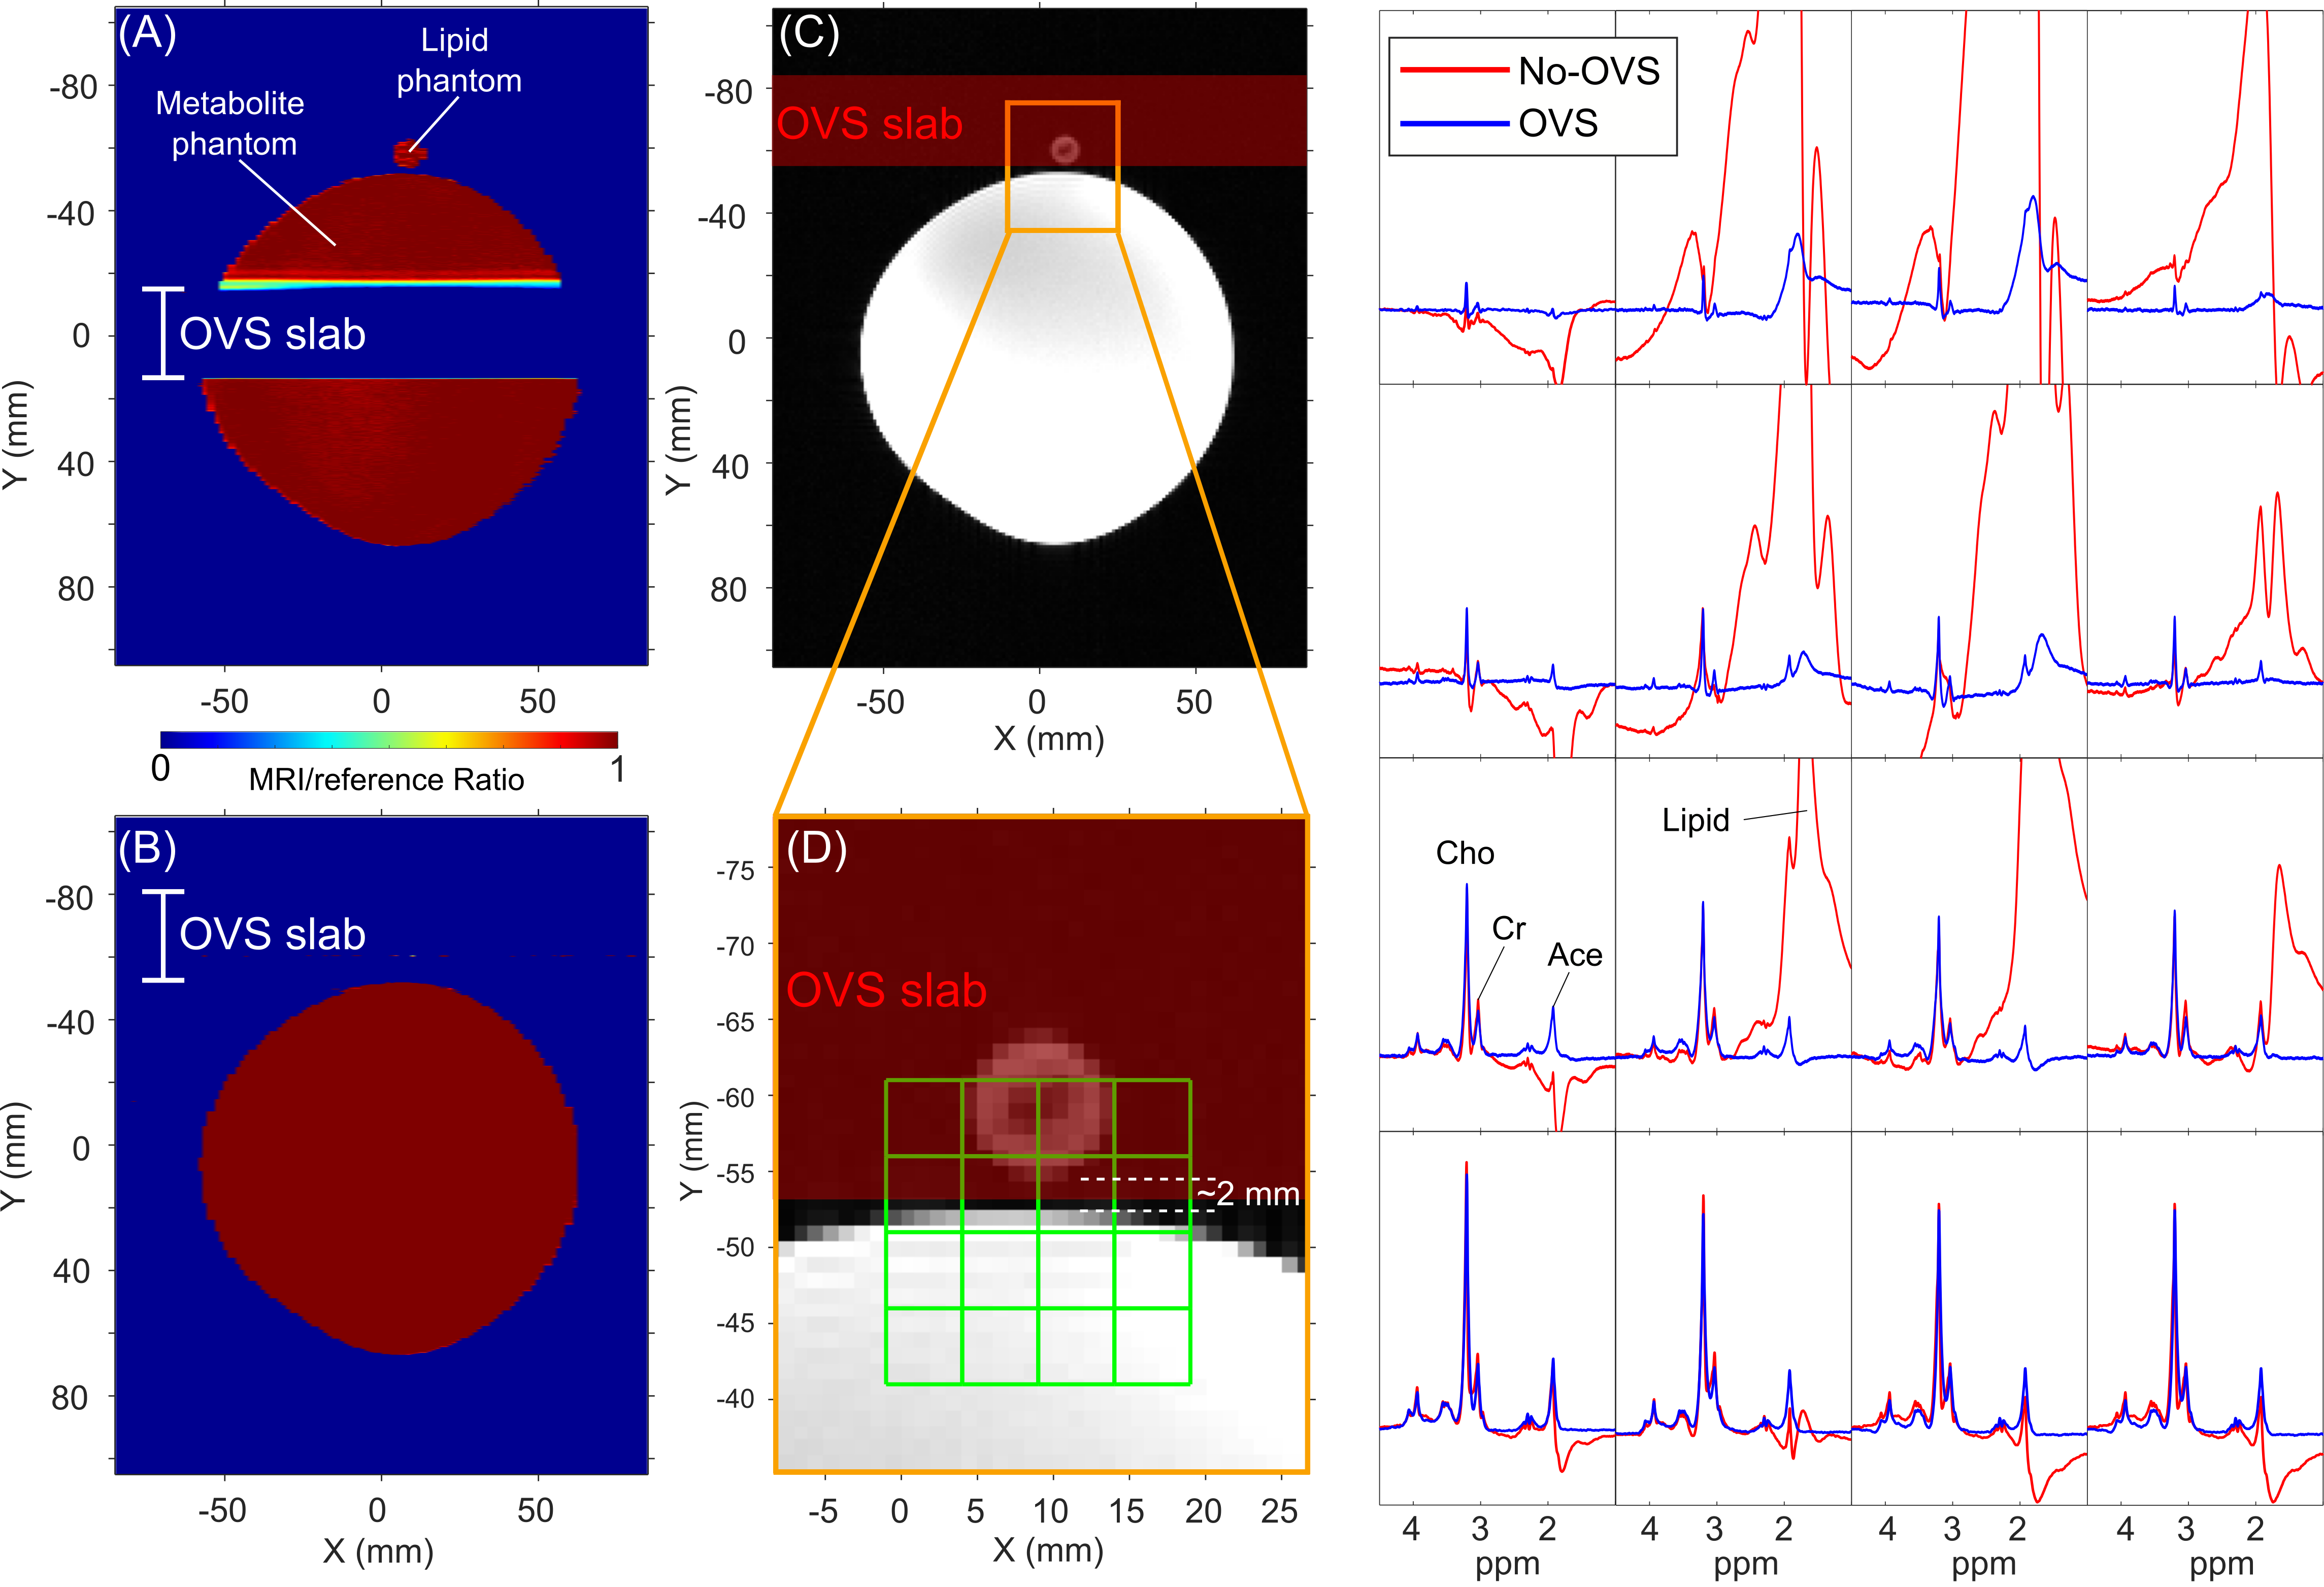
Figure 4 illustrates an MRSI acquisition with a 3 cm OVS slab between a small lipid phantom and large metabolite phantom separated by ~ 2 mm. Excellent lipid suppression for voxels within the phantom are seen, with no apparent signal losses due to CSD or TW at edge-of-ROI voxels.
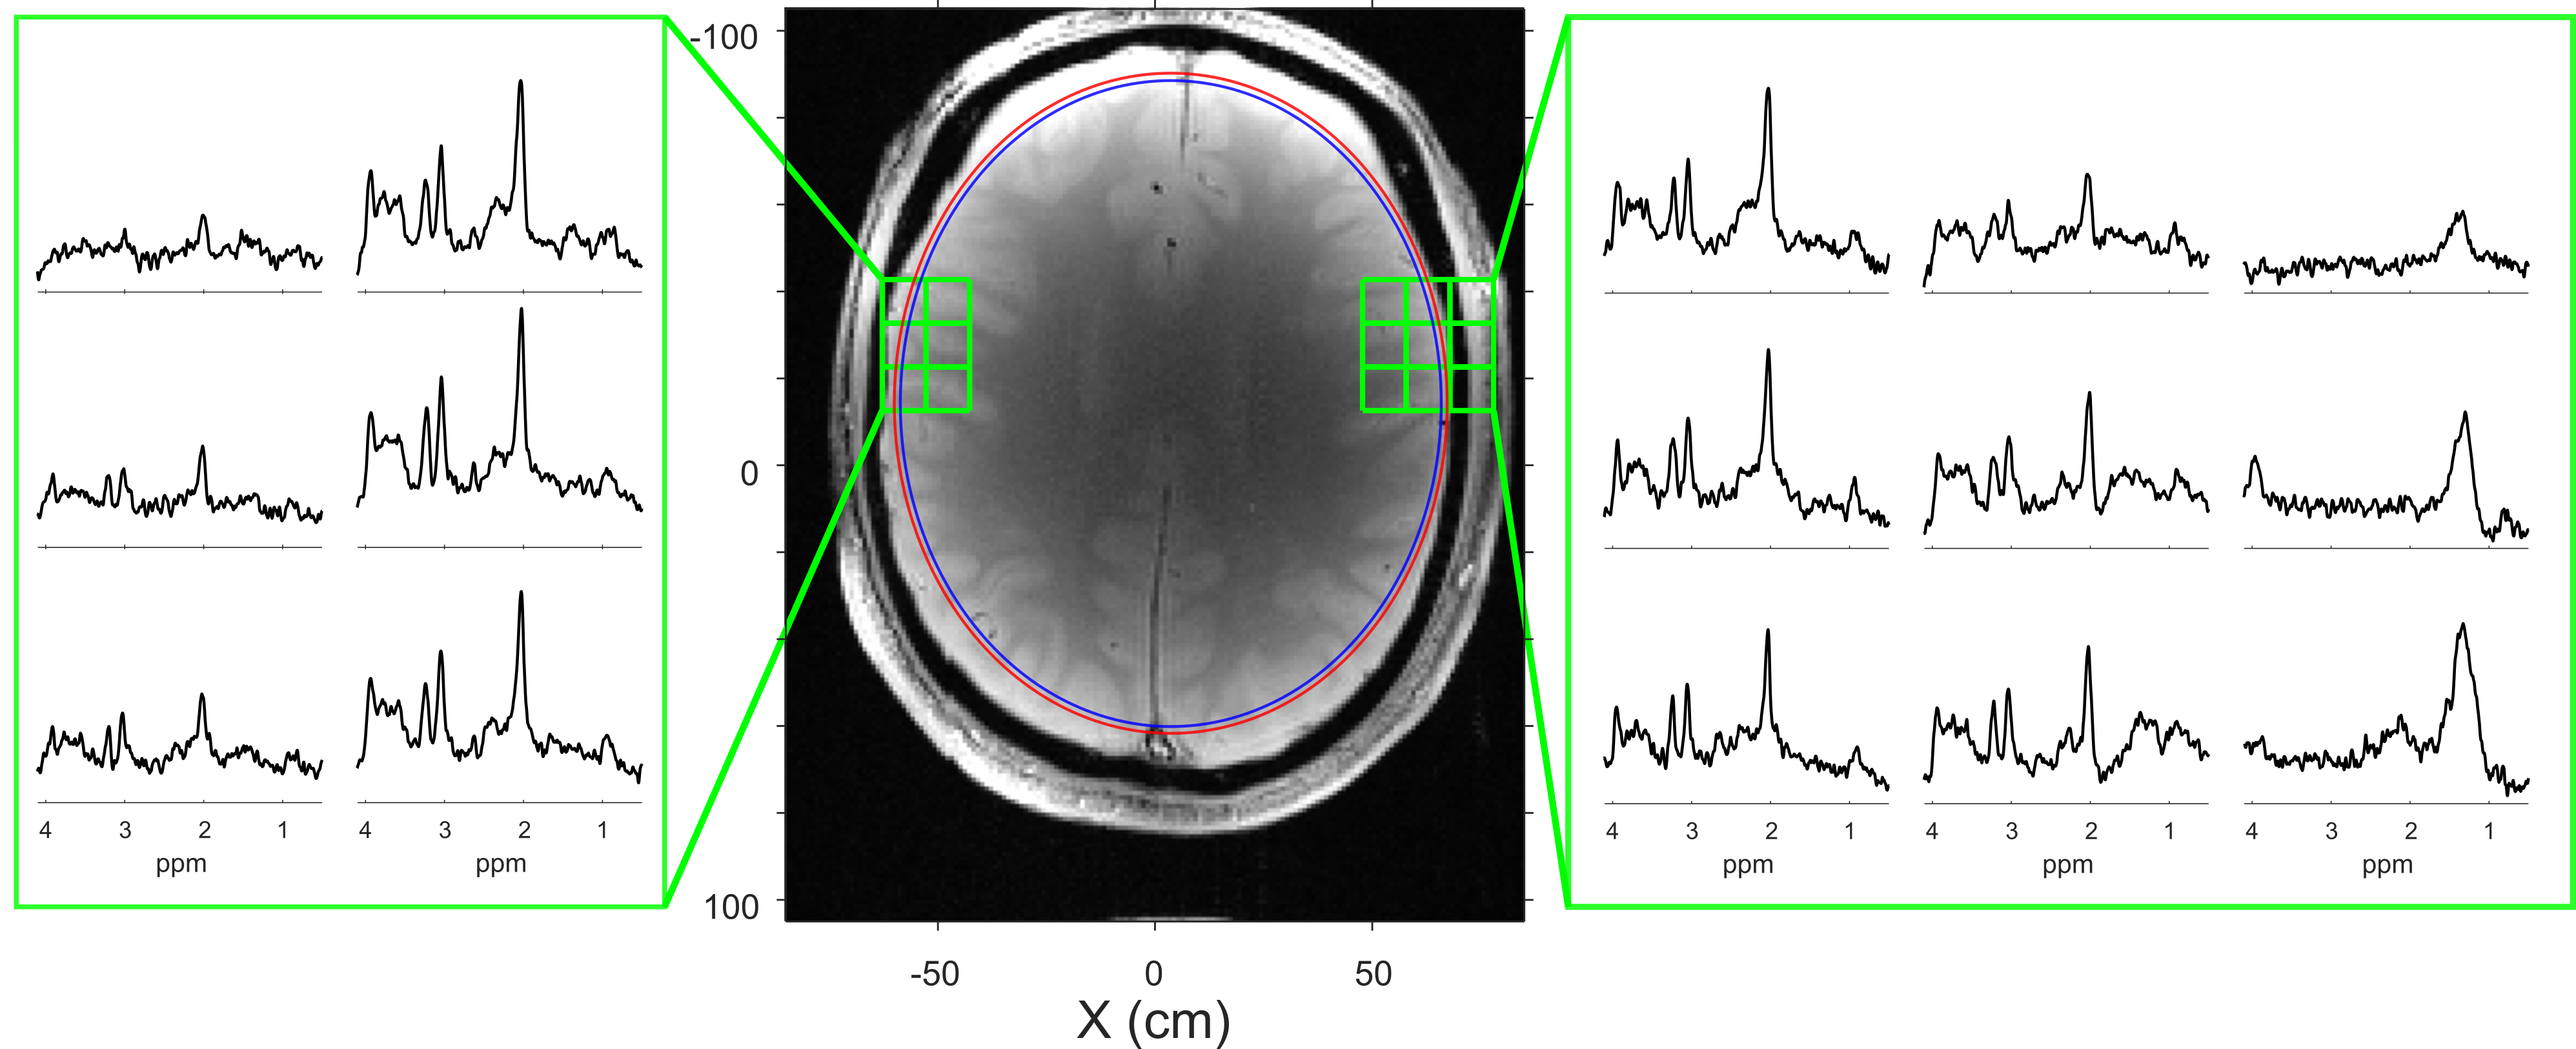
Figure 5 illustrates an in vivo MRSI acquisition with ECLIPSE localization. The ROI was set aggressively on the right side, with a ~1 mm separation between the ROI edge and edge of brain, the left side ROI edge was conservatively placed with an additional 1-2 mm of separation, similar to ROI placements in previous studies1. The three ROI edge voxels in the 3 x 3 panel demonstrate clear metabolic profiles with marginal lipid contamination overlapping with NAA, and effective lipid suppression on the three adjacent voxels outside the ROI, demonstrating high selectivity. The constant metabolite ratios indicate minimal CSD.
Discussion
In comparison to a previously developed, power efficient GOIA-HS4 ECLIPSE-OVS method (BW = 15 kHz), use of the GOIA-asymmetric pulse provides a 33% improvement in CSD and ~ 3.5 -fold reduction in TW, at the cost of a ~ 24% increase in SAR.Given that the GOIA-asymmetric pulse provides a < 2% TW, it can also find applications in large (~100 mm) OVS slab placements, where the TW is still < 2mm at the ROI edge of interest.
The slew rate of the system gradients (26 mT/m/ms) was a limiting factor in the GOIA-asymmetric pulse design. Higher R valued GOIA-asymmetric pulses with further improved TW is possible with faster gradients.
Acknowledgements
This research was supported by NIH grant R01- EB014861.References
[1] Tannus A, Garwood M. Adiabatic pulses. NMR in Biomedicine 1997;10(8):423–434.
[2] Tran TC, Vigneron DB, Sailasuta N et al. Very selective suppression pulses for clinical MRSI studies of brain and prostate cancer. Magnetic Resonance in Medicine 2000; 43: 23-33.
[3] Hwang TL, van Zijl PM, Garwood M. Asymmetric adiabatic pulses for NM selection, Journal of Magnetic Resonance 1999; 138:173-177.
[4] Ogg RJ, Kingsley PB, Taylor JS. WET, a T1- and B1-insensitive water-suppression method for in vivo localized 1H NMR spectroscopy. Journal of Magnetic Resonance B. 1994; 104:1-10.
[5] Kumaragamage C, De Feyter HM, Brown P, McIntyre S, Nixon TW, de Graaf RA. ECLIPSE utilizing gradient-modulated offset-independent adiabaticity (GOIA) pulses for highly selective human brain proton MRSI. NMR in Biomedicine 2020; 34:e4415.
[6] de Graaf RA, Brown PB, De Feyter HM, McIntyre S, Nixon TW. Elliptical localization with pulsed second-order fields (ECLIPSE) for robust lipid suppression in proton MRSI. NMR in biomedicine 2018;31(9):e3949.
[7] Nixon TW, McIntyre S, de Graaf RA. The design and implementation of a 64 channel arbitrary gradient waveform controller. Proc Int Soc Magn Reson Med. 2017;25:969.
Figures