0774
Leakage Correction of Dynamic Susceptibility Contrast (DSC-) MRI for vessel size measurements in human glioma1Department of Radiology & Nuclear Medicine, ErasmusMC, Rotterdam, Netherlands, 2Radiological Sciences, Division of Clinical Neurosciences, University of Nottingham, Nottingham, United Kingdom
Synopsis
Reliable insight about tumor microvasculature is important for monitoring of disease progression and treatment response. Derived from Dynamic Susceptibility Contrast MRI, transverse relaxation rates are used for vessel size estimation. In high grade glioma, these signals can artificially change by contrast agent extravasation through a disrupted Blood-Brain-Barrier. In this study the effect of applying Boxerman-Schmainda-Weisskoff leakage correction on vessel size estimation has been investigated on a group of 12 glioma patients. The result shows that in Contrast-Enhanced Tumor area applying leakage correction significantly and noticeably changes the vessel size measurements.
Purpose
The creation of new blood vessels (angiogenesis) is critical for brain tumor development and malignant transformation, influencing both prognosis and response to therapy. The assessment of angiogenesis in gliomas has been previously addressed in various publications concerning tumor grade and prognosis [1]. Of particular interest is the agreement observed between vessel size derived from MRI and from histopathology in human glioma [2]. Vessel size imaging (VSI) is an MRI technique that utilizes ∆R2 and ∆R2*, preferably simultaneously, to generate a quantitative parameter of vessel size reflecting the mean diameter of the distribution of vessels within an image voxel [3]. However, vessel size estimations for high-grade gliomas can artificially change due to change in ∆R2* and ∆R2 measurements by contrast agent extravasation through a disrupted Blood-Brain-Barrier (BBB). Moreover, with an intact BBB in nonenhancing tumor, the dynamic susceptibility contrast (DSC) signal intensity would not recover to its baseline level due to steady-state agent distribution. Application of a preload bolus injection in combination with using post-processing method have been proposed to correct leakage effects for DSC derived biomarkers [4]. In this study an investigation of the well-known leakage correction algorithm [5] on vessel size estimation was conducted for patients with enhancing and nonenhancing glioma, aiming to potentially find a more reliable vessel size measurements.methods
A local retrospective dataset consisting of 12 patients with known brain tumor (6 enhancing and 6 nonenhancing glioma patients) was used in this study [6]. All patients underwent 3T MRI scanning (GE, Milwaukee, WI, USA) including 2D imaging of both GRE- and SE-EPI DSC perfusion MRI simultaneously with hybrid EPI (HEPI) [7]. Image acquisition parameters were: 122TRs, TR: 1500ms, 15 slices, voxel size: 1.88x1.88x4.00 mm3, TE GE: 18.6 ms and TE SE: 69 ms. DSC perfusion MRI was performed with administration of 7.5ml of gadolinium-based contrast agent (Gadovist, Bayer, Leverkussen, GE) as well as injection of a pre-load bolus of equal size 5 minutes prior to DSC imaging. Diffusion-weighted images, used for estimation of Apparent Diffusion Coefficient (ADC) parameter were acquired with a voxel size of 1x1x3 mm3, and TE/TR of 63/5000 ms and with 3 b-values of 0,10,1000 s/mm2. High resolution structural images including T1-weighed pre- and post-contrast (voxel size: 1x1x0.5 mm3; TE/TR: 2.1/6.1 ms), T2 (voxel size: 0.5x0.5x3.2 mm3; TE/TR: 107/10000 ms), and FLAIR (voxel size: 0.6x0.5x0.5 mm3; TE/TR: 106/6000 ms) were acquired and used for ROI delineation. Four different ROIs were generated: Normal Appearing White Matter (NAWM), Normal Appearing Gray Matter (NAGM), nonenhancing part of the tumor (Tumor), and the contrast enhanced tumor (CE-Tumor). The last ROI is delineated only for enhancing glioma patients. In-house code developed in Python was used for image analysis. Relative cerebral blood volume (rCBV) maps were calculated using dynamic DSC data from the gradient-echo. Estimates of mean vessel diameter for each voxel were obtained by equation: $$Vessel Size=1.73×(rCBV×ADC)^{1/2} ×(∆R_2⁄(∆R_2^*)^{3⁄2})$$where ADC is the water diffusion coefficient (mm2/s), rCBV is the relative cerebral blood volume scaled to the same median value in normal appearing matter of 3.2%, ∆R2* and ∆R2 are transverse relaxation rates, acquired from GRE-DSC and SE-DSC respectively [2].HD-GLIO was used to generate Tumor masks for nonenhancing and enhancing glioma patients, as well as CE-Tumor mask for enhancing glioma patient [8]. FAST (FMRIB's Automated Segmentation Tool) was used to generate probability maps of NAWM and NAGM with probability>0.90 on the partial volume estimates, at the contralateral part of the brain [9]. The average of vessel size measurements within different ROIs were calculated with and without application of Boxerman-Schmainda-Weisskoff (BSW) leakage correction algorithm for each patient [5].
Results
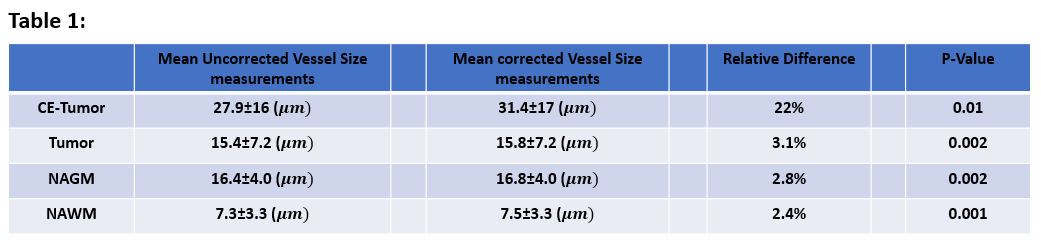
Applying BSW leakage correction in enhancing glioma significantly increased average vessel size (22%, P=0.02) in contrast enhanced tumor area (Fig. 1, for visual inspection in example data sets see Fig. 2). Moreover, there was a significant relative change after application of leakage correction even in the ROI with an intact BBB, although this effect was small (Table 1) and therefore unlikely to be clinically relevant.Please note consistent vessel size changes for each individual after application of leakage correction in all ROIs (Fig. 1b). The same figure also shows the difference in vessel size measurements between patients for the four ROIs. As expected, the NAWM shows the most consistent results while the most variability can be seen in CE-Tumor area.
In this study model-based leakage correction was applied on both ∆R2* and ∆R2 signal. Figure 3 shows that applying model-based leakage correction on ∆R2* had a much higher impact compare to ∆R2, suggesting that it might not be necessary to apply this correction on ∆R2.
Conclusion
The result suggests that applying leakage correction within the healthy tissue of the brain as well as nonenhancing tumor area has a small effect on vessel size estimation. However, within contrast enhanced tumor area this correction algorithm is strongly effective in alleviating the problem of underestimated vessel size measurements. In summary, this work recommends application of a pre-bolus combined with BSW leakage correction in enhancing glioma for vessel size estimation, while eliminating the need for leakage correction for nonenhancing glioma.Acknowledgements
No acknowledgement found.References
[1] P. Wesseling, D. J. Ruiter, and P. C. Burger, “Angiogenesis in brain tumors; pathobiological and clinical aspects,” Journal of Neuro-Oncology. 1997, doi: 10.1023/A:1005746320099.
[2] E. Kellner et al., “MR evaluation of vessel size imaging of human gliomas: Validation by histopathology,” J. Magn. Reson. Imaging, 2015, doi: 10.1002/jmri.24864.
[3] V. G. Kiselev, R. Strecker, S. Ziyeh, O. Speck, and J. Hennig, “Vessel size imaging in humans,” Magn. Reson. Med., 2005, doi: 10.1002/mrm.20383.
[4] J. L. Boxerman et al., “Consensus recommendations for a dynamic susceptibility contrast MRI protocol for use in high-grade gliomas,” Neuro. Oncol., 2020, doi: 10.1093/neuonc/noaa141.
[5] J. L. Boxerman, K. M. Schmainda, and R. M. Weisskoff, “Relative cerebral blood volume maps corrected for contrast agent extravasation significantly correlate with glioma tumor grade, whereas uncorrected maps do not,” Am. J. Neuroradiol., 2006.
[6] S. R. van der Voort et al., “Predicting the 1p/19q codeletion status of presumed low-grade glioma with an externally validated machine learning algorithm,” Clin. Cancer Res., 2019, doi: 10.1158/1078-0432.CCR-19-1127.
[7] P. F. Ferreira, P. D. Gatehouse, and D. N. Firmin, “Myocardial first-pass perfusion imaging with hybrid-EPI: Frequency-offsets and potential artefacts,” J. Cardiovasc. Magn. Reson., 2012, doi: 10.1186/1532-429X-14-44.
[8] F. Isensee, J. Petersen, S. A. A. Kohl, P. F. Jäger, and K. H. Maier-Hein, “nnU-Net: Breaking the Spell on Successful Medical Image Segmentation,” 2, 2019.
[9] Y. Zhang, M. Brady, and S. Smith, “Segmentation of brain MR images through a hidden Markov random field model and the expectation-maximization algorithm,” IEEE Trans. Med. Imaging, 2001, doi: 10.1109/42.906424.
Figures
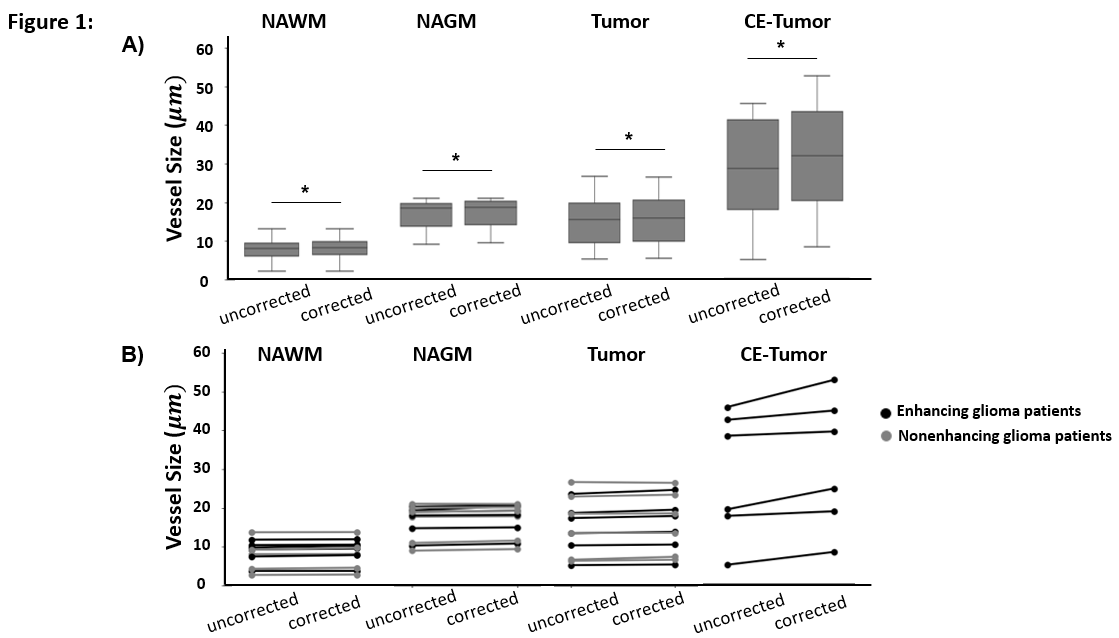
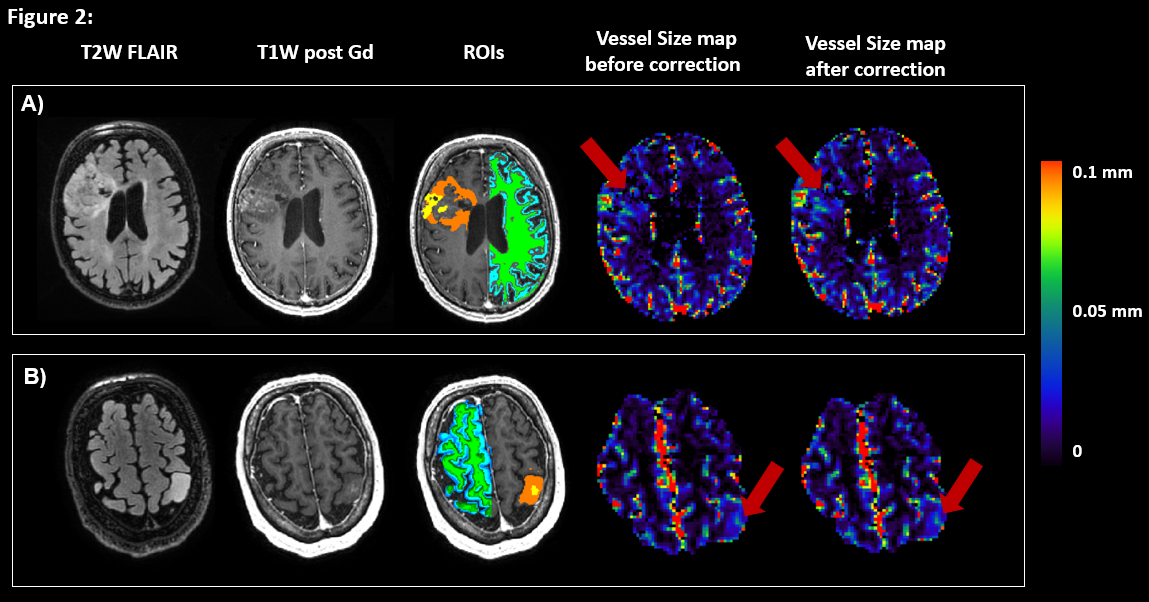
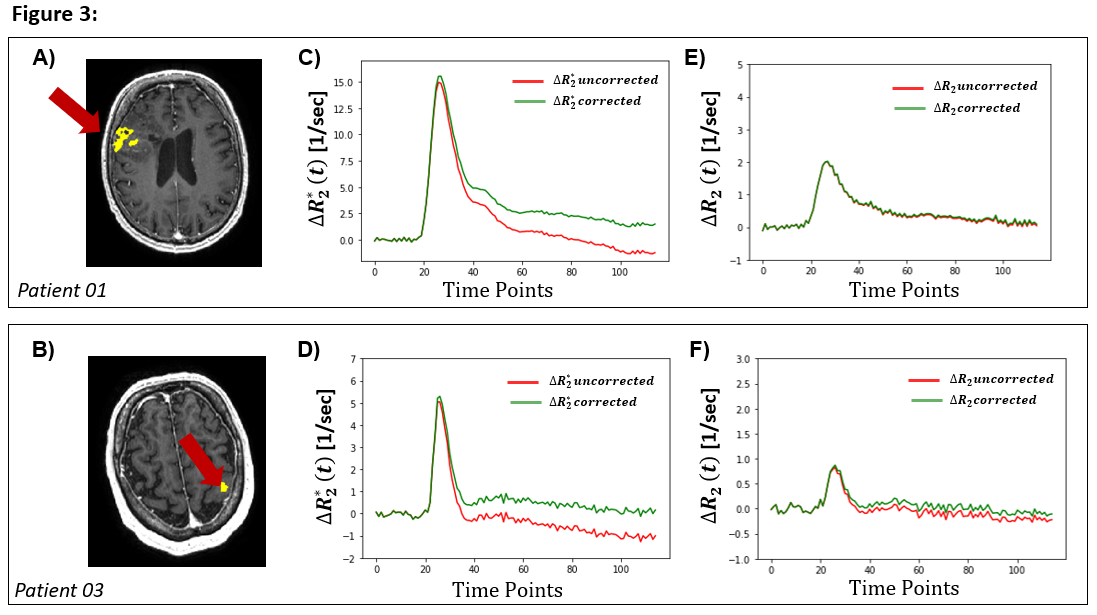
Figure 3: Leakage correction effect on transverse relaxation rates in contrast-enhanced tumor (CE-Tumor) region of interest for two representative patients. (A-B) Post contrast T1W with CE-Tumor overlaid in yellow; (C-D) Average ∆R2* (before application of leakage correction) in CE-Tumor area shown in red, and average ∆R2* (after application of leakage correction) in CE-Tumor shown in green, (E-F) Average ∆R2 (before application of leakage correction) in CE-Tumor area shown in ref, and average ∆R2 (after application of leakage correction) shown in green.