0772
Pathological validation of MP-MRI intensity-based signatures in brain cancer patients using autopsy tissue samples1Biophysics, Medical College of Wisconsin, Milwaukee, WI, United States, 2Radiology, Medical College of Wisconsin, Milwaukee, WI, United States, 3Pathology, Medical College of Wisconsin, Milwaukee, WI, United States, 4Neurology, Medical College of Wisconsin, Milwaukee, WI, United States, 5Neurosurgery, Medical College of Wisconsin, Milwaukee, WI, United States, 6Biostatistics, Medical College of Wisconsin, Milwaukee, WI, United States, 7Biomedical Engineering, Medical College of Wisconsin, Milwaukee, WI, United States
Synopsis
This study investigated the relationship between MRI-intensity values and pathological features of brain cancer using autopsy tissues as ground truth. Mixed effect models were used to examine the association between T1, T1C, FLAIR, and ADC intensity and pathological features (cellularity, cytoplasm density, and extracellular fluid density), as well as to compare the strength of these associations between GBM and non-GBM patients. These analyses confirmed many of the associations seen in prior literature, but with decreased strength than expected. Additionally, this study found that radio-pathomic associations were weaker in GBM patients than non-GBM patients.
Introduction
MP-MRI is central to the diagnosis and non-invasive monitoring of progression for glioblastomas (GBM) and other brain cancers. T1-weighted images acquired pre- (T1) and post Gd contrast (T1C) are currently used to define the primary tumor area and are often used to define boundaries for surgical resection 1,2. Hyperintensities on FLAIR images are considered signatures of a combination of infiltrative glioma and vasogenic edema resulting from tumor growth3,4, and ADC maps computed from diffusion-weighted images are often used as an inverse correlate of tumor cellularity 5–7. Imaging signatures of brain cancer are often validated using autopsy tissue samples, which allow for pointwise associations between tissue and MRI signals. However, these samples are often taken prior to treatment, and are rarely taken from beyond the traditional contrast-enhancing region. Therefore, further investigation is warranted to assess imaging signatures in the presence of treatment and beyond the contrast-enhancing region, especially in the case of GBM patients, whose tumors present with much greater pathological heterogeneity.This study used autopsy tissue samples in order to examine the association of T1, T1C, FLAIR, and ADC images with histopathological signatures of brain cancer in both GBM and non-GBM patients. Specifically, we tested the hypothesis that traditional imaging signatures are reflective of cellularity, cytoplasm density (CYT), and extracellular fluid density (ECF), with stronger radio-pathomic relationships observed in non-GBM patients.
Methods
This study included 45 patients (13, non-GBM, 32 GBM) with a pathologically confirmed brain cancer, whose demographic and clinical characteristics are presented in Table 1. A schematic of the data collection process is presented in Figure 2. Across these patients, 93 tissue samples were taken at autopsy, processed, and stained for hematoxylin and eosin (HE). Following staining, tissue samples were digitized using a sliding stage microscope. A color deconvolution-based algorithm was used to extract cellularity, CYT, and ECF across each slide. T1, T1C, FLAIR, and ADC images were collected from each patients’ most recent clinical scan session prior to death. Scans were coregistered to the FLAIR image, and qualitative images (T1, T1C, FLAIR) were intensity normalized by dividing the image by the whole-brain standard deviation. Grey and white matter probability maps were computed using SPM12 segmentations derived from the T1 image. Custom in-house software was used to align tissue samples to the FLAIR image using a non-linear warping computed from manually defined control points 7–9.Linear mixed effect models were used to assess the relationship between voxel-wise image intensity values and histopathological features. Each model included a covariate for time between clinical imaging and death and grey matter probability, as well as a random effect of subject. Analogous models including an interaction between intensity value and diagnosis were also computed in order to assess the differences in radio-pathomic relationship strength between the two diagnostic groups. Due to the inflated sample size due to voxelwise assessment (n=591,502), p-values were not considered a reliable indicator of significant effects, thus results are presented in terms of measures of effect size.
Results
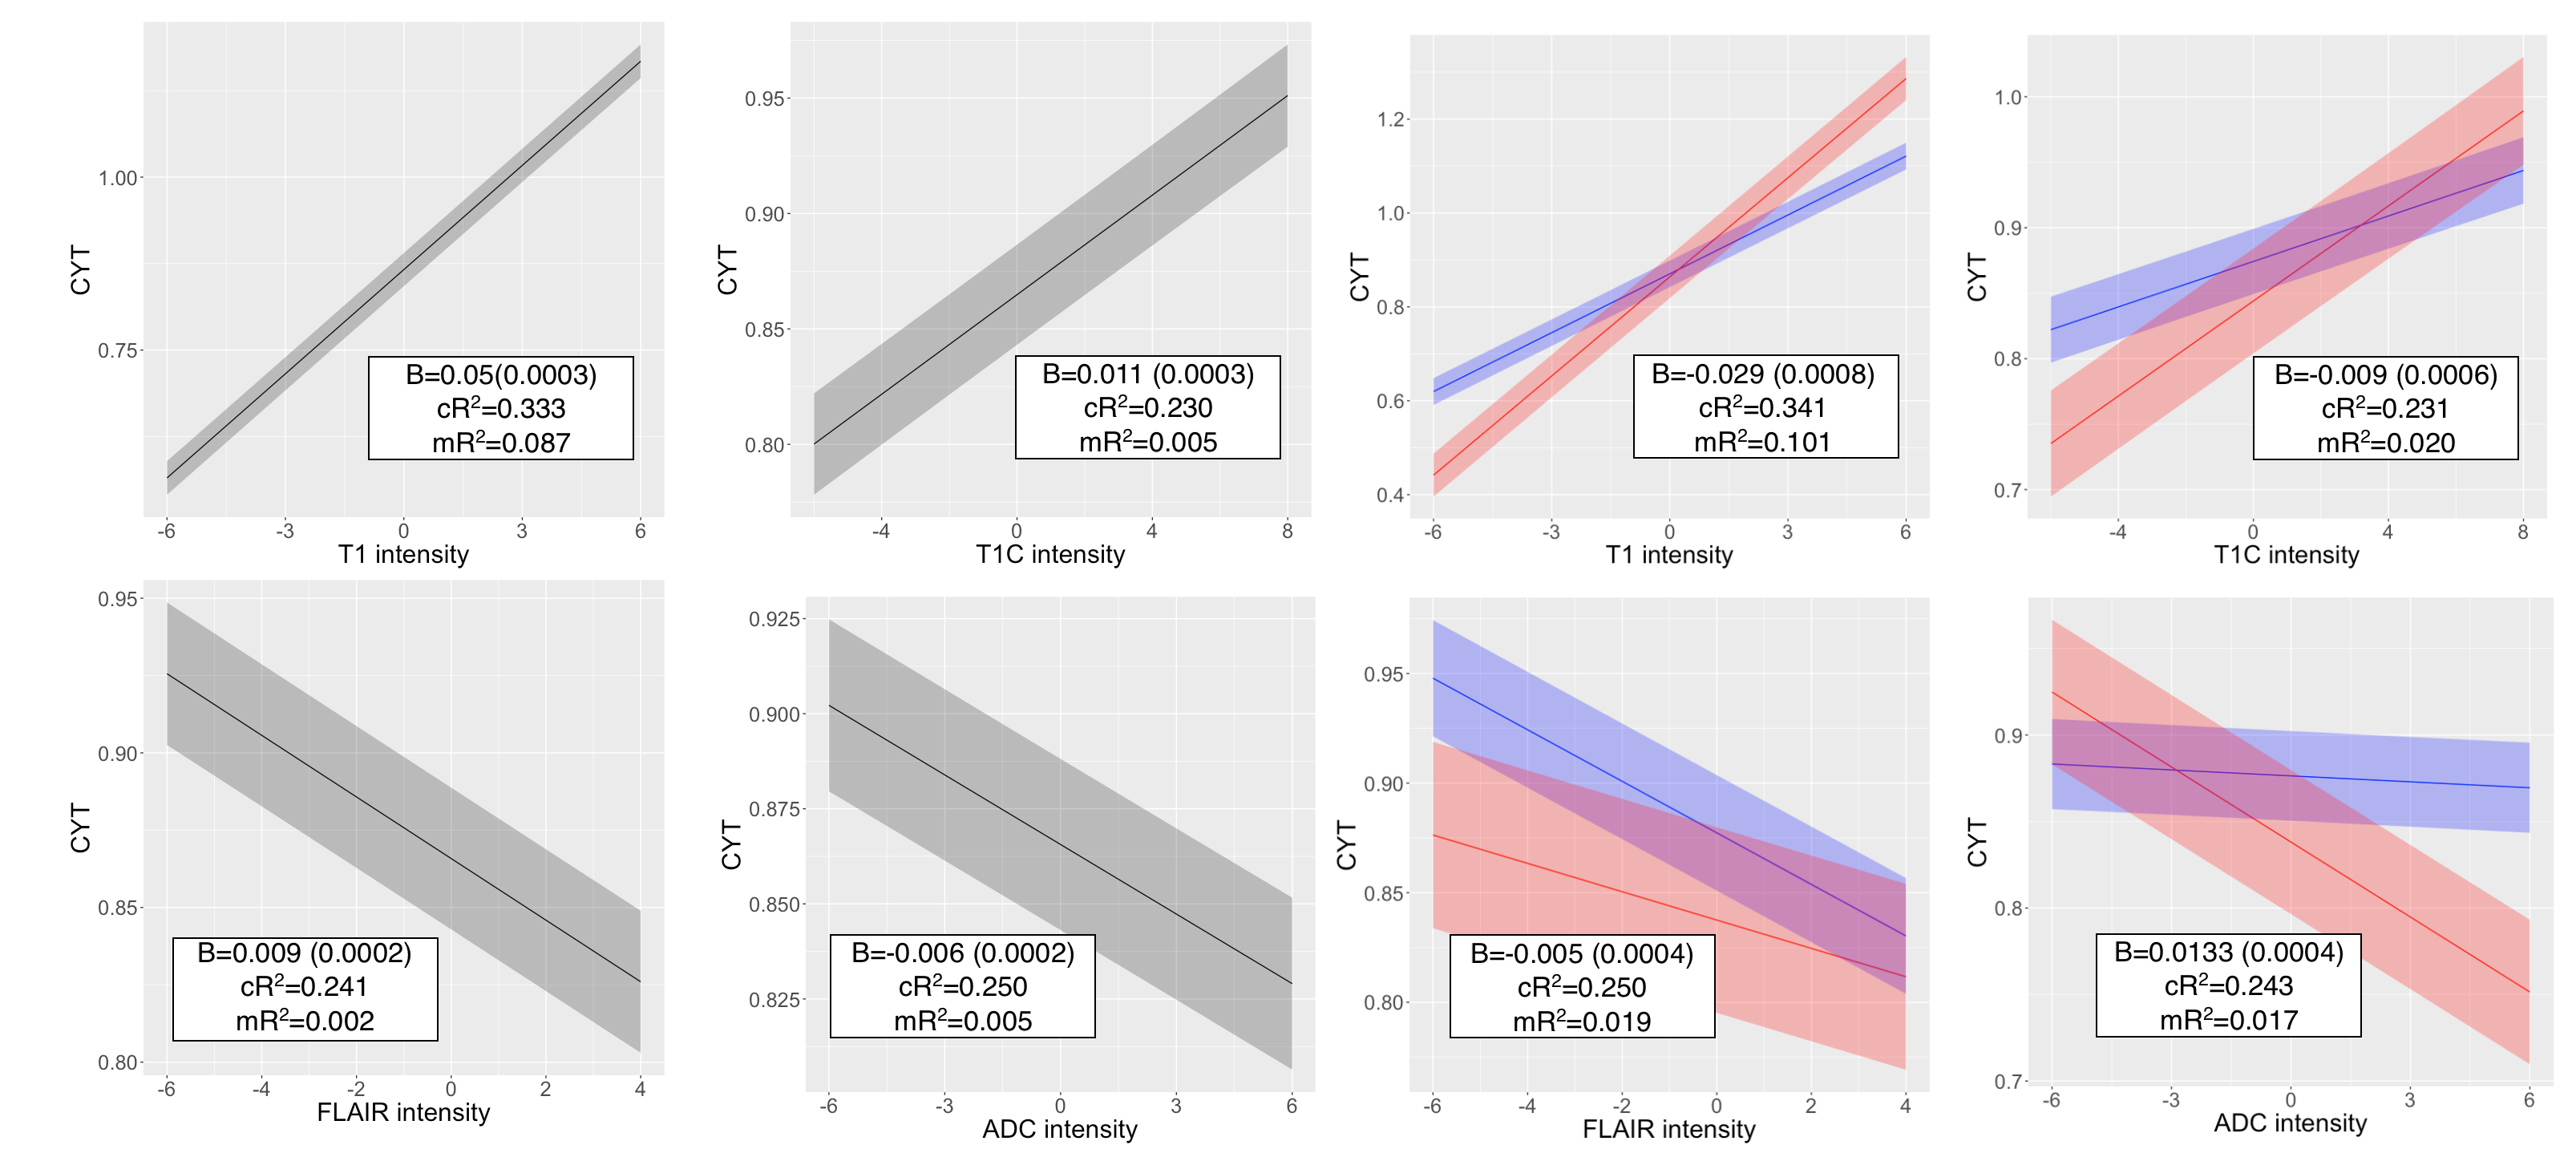
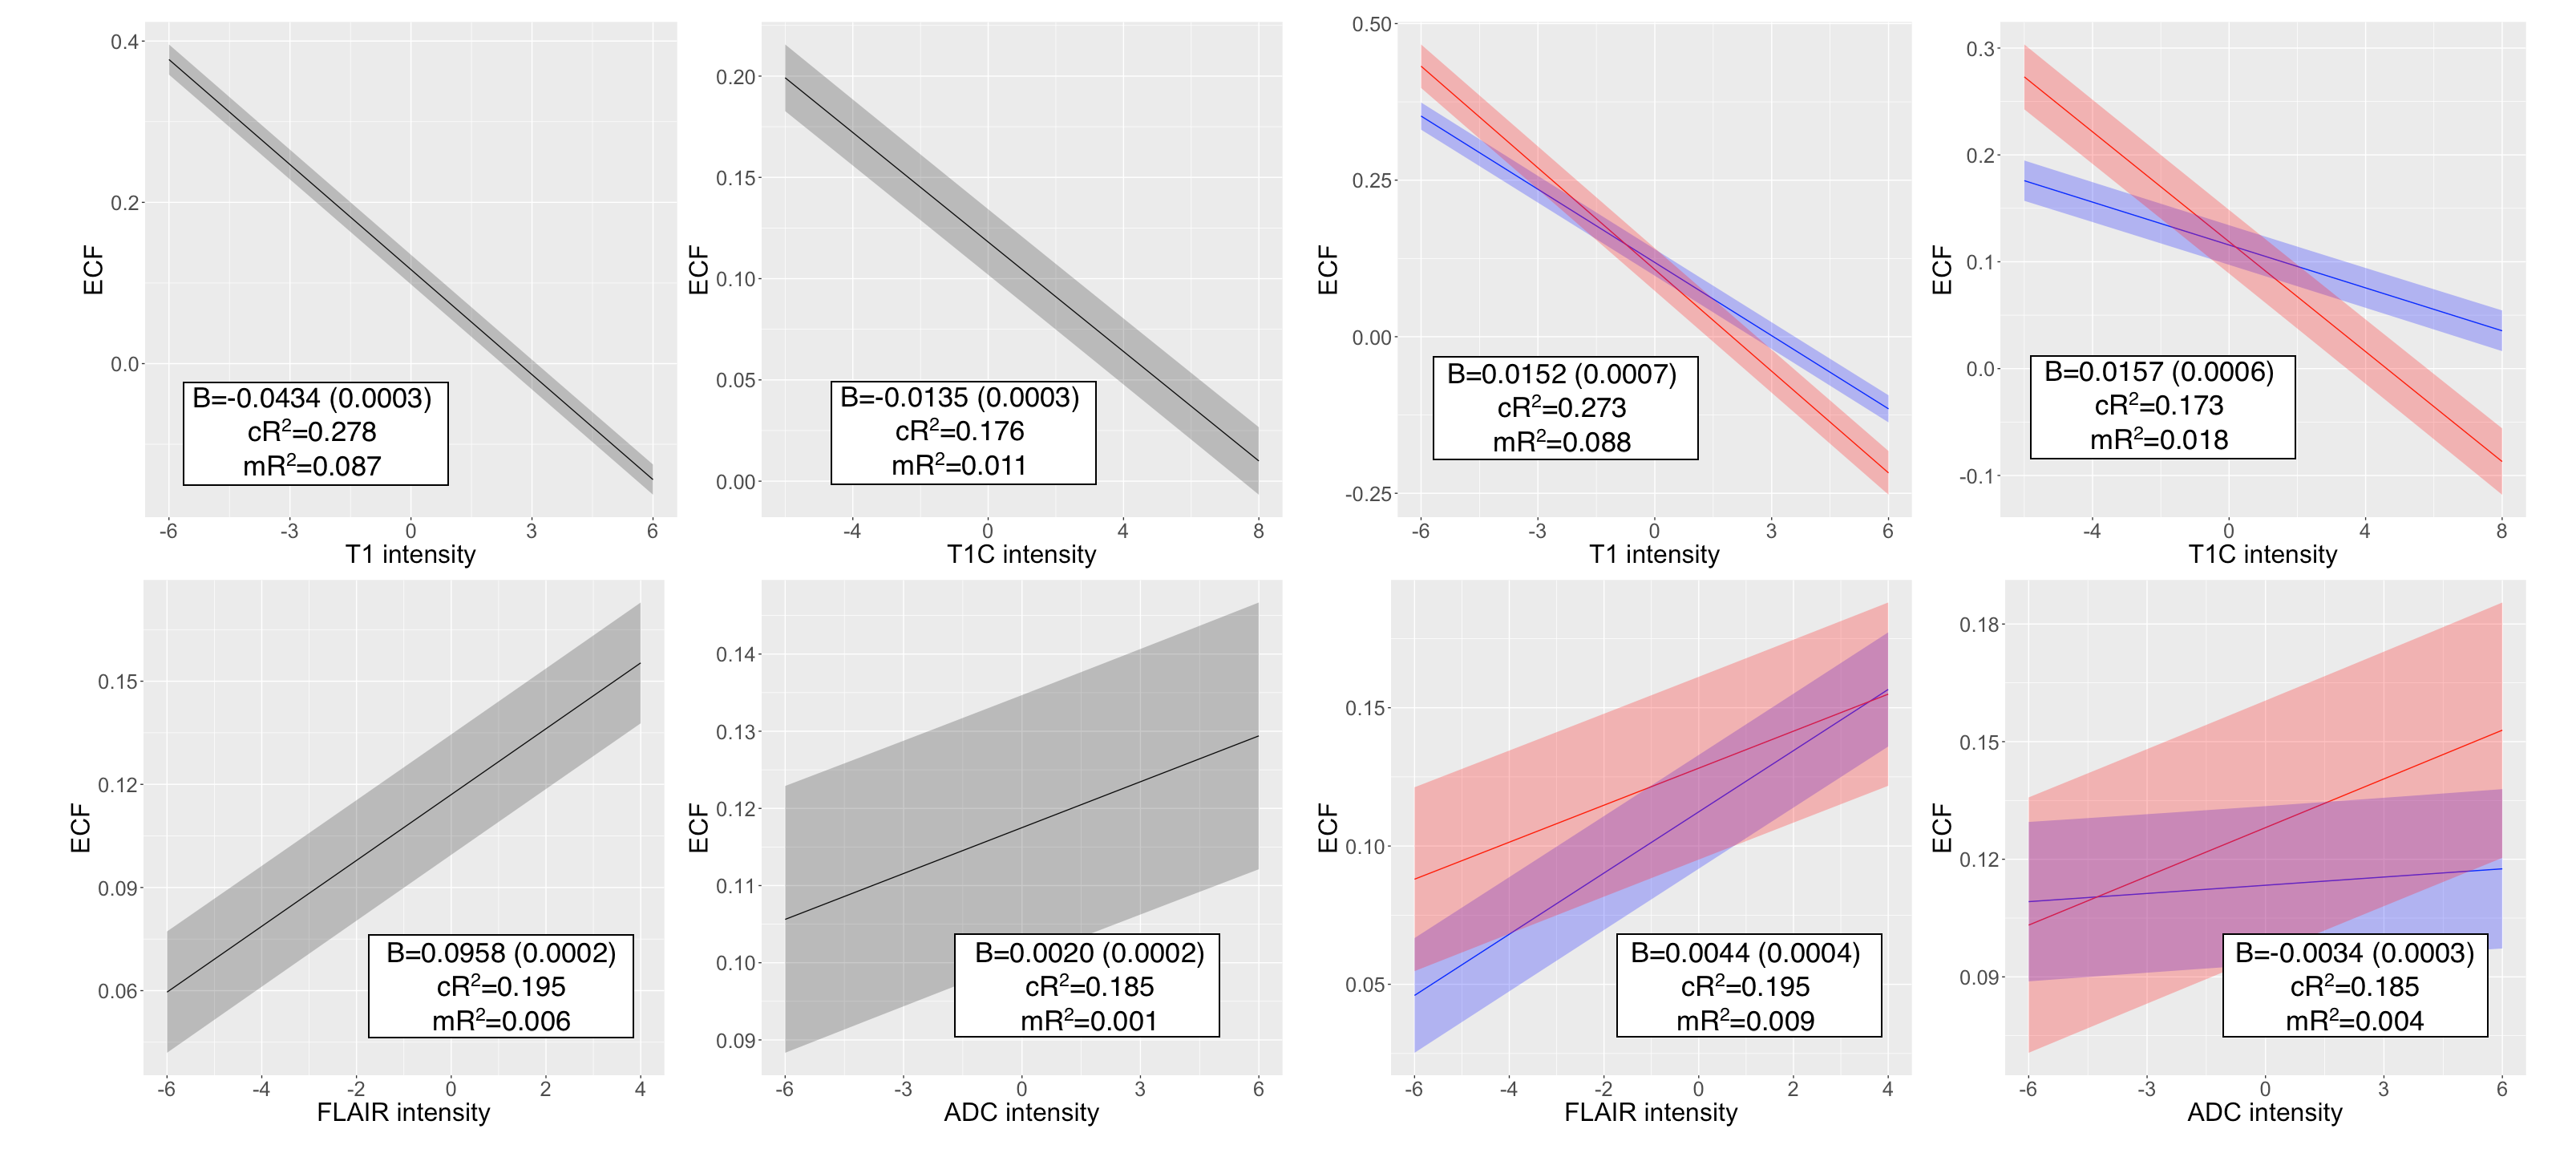
Fitted model results for cellularity are presented in Figure 3, including standardized model coefficients (i.e. Increase in cells/mm, conditional R2 (cR2, variance explained by the model including random effects), and marginal R2 (mR2, variance explained by only fixed effects). CYT fitted model results are included in Figure 4, and results for ECF are included in Figure 5. Across each plot, associations generally followed expected trends seen in prior literature (i.e. negative ADC-cellularity association, positive FLAIR-ECF association), though models at most accounted for approximately 30% of variance, with fixed effects only accounting for at most 10% of variance. Across the majority of associations, the radio-pathomic association seen within non-GBM patients was stronger than that of the GBM patients.Discussion
This study provides an autopsy-based pathological validation between image intensity values and histopathological features of brain cancer. These results generally confirmed relationships observed in prior literature, such as ADC as an inverse marker of cellularity and FLAIR as a direct marker of edema (heightened ECF). However, these relationships were much weaker than expected, with the majority of pathological variance left unexplained with regards to each pathological signature. These results generally indicate that traditional imaging signatures may be less robust beyond the non-contrast-enhancing region, and further study may be warranted in order to improve non-invasive signatures of tumor progression. These signatures also may be less strong due to the effect of radiation and other treatments, which influence the relationship between imaging values and tissue pathology 10,11. Additionally, radio-pathomic relationships within GBM patients were weaker than those within non-GBM patients. This indicates that the pathological heterogeneity associated with GBM may confound traditional imaging signatures. While this study represents the largest of its kind, a still relatively small subject-level sample size in relation to the degree of clinical heterogeneity leaves additional research questions. The time between MRI scan time and death may influence results beyond statistical control, and future studies are warranted to investigate the implications of this time period on radio-pathomic relationships.Conclusion
MP-MRI signatures of cellularity, CYT, and ECF capture a modest degree of variance using autopsy samples as ground truth, with stronger radio-pathomic relationships observed in non-GBM patients than GBM patients.Acknowledgements
No acknowledgement found.References
1. Smits M, van den Bent MJ. Imaging Correlates of Adult Glioma Genotypes. Radiology. 2017;284(2):316-331. doi:10.1148/radiol.2017151930
2. Shukla G, Alexander GS, Bakas S, et al. Advanced magnetic resonance imaging in glioblastoma: a review. Chinese Clin Oncol. 2017;6(4):40. doi:10.21037/cco.2017.06.28
3. Husstedt HW, Sickert M, Köstler H, Haubitz B, Becker H. Diagnostic value of the fast-FLAIR sequence in MR imaging of intracranial tumors. Eur Radiol. 2000;10(5):745-752. doi:10.1007/s003300050997
4. Hudak AM, Peng L, Marquez de la Plata C, et al. Cytotoxic and vasogenic cerebral oedema in traumatic brain injury: assessment with FLAIR and DWI imaging. Brain Inj. 2014;28(12):1602-1609. doi:10.3109/02699052.2014.936039
5. Surov A, Meyer HJ, Wienke A. Correlation between apparent diffusion coefficient (ADC) and cellularity is different in several tumors: a meta-analysis. Oncotarget. 2017;8(35):59492-59499. doi:10.18632/oncotarget.17752
6. Chen L, Liu M, Bao J, et al. The correlation between apparent diffusion coefficient and tumor cellularity in patients: a meta-analysis. PLoS One. 2013;8(11):e79008. doi:10.1371/journal.pone.0079008
7. Ellingson BM, Malkin MG, Rand SD, et al. Validation of functional diffusion maps (fDMs) as a biomarker for human glioma cellularity. J Magn Reson Imaging. 2010;31(3):538-548. doi:10.1002/jmri.22068 8. Bobholz SA, Lowman AK, Barrington A, et al. Radiomic Features of Multiparametric MRI Present Stable Associations With Analogous Histological Features in Patients With Brain Cancer. Tomogr (Ann Arbor, Mich). 2020;6(2):160-169. doi:10.18383/j.tom.2019.00029
9. LaViolette PS, Mickevicius NJ, Cochran EJ, et al. Precise ex vivo histological validation of heightened cellularity and diffusion-restricted necrosis in regions of dark apparent diffusion coefficient in 7 cases of high-grade glioma. Neuro Oncol. 2014;16(12):1599-1606. doi:10.1093/neuonc/nou142
10. Hawkins-Daarud A, Rockne RC, Anderson ARA, Swanson KR. Modeling Tumor-Associated Edema in Gliomas during Anti-Angiogenic Therapy and Its Impact on Imageable Tumor. Front Oncol. 2013;3:66. doi:10.3389/fonc.2013.00066
11. Kessler AT, Bhatt AA. Brain tumour post-treatment imaging and treatment-related complications. Insights Imaging. 2018;9(6):1057-1075. doi:10.1007/s13244-018-0661-y
Figures