0769
Hypoxia alters normal fibroblast metabolism towards a cancer associated fibroblast phenotype1Division of Cancer Imaging Research, The Russell H. Morgan Department of Radiology and Radiological Science, The Johns Hopkins University School of Medicine, Baltimore, MD, United States, 2Department of Oncology, The Johns Hopkins University School of Medicine, Baltimore, MD, United States, 3Sidney Kimmel Comprehensive Cancer Center, The Johns Hopkins University School of Medicine, Baltimore, MD, United States, 4Radiation Oncology and Molecular Radiation Sciences, The Johns Hopkins University School of Medicine, Baltimore, MD, United States
Synopsis
Fibroblasts play a pivotal role in cancer progression. In prostate cancer, fibroblasts have been shown to induce growth and increase metastatic potential. To further understand how fibroblasts respond to hypoxic tumor microenvironments that are frequently observed in prostate cancer, we have characterized the effects of hypoxia on normal and cancer associated prostate fibroblast (PCAF) metabolomics and invasion using 1H MRS/I. We found that hypoxia increased matrix degradation by normal fibroblasts. Furthermore, hypoxia metabolically reprogrammed normal prostate fibroblasts to mimic the metabolic pattern of PCAFs, highlighting the potential role of hypoxia in the transition of normal fibroblasts to CAFs.
Introduction:
Fibroblasts are the predominant cells found in connective tissue. They produce several extracellular matrix (ECM) proteins such as collagen 1 and fibronectin, as well as degradative enzymes such as matrix metalloproteinases1. They are active regulators of several biological processes including wound healing. In cancer, fibroblasts play a significant role in tumor progression and dissemination2-4, immunosuppression and metabolic support of cancer cells. We previously identified increased cancer associated fibroblasts (CAFs) in more metastatic prostate cancers5. Here we investigated the influence of hypoxia in modifying fibroblast metabolism and matrix degradation. We characterized metabolic changes triggered by hypoxia in normal prostate fibroblasts and prostate CAFs using magnetic resonance spectroscopy (MRS). We assessed changes in prostate fibroblast invasion and ECM degradation with our MR-compatible cell perfusion system (MR-CPS).Materials and Methods:
Experiments were performed using human prostate fibroblasts (WPMY-1, ATCC, Manassas, VA) and human prostate cancer associated fibroblasts (PCAFs, Asterand Bioscience, Detroit, MI). WPMY-1 were derived from stromal cells from the peripheral zone of the histologically normal adult prostate6. PCAFs were obtained from an adenocarcinoma of the prostate gland. To induce hypoxia, cells were incubated for 48h under hypoxic conditions (0% O2). For MRS, cell extracts were obtained using a dual-phase extraction method, and high-resolution MRS performed and analyzed as previously described7. High-resolution 1H MR spectra were recorded on a Bruker Biospin Avance-III 750 MHz MR (Bruker Biospin) spectrometer operating at a proton frequency of 750.21 MHz, using a 5-mm broad band inverse (BBI) probe head equipped with z-gradient accessories. 1H MR spectra were manually phased and automated baseline corrected using TOPSPIN 3.2 software. Integrals of the metabolites of interest were determined and normalized to the TSP reference and the number of cells. Metabolites were estimated from at least three experimental samples. Statistical significance was evaluated using the Student t test.MR-CPS experiments were carried out with WPMY-1 cells plated an ECM chamber under well-oxygenated (70% O2) or hypoxic (1% O2) conditions as previously described by us8. MR data were acquired on a 9.4 T MR spectrometer (Bruker, Billerica, MA) every 12 h over a period of 2 days. T1-weighted 1H MR imaging was performed to evaluate the sample preparation, to visualize the geometry of the ECM gel, and to detect changes in its integrity due to invasion and degradation. One-dimensional (1D) 1H MR profiles of intracellular water were acquired along the length (z-axis) of the sample by diffusion- weighted (DW) MRI. The first contact of cancer cells with the ECM gel during the loading of the sample was defined as the zero time point. The extent of ECM degradation was estimated by drawing a region of interest (ROI) around the ECM gel region using NIH ImageJ software. The degradation index at time “t” was defined as (ROIt-ROIt1)/ROIt1, where t1 is the first image acquired after loading. All MR data were processed using XsOs MR Software. Values are presented as Mean ± SEM of at least three independent measurement.
Results and Discussion:
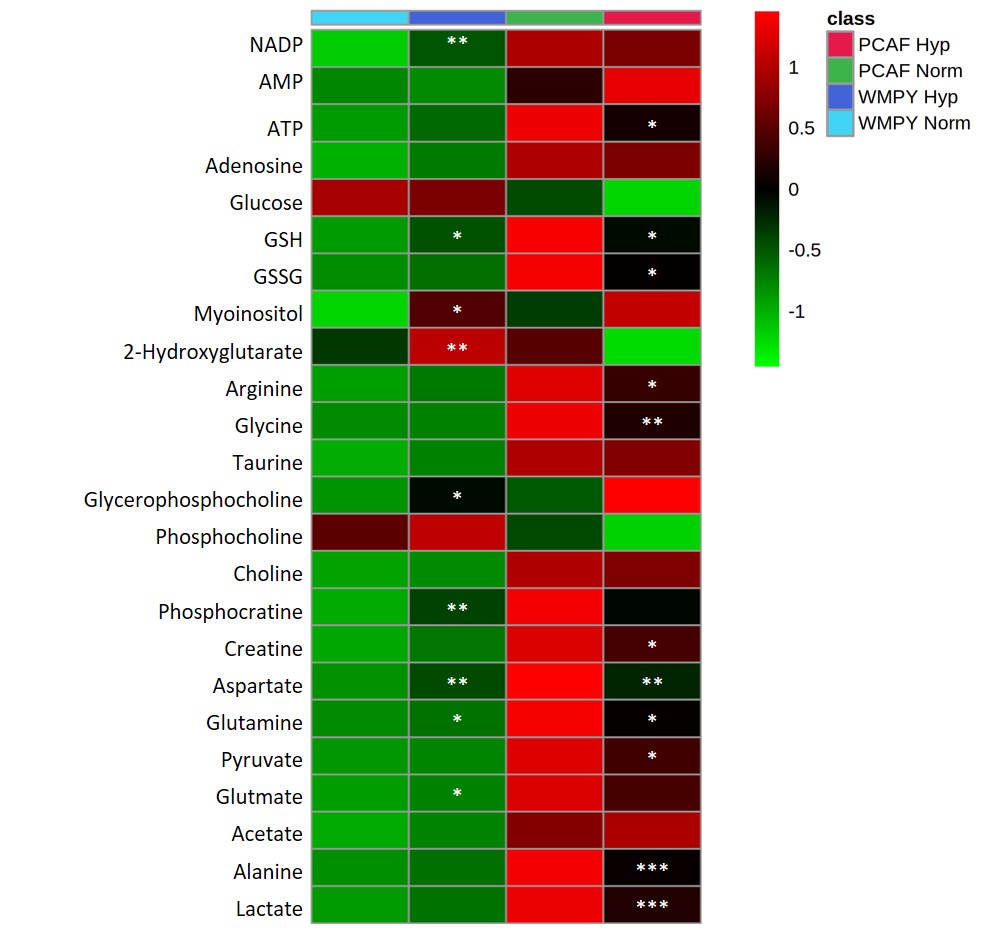
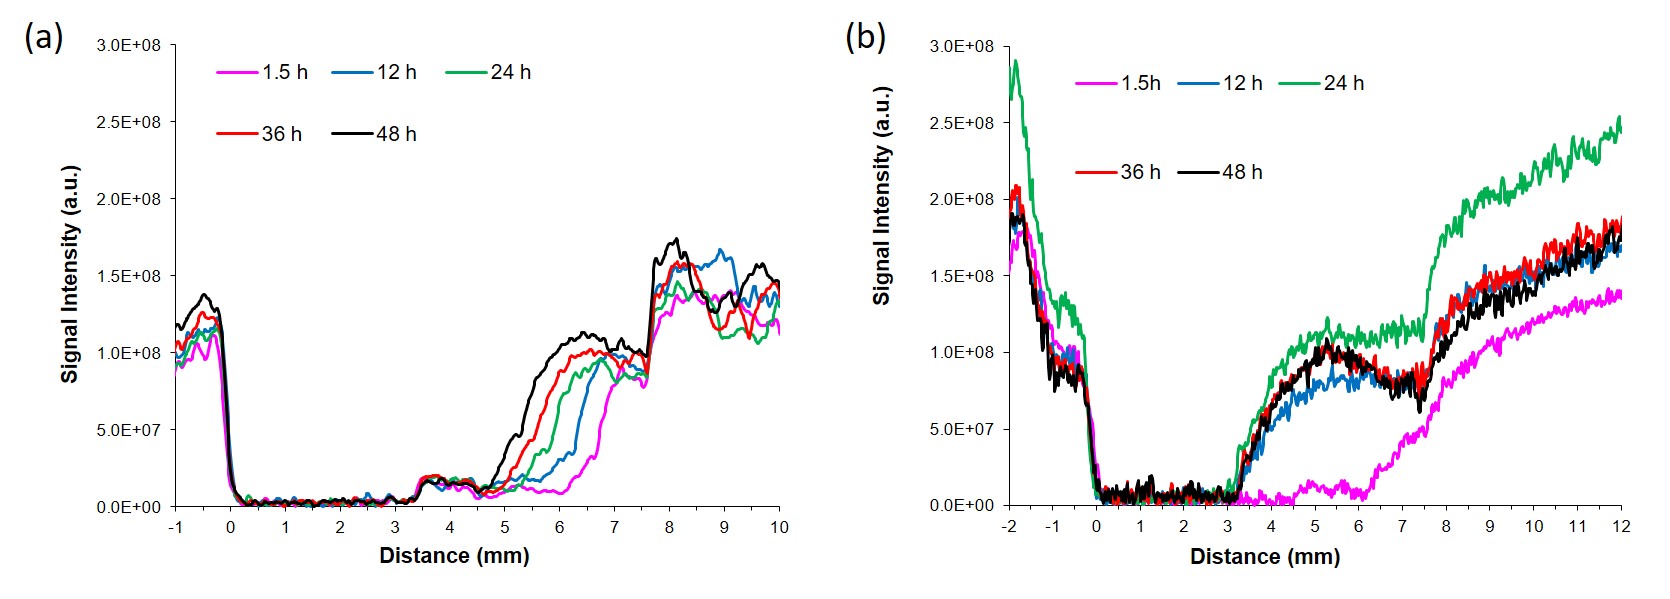
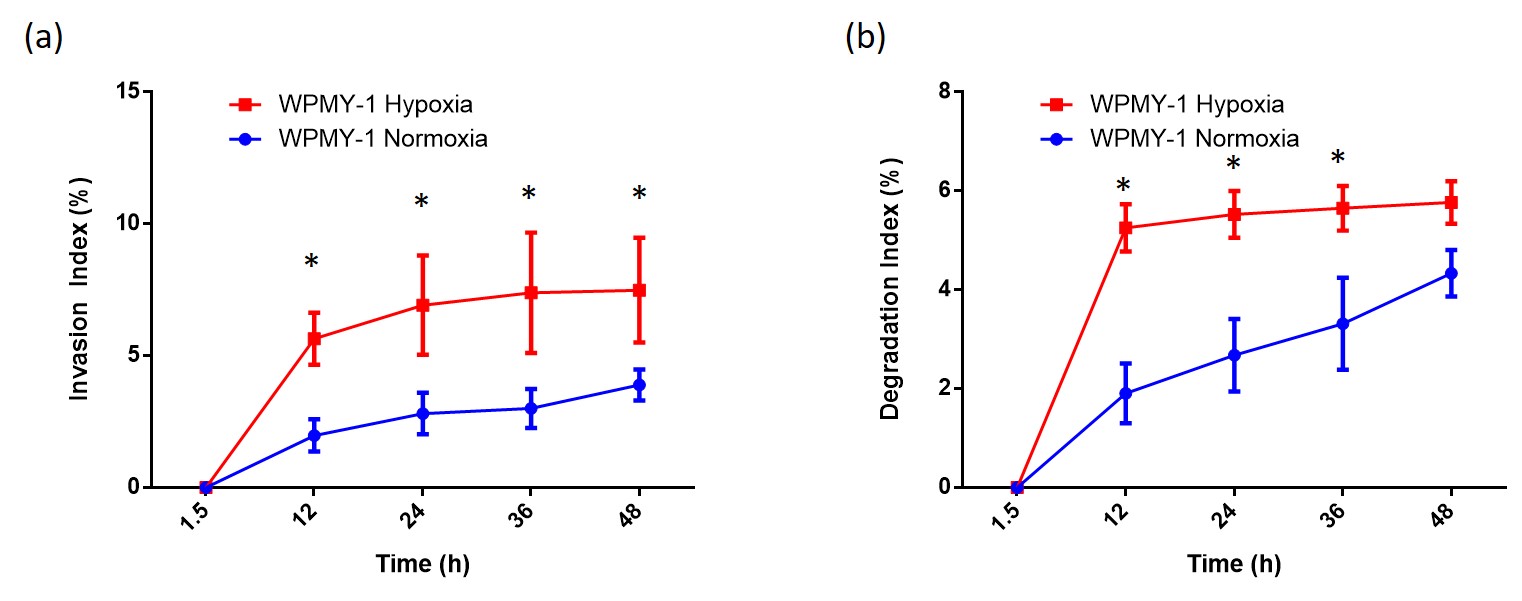
Under normoxia, compared with WPMY-1, PCAFs displayed significantly higher levels of glutamine, glutamate, arginine, lactate, myo-inositol, Cr, PCr, choline cho and lower levels of PC, as represented in the heat maps of Figure 1. The response to hypoxia was completely different between WPMY-1 and PCAFs. WPMY-1 responded to hypoxia with increased levels of glutamine, glutamate, myo-inositol, arginine, PCr and glycerophosphocholine (GPC). PCAFs, on the other hand, responded to hypoxia with decreased levels of arginine, PC, Cr, glutamine, glutamate and lactate. Representative 1H MR profiles of intracellular water of WMPY-1 under normoxia (Fig. 2a) and hypoxia (Fig. 2b) showed that hypoxia triggered a significantly faster degradation of the ECM (Fig. 3a). Similar results were found when measuring the ECM degradation index (Fig. 3b).Discussion:
We found that hypoxia significantly altered the metabolism of both normal and cancer associated fibroblasts. The metabolic profile of WPMY-1 under hypoxia became similar to PCAFs under normoxia. ECM degradation by normal fibroblasts increased under hypoxic conditions. Some of the metabolic changes can be related to supporting cancer cell metabolism and creating an immunosuppressive tumor microenvironment. These data suggest that hypoxia plays an important role in the metabolic transformation of fibroblasts to a malignant metabolic phenotype.Acknowledgements
Supported by NIH R35 CA209960. JPT was sponsored by Fundación Alonso Martín Escudero and MSCA.References
1. Zent J and Guo LW. Signaling Mechanisms of Myofibroblastic Activation: Outside-in and Inside-Out. Cell Physiol Biochem. 2018; 49(3):848-868.
2. Glentis A, Oertle P, Mariani P, et al. Cancer-associated fibroblasts induce metalloprotease-independent cancer cell invasion of the basement membrane. Nat Commun. 2017; 8(1):924.
3. Labernadie A, Kato T, Brugues A, et al. A mechanically active heterotypic E-cadherin/N-cadherin adhesion enables fibroblasts to drive cancer cell invasion. Nat Cell Biol. 2017; 19(3):224-237.
4. Valencia T, Kim JY, Abu-Baker S, et al. Metabolic reprogramming of stromal fibroblasts through p62-mTORC1 signaling promotes inflammation and tumorigenesis. Cancer Cell. 2014; 26(1):121-135.
5. Penet MF, Kakkad S, Pathak AP, et al. Structure and Function of a Prostate Cancer Dissemination-Permissive Extracellular Matrix. Clin Cancer Res. 2017; 23(9):2245-2254.
6. Webber MM, Trakul N, Thraves PS, et al. A human prostatic stromal myofibroblast cell line WPMY-1: a model for stromal-epithelial interactions in prostatic neoplasia. Carcinogenesis. 1999; 20(7):1185-92.
7. Penet MF, Shah T, Bharti S, et al. Metabolic imaging of pancreatic ductal adenocarcinoma detects altered choline metabolism. Clin Cancer Res. 2015; 21(2):386-95.
8. Ackerstaff E, Artemov D, Gillies RJ, et al. Hypoxia and the presence of human vascular endothelial cells affect prostate cancer cell invasion and metabolism. Neoplasia. 2007; 9(12):1138-51.
Figures