0768
Glucose oxidation rate as a potential marker for GBM staging: correlation with histopathology and cell proliferation in a mouse model1Champalimaud Research, Champalimaud Foundation, Lisbon, Portugal
Synopsis
The dynamic interplay between cancer cells and their microenvironment impacts progression. We used dynamic glucose-enhanced deuterium MRS (DGE 2H-MRS) to investigate the association between functional metabolic heterogeneity and cell proliferation in a syngeneic mouse model of GBM. Taking a stepwise approach, from cell culture studies to in vivo mouse MRI/MRS and post-mortem analysis, our results suggest a potential role for glucose oxidation rate as a marker of cell proliferation and vascular stability. Extending this methodology to other GBM models and/or molecular subtypes could create new opportunities for non-invasive phenotyping of the disease.
INTRODUCTION
Cancer metabolic heterogeneity and adaptability are associated with malignant phenotypes [1,2]. Specifically, Glioblastoma multiforme (GBM), the most aggressive form of primary brain tumors in adults, can use both glycolysis – Warburg effect, (hallmark of cancer) – and oxidation pathways, from preclinical models to patients [3,4]. As we unravel the differences in biology and clinical outcomes among GBM subtypes [5], exploring this heterogeneity from a metabolic standpoint could impact diagnosis and clinical decision-making. We previously showed a novel application of Marchenko–Pastur PCA denoising (MP-PCA) to dynamic glucose-enhanced deuterium MRS (DGE 2H-MRS) [6], and its ability to assess glycolytic and oxidative metabolism in mouse glioma [7]. Here, we used this methodology to investigate the association between functional metabolic heterogeneity and cell proliferation in a syngeneic mouse model of GBM, using a stepwise approach from in vitro, to in vivo, to post-mortem studies.METHODS
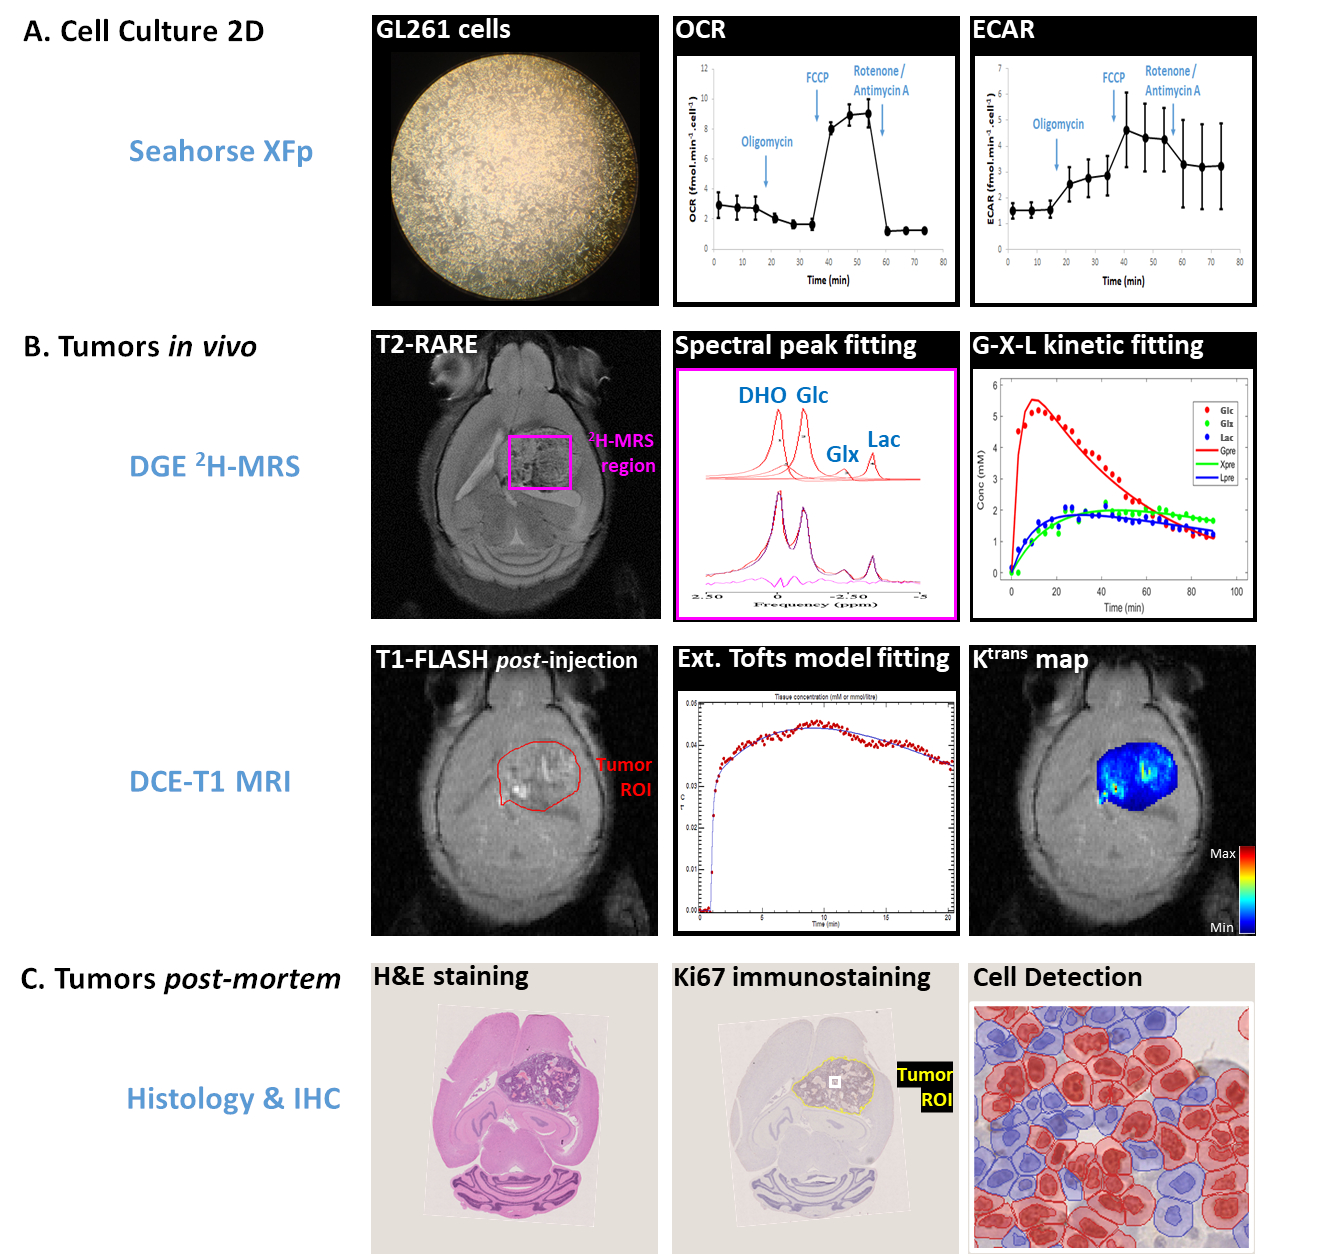
Fig 1 summarizes the experimental design.Cell Culture
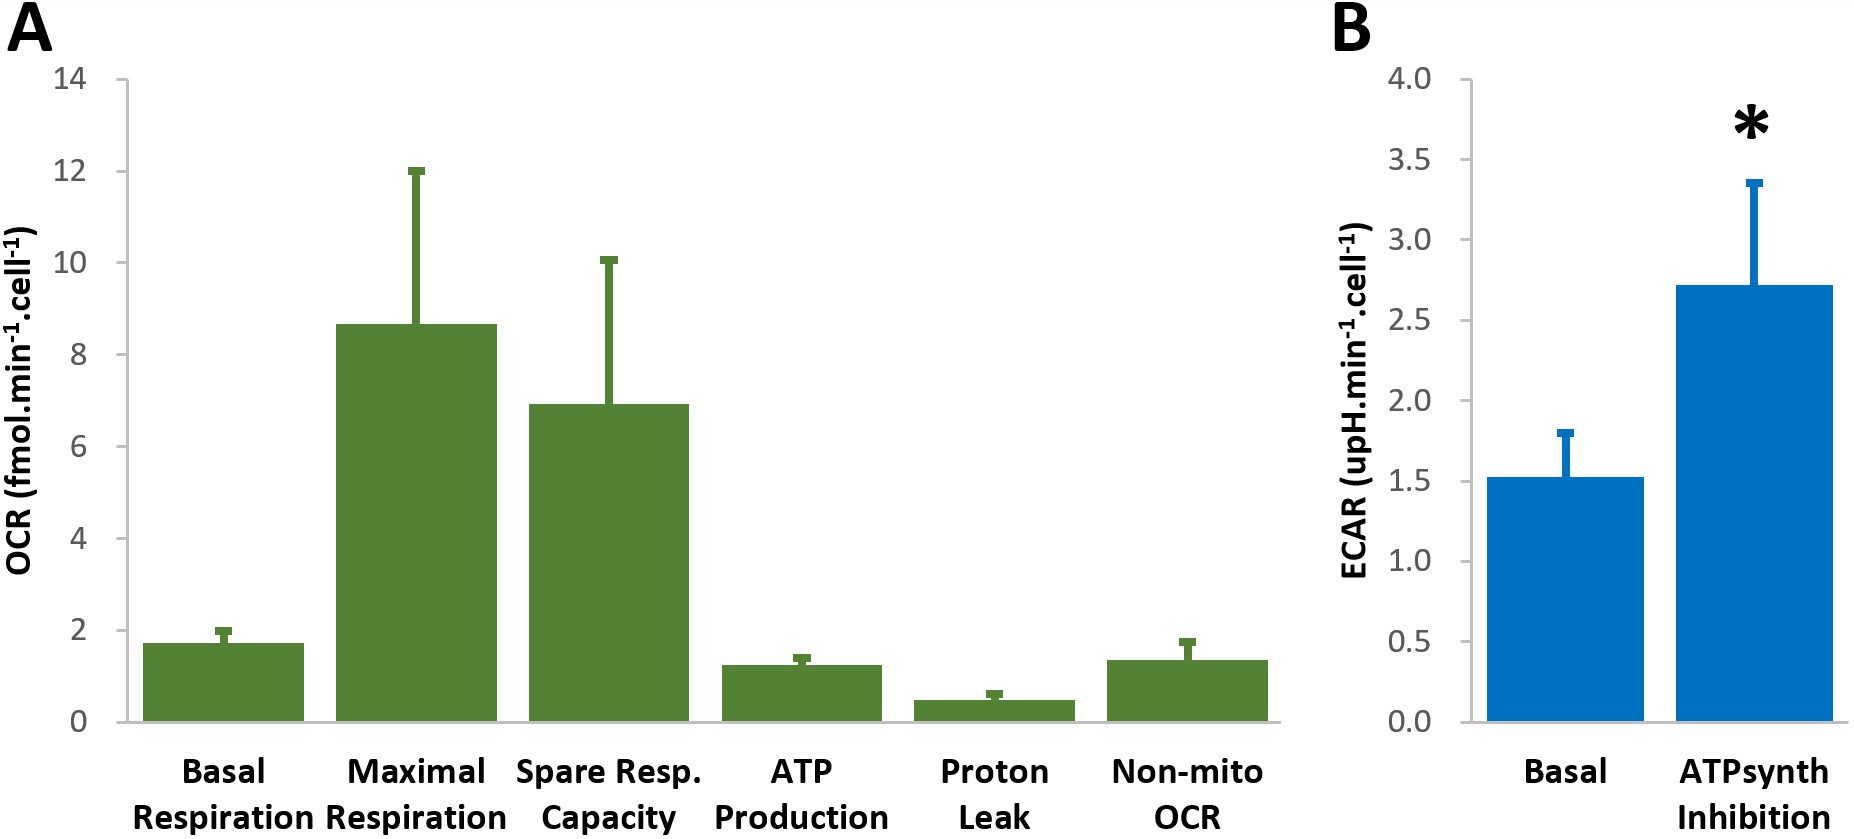
GL261 cells (2E4/well) were seeded overnight on Seahorse XFp plates. Experiments were performed using the Mito Stress Test to assess mitochondrial respiration based on oxygen consumption rate (OCR), while also measuring extracellular acidification rate (ECAR).
Animals
All animal experiments were preapproved by institutional and national authorities, and carried out according to European Directive 2010/63. High-grade gliomas were induced in n=4 mice by intracranial stereotactic injection of 1E5 GL261 cells in the caudate nucleus [8] and studied 2-3 weeks post-inoculation (18-21g). MRI/MRS experiments were performed on a 9.4 T scanner (Bruker BioSpec), using a customized 2H/1H transmit-receive surface coilset (NeosBiotec). Fasted mice (4-6h) were cannulated in the tail vein and placed in the animal holder (1-2% isoflurane in 29% O2; rectal temperature 36-37ºC; breathing 60-80BPM. After T2-RARE imaging, pulse-acquire 2H-MRS was prepared (175ms TR, 256 points, 1749 Hz, 51º flip angle) with 6 OVS pulses (10mm slab each) to select only the tumor region [7]. DGE 2H-MRS was acquired with 6,6′-2H2-glucose i.v. bolus (2 g/Kg). Finally, animals underwent DCE-T1 FLASH (8º flip-angle, 16ms TR, 4 averages, 150 repetitions, 1mm slice thickness, 140μm resolution) with Gd-DOTA i.v. bolus (0.1mmol/Kg). After MR examination, animals were sacrificed (pentobarbital 200mg/Kg i.p.), the brains removed, washed in PBS and immersed in 4% PFA until paraffin embedding, 1 week later. Samples were sectioned for H&E staining and ki67 immunostaining, and the slices digitalized (Nanozoomer, Hamamatsu).
Data analyses
Seahorse data were processed with Wave Desktop 2.6 (Agilent) and normalized according to total protein content (PierceTM BCA Protein kit, ThermoFisher Scientific). DGE 2H-MRS data were processed in MATLABR R2018b and jMRUI 6.0b as detailed by the authors [7]. This included Marchenko–Pastur PCA denoising [9], individual peak fitting using AMARES, quantification based on DHO natural abundance (13.88 mM) with T1 and labeling-loss correction [10,11], and fitting time-course changes with a modified version of a previous model [12] to estimate the maximum rate of glucose consumption for glutamate-glutamine and lactate synthesis (VmaxGlx and VmaxLac, respectively). DCE T1-MRI data were processed with DCE@urLab [13], manually delineating each tumor from 3 slices and deriving Ktrans (volume transfer constant between plasma and extracellular tumor space) with the Extended Tofts model, which were then averaged for each tumor. Histopathological analyses (H&E) were performed independently by an experimental pathologist. Ki67 images were analyzed with QuPath 0.2.3 [14], blindly from DGE 2H-MRS results. For each tumor, at least 6 slices representative of the whole lesion were used for semi-automated counting of ki67+/- cells, the labeling index (LI, +%) calculated for each slice and averaged for each tumor. This was further used to estimate the total cell number for each tumor, based on the total volume (measured by manual delineation of T2-RARE data, using ImageJ) and estimated cell radius of 10um (reported in mouse gliomas [15]), which in turn enabled Vmax normalization.
RESULTS
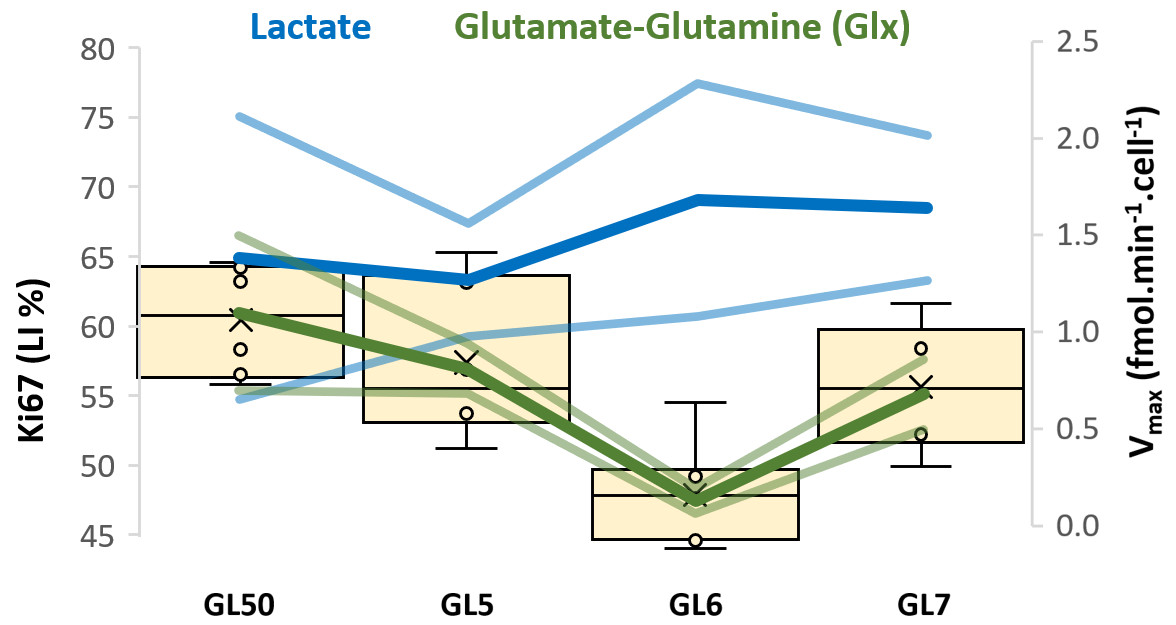
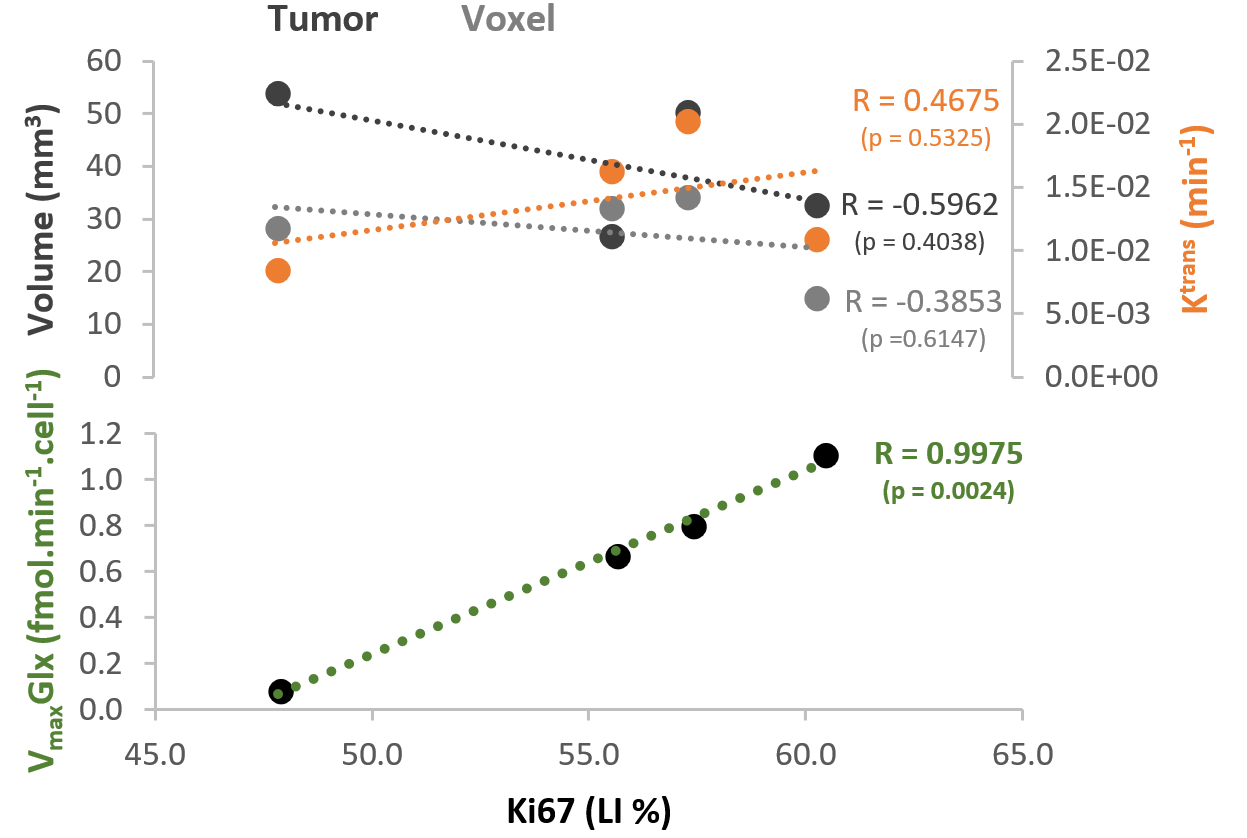
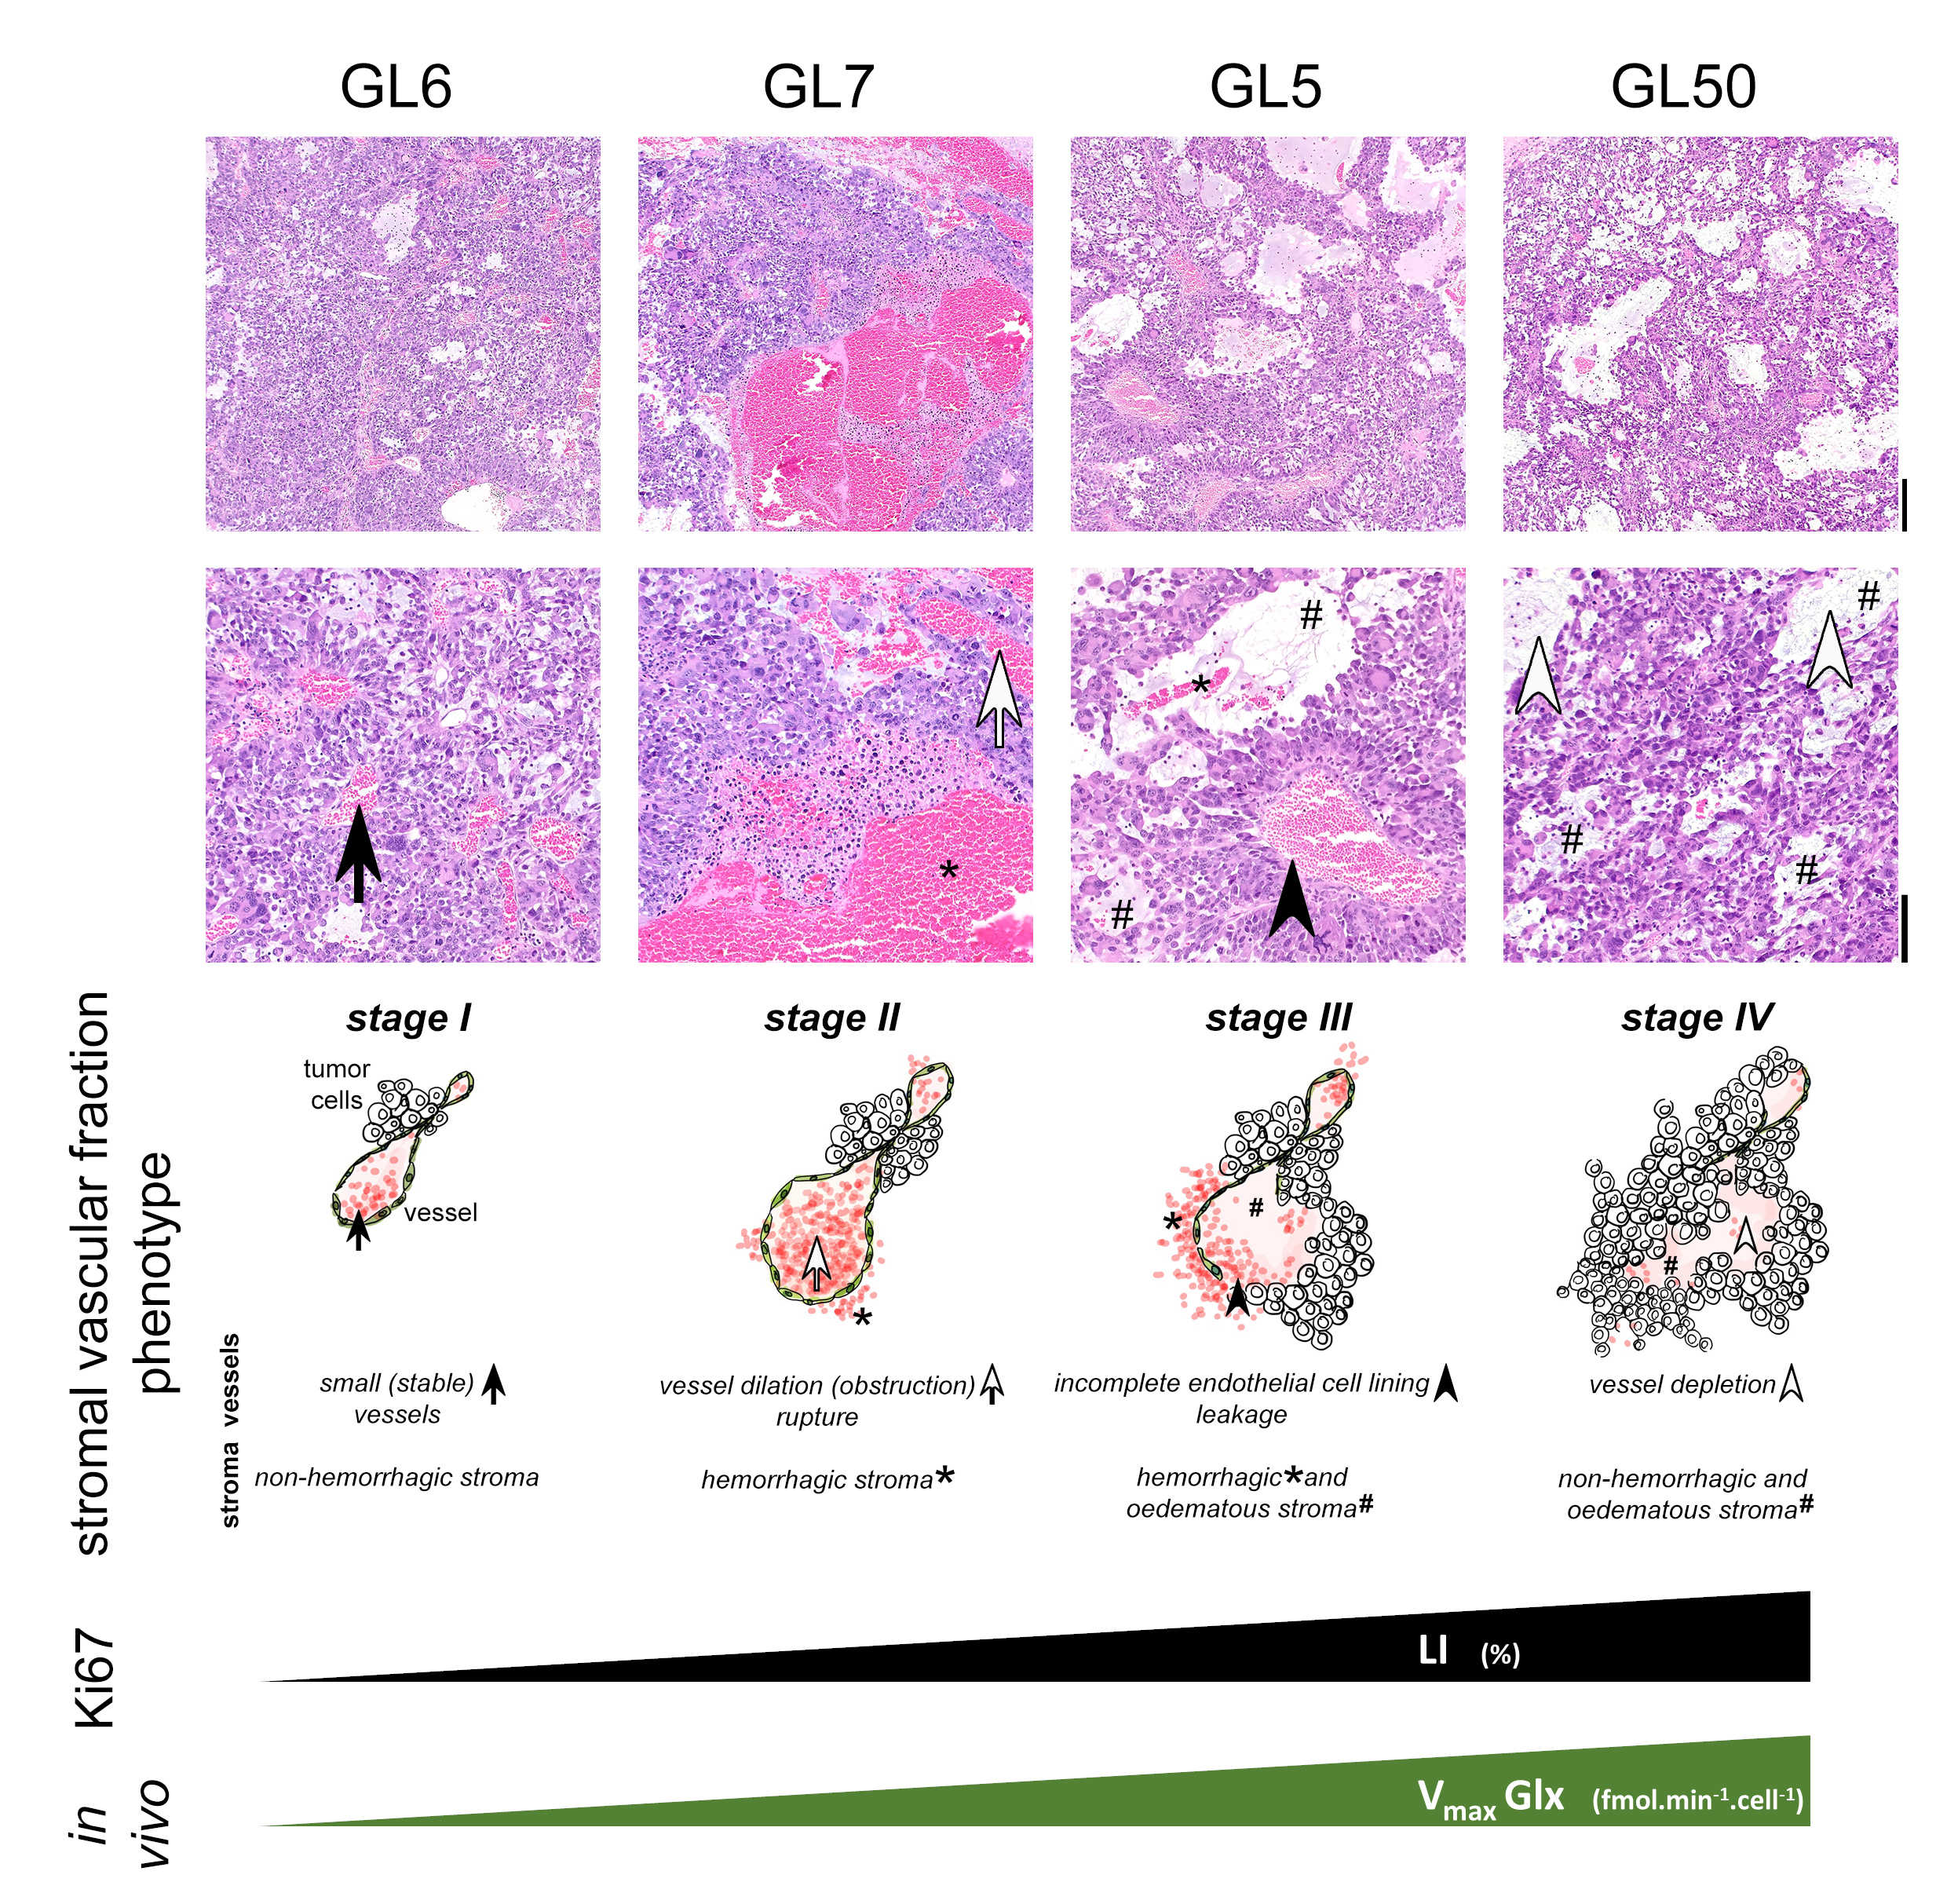
GL261 cells rely on aerobic glycolysis and mitochondrial respiration to proliferate in 2D culture (Fig 2). Accordingly, GL261 gliomas show glucose turnover to lactate (VmaxLac, glycolysis) and glutamate-glutamine (VmaxGlx, oxidation) (Fig 3), the latter in remarkable close range to the basal respiration measured in cell culture. While VmaxLac was similar across the different tumors examined, VmaxGlx demonstrates more variability and consistency with ki67 LI, revealing a strong correlation (Fig 4) not observed for other MRI metrics, such as total tumor volume or perfusion (Ktrans). Histopathological analysis classified the tumors into 4 progression stages, according to indicators of vascular stability and stroma composition, which precisely matched the proliferation index and glucose oxidation rates (Fig 5).DISCUSSION
The GL261 model relies on glycolysis and mitochondrial oxidation, both in cell culture and in vivo. Unlike glycolytic turnover (VmaxLac), tumor volume or perfusion (Ktrans), our results suggest a role for glucose oxidation rate (VmaxGlx) as a potential marker for GBM staging in this model, according to cell proliferation (Ki67) and vascular stability (H&E) measurements. We are currently validating these results on a larger animal cohort.CONCLUSION
Non-invasive assessment of glucose oxidation rate in GBM holds promise for staging these lesions according to histologic and immunohistochemical markers of progression and proliferation, respectively. Extending this methodology to other GBM models or molecular subtypes could open a new window for in vivo phenotyping of the disease.Acknowledgements
The authors thank Ms. Francisca Fernandes for periodic MRI monitoring of glioma-bearing mice, Dr. Joana Rodrigues for help with the histology, Dr. Alfredo Caro for facilitating the Seahorse XFp experiments, and Dr. Bruno Costa-Silva for access to the protein quantification protocol. This work was developed with support from the vivarium of the Champalimaud Centre for the Unknown, a research infrastructure of CONGENTO co-financed by Lisboa Regional Operational Programme (Lisboa2020), under the PORTUGAL 2020 Partnership Agreement, through the European Regional Development Fund (ERDF) and Fundação para a Ciência e Tecnologia (Portugal), under the project LISBOA-01-0145-FEDER-022170. Funding Support: Champalimaud Foundation; H2020-MSCA-IF-2018, ref. 844776.References
1. DeNicola et al. Mol Cell. 2015. 60(4): p. 514-23.
2. Lehuédé C et al. Cancer Res. 2016; 76:5201-08.
3. Mashimo et al. Cell. 2014; 159: 603-14.
4. Tardito et al. Nat Cell Biol. 2015; 17: 1556-68.
5. Wang et al. Cancer Cell. 2017; 32: 42-56.
6. Simões et al. Proc ISMRM 2020: 475.
7. Simões et al. [Proc ISMRM 2021: submitted].
8. Simões et al. NMR Biomed. 2008; 21: 251-264,
9. Veraart et al. Magn Reson Med. 2016; 76: 1582-1593.
10. de Feyter et al. Sci Adv. 2018; 4: eaat7314.
11. de Graaf et al. Proc ISMRM 2020: 1959.
12. Kreis et al. Radiology. 2019; 294: 289-96
13. Ortuño et al. BMC Bioinformatics. 2013;
14: 316. 14. Bankhead et al. Sci Rep. 2017: 7: 16878.
15. Robert set al. Sci Rep. 2020: 10: 9223
16. Simões et al. Neoplasia. 2015; 17: 671-84
Figures