0763
Hyperpolarized 13C MR imaging of prostate cancer patient derived xenograft models and their response to therapy1Department of Radiology and Biomedical Imaging, University of California, San Francisco, San Francisco, CA, United States, 22Division of Hematology/Oncology, Department of Medicine, University of California, San Francisco, San Francisco, CA, United States
Synopsis
This study demonstrates for the first time, a successful study of three small cell neuroendocrine prostate cancer patient derived xenografts (PDX) models in liver and bone in pre-clinical setting. Kidney served as an optimum site for propagation with its rich blood supply and high take rate. Hyperpolarized 13C MRI was able to identify metabolic differences between kidney, bone and liver tumors. The same PDXs had different metabolism when implanted in bone and liver. Hyperpolarized [1-13C] pyruvate conversion to lactate may be used to indicate early response to carboplatin in small cell neuroendocrine prostate cancer models in the bone.
Purpose
Potent androgen pathway inhibitors have shown to induce small cell neuroendocrine prostate cancer (SCNC), a lethal subtype of metastatic castration-resistant prostate cancer (CRPC) with poor survival and limited treatment options1,2. SCNC is found in 14% or more cases with liver or bone metastasis. Patients with PCa metastases in liver have a particularly poor prognosis3 relative to those with bone metastases alone and recent clinical data showed that patients with CRPC and liver metastases benefitted from second-generation antiandrogens and docetaxel chemotherapy but not from immunotherapy in contrast to men with bone metastasis alone4. These findings highlight the current gap in knowledge of the mechanistic underpinnings that could involve intrinsic factors to the tumor cell, tumor microenvironment, and/or systemic factors, which will be critical in diagnosis and treatment response of SCNC. Hyperpolarized 13C MRI is a valuable technique for dynamic, real-time, and non-invasive evaluation of metabolism in-vivo5. In this study, we analyzed the underlying differences in metabolism of neuroendocrine tumors grown in three different sites.Materials and Methods
SCNC tumor grafts were established in the renal capsule, bone and liver capsule using LuCaP936 and LTL352 and LTL6107 PDXs (patient derived xenografts), developed at the University of Washington and Vancouver Prostate Center by Drs. Eva Corey and Yuzhuo Wang, respectively. All procedures were approved by our Institutional Animal Care and Use Committee. Tumor sections were implanted under the renal capsule using standard procedures8. Isolated tumor cells were isolated and injected into tibiae and liver (1×10⁶ in 20μL) as previously documented9. All tumor-bearing mice underwent baseline imaging on a Bruker 3T scanner with dual tuned 1H/13C volume coil. Mice were treated once with 30mgs/kg carboplatin and imaged after one week. T2-weighted proton imaging was used for tumor localization and co-registration of carbon imaging and tumor volume estimation8. Diffusion-weighted images were acquired with b-values ranging between 12 and 658 s/mm2 and were used to generate ADC maps. 80mM [1-13C] pyruvate and 13C urea were copolarized and upon dissolution injected into the mice over 12s. Dynamic 13C spectra was acquired using a 2D CSI with spiral encoding, with a temporal resolution of 4.25s, 15 time-points and a flip-angle of 10°. Spectra were acquired with 32 x 32 mm FOV, 8 x 8 matrix, and 8 mm slab. Metabolite maps were obtained via SIVIC10 and analyzed using MATLAB. Statistical analysis was conducted via t-tests, and ANOVA. kPL, the apparent rate of enzymatic conversion of HP pyruvate to lactate (glycolytic activity), was calculated as described previously11. HP 13C-urea peak area under dynamic curve (AUC) for tumors was calculated and normalized to maximum urea signal from a neighboring blood vessel to measure perfusion. Tumors were harvested and processed for immunohistochemistry post-baseline (n = 2, control) and carboplatin treatment (n = 3) and stained with hematoxylin and eosin (H&E) and ki67.Results and discussion
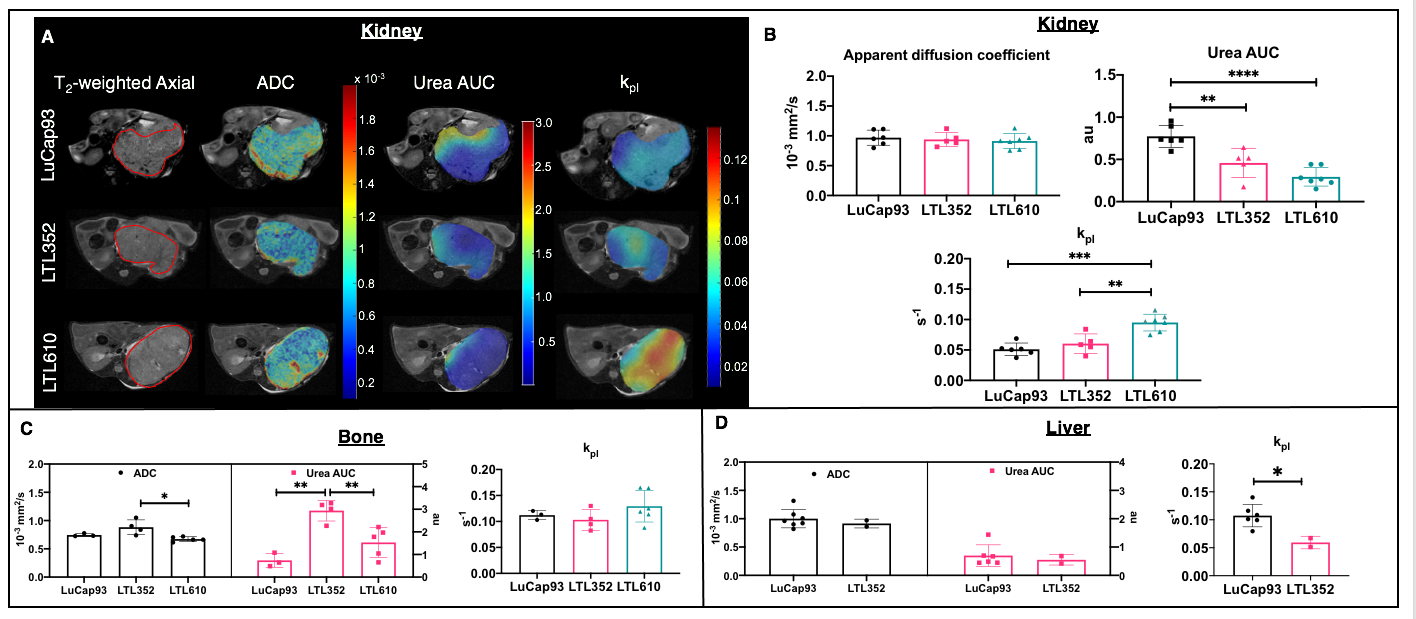
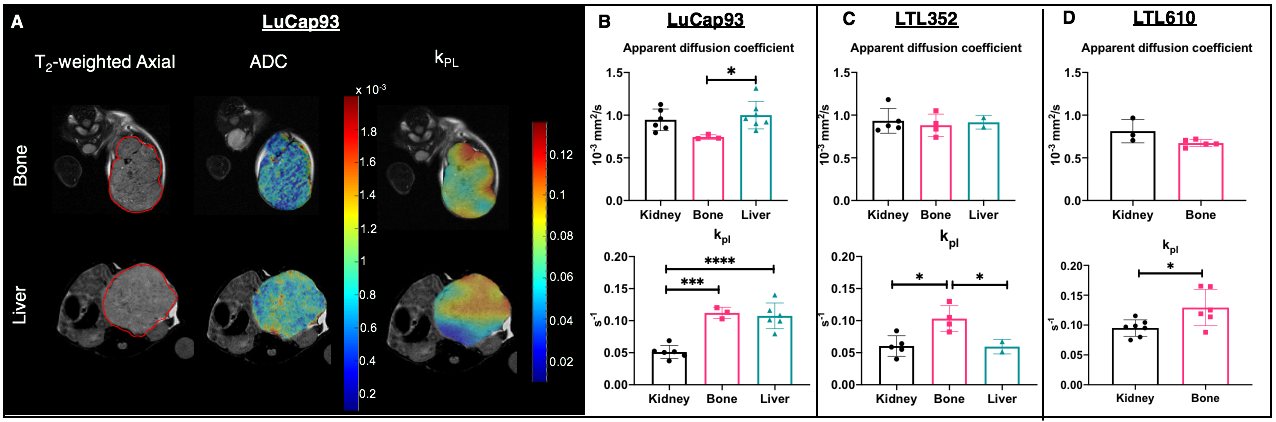
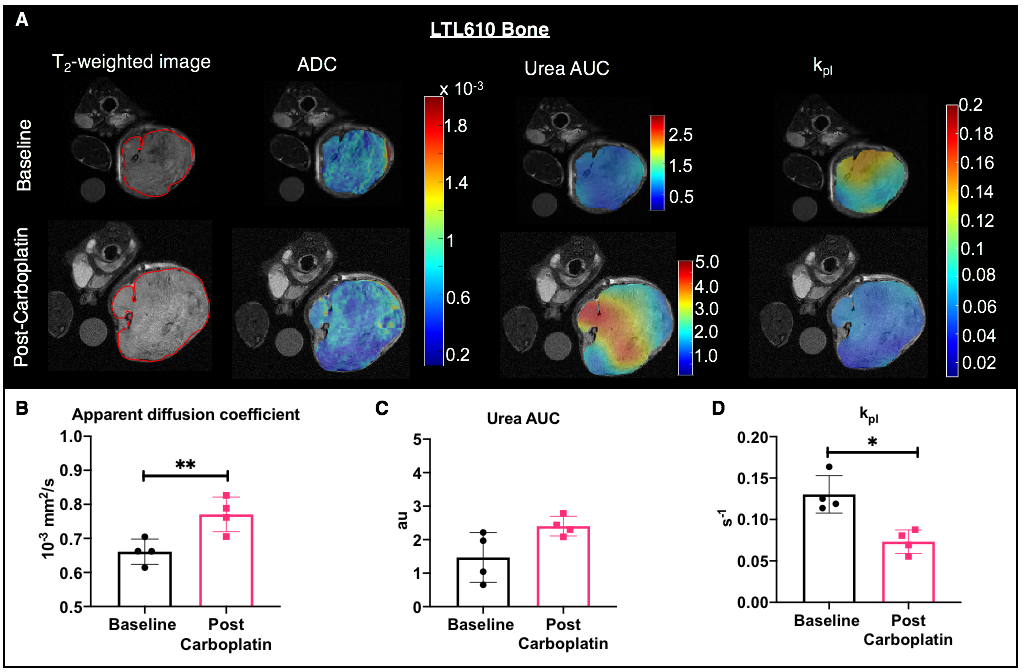
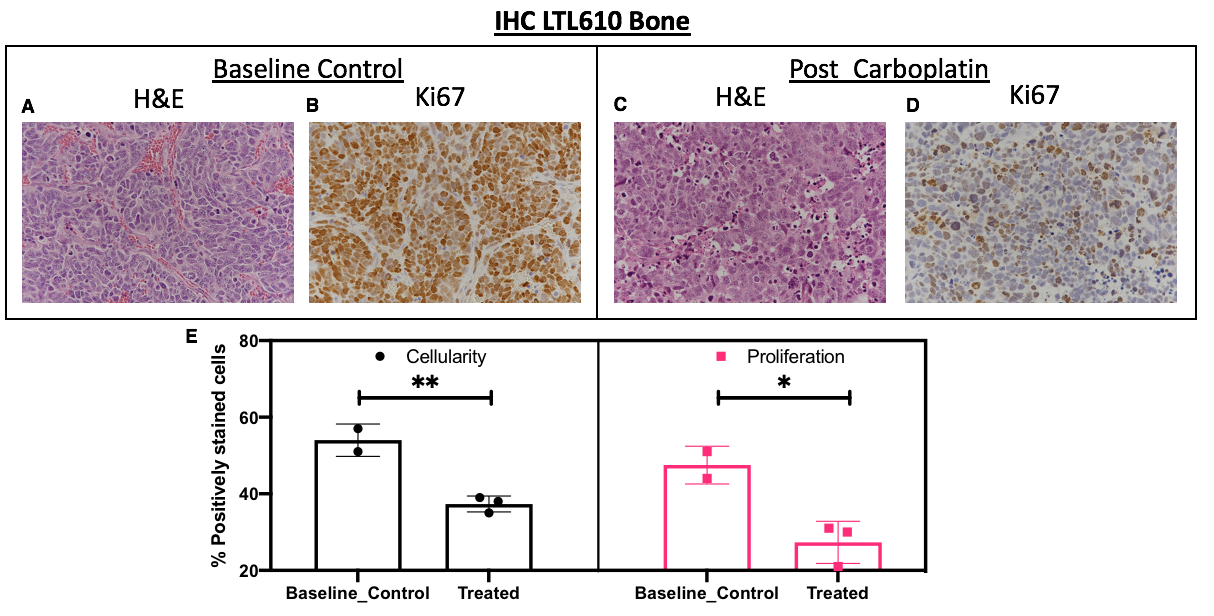
Representative T2-weighted images of PDXs implanted in kidney overlaid with ADC, urea AUC and kpl maps are shown in fig 1A. Although the three different PDXs had similar cellularity in kidney, LuCaP93 tumors had significantly higher perfusion (as measured by urea AUC) and contrastingly, LTL610 tumors had significantly higher kpl (fig1B). Interestingly, when propagated in the murine tibia, the LTL352 bone tumors had significantly higher mean ADC and urea AUC, the kpl was similar among the three PDXs (fig1C). LuCaP93 liver tumors had significantly higher kpl compared to LTL352 (fig1D) despite similar cellularity reflecting true differences in glycolytic capacity. Representative T2-weighted images of bone and liver implanted LuCaP93 tumors overlaid with ADC and kpl maps are shown in fig 2A. Analysis of individual PDX characteristics implanted in different host organs highlighted that bone tumors across all PDXs had significantly higher kpl compared to kidneys (fig 2B-D). LuCaP93 tumors in liver had significantly higher kpl compared to those in kidneys and were significantly more cellular (fig 2B). LTL352 bone tumors had significantly higher kpl as compared to the liver tumors (fig2C). Treatment effect on LTL610 bone tumors: Tumor growth rate post carboplatin decreased on an average by 30 ± 28% from baseline. Significant decrease in cellularity (as shown by significant increase in mean ADC to 0.77±0.05x10⁻³ mm2/s, fig3B) and kPL (0.13±0.02 s-1 at baseline to 0.07±0.01 s-1, fig 3D) indicate response to carboplatin. Representative IHC stains are shown in fig 4A-D. Significantly lower cellularity (H&E) and proliferation (ki67) as measured by IHC image analysis in treated tumors indicate the toxic effect of carboplatin. (fig4E).Conclusions
Our kpl measurements show that bone (0.11s-1) and liver (0.09s-1) SCNC PDXs were highly glycolytic as compared to the kpl observed in patients with bone and liver metastasis (0.02 and 0.026s-1 respectively12). Observation of significant decrease in LTL610 bone tumor metabolism post-treatment before observation of significant reduction in tumor growth rate might indicate the ability of kpl in predicting an early response. Future studies will focus on investigating the molecular and metabolic mechanisms responsible for differential metabolism of the PDXs in different host organs and the treatment response in tumors implanted in liver. Since clinical assessment of treatment response in metastases via RECIST criteria is difficult13, non-invasive hyperpolarized 13C MR has the potential to provide an early metabolic readout of the metastatic tumors and aid in monitoring therapeutic efficacy.Acknowledgements
Grant Support: National Institute of Health (NIH) R01CA215694, P41EB013598, DoD PCRP Idea Development Award W81XWH-17-1-0471 and UCSF Prostate Cancer Program Pilot funding (2019)References
1. Crona, D. J. & Whang, Y. E. Androgen Receptor-Dependent and -Independent Mechanisms Involved in Prostate Cancer Therapy Resistance. Cancers (Basel) 9, (2017).
2. Aggarwal, R., Zhang, T., Small, E. J. & Armstrong, A. J. Neuroendocrine prostate cancer: subtypes, biology, and clinical outcomes. J Natl Compr Canc Netw 12, 719–726 (2014).
3. Singh, A. et al. Liver Metastases in Prostate Carcinoma Represent a Relatively Aggressive Subtype Refractory to Hormonal Therapy and Short-Duration Response to Docetaxel Monotherapy. World J. Oncol. 6, 265–269 (2015).
4. Drake, C. G. Visceral metastases and prostate cancer treatment: “die hard,” “tough neighborhoods,” or “evil humors”? Oncology 28, 974–980 (2014).
5. Kurhanewicz, J. et al. Analysis of cancer metabolism by imaging hyperpolarized nuclei: prospects for translation to clinical research. Neoplasia 13, 81–97 (2011).
6. Lam, H.-M., Nguyen, H. M. & Corey, E. Generation of Prostate Cancer Patient-Derived Xenografts to Investigate Mechanisms of Novel Treatments and Treatment Resistance. Methods Mol. Biol. 1786, 1–27 (2018).
7. Choi, S. Y. C. et al. Lessons from patient-derived xenografts for better in vitro modeling of human cancer. Adv. Drug Deliv. Rev. 79–80, 222–237 (2014).
8. Sriram, R. et al. Non-Invasive Assessment of Lactate Production and Compartmentalization in Renal Cell Carcinomas Using Hyperpolarized 13C Pyruvate MRI. Cancers (Basel) 10, (2018).
9. Valta, M. P. et al. Development of a realistic in vivo bone metastasis model of human renal cell carcinoma. Clin Exp Metastasis 31, 573–584 (2014).
10. Crane, J. C., Olson, M. P. & Nelson, S. J. SIVIC: Open-Source, Standards-Based Software for DICOM MR Spectroscopy Workflows. Int J Biomed Imaging 2013, 169526 (2013).
11. Larson, P. E. Z. et al. Investigation of analysis methods for hyperpolarized 13C-pyruvate metabolic MRI in prostate cancer patients. NMR Biomed. 31, e3997 (2018).
12. Chen, H.-Y. et al. Hyperpolarized 13C-pyruvate MRI detects real-time metabolic flux in prostate cancer metastases to bone and liver: a clinical feasibility study. Prostate Cancer Prostatic Dis. 23, 269–276 (2020).
13. Schwartz, L. H. et al. RECIST 1.1-Update and clarification: From the RECIST committee. Eur. J. Cancer 62, 132–137 (2016).
Figures