0762
Deep Learning for the Ovarian Lesion Localization and Discrimination Between Borderline Tumors and Cancers in MR Imaging1East China Normal University, Shanghai Key Laboratory of Magnetic Resonance, Shanghai, China, 2Department of Radiology, Obstetrics and Gynecology Hospital, Fudan University, Shanghai, China
Synopsis
We proposed a deep learning (DL) approach to segment ovarian lesion and differentiate ovarian malignant from borderline tumors in MR Imaging. Firstly, we used U-net++ with deep supervision to automatically define lesion region on conventional MRI; secondly, the segmented ovarian masses regions were classified with an SE-ResNet model. We compared the performance of classification model with those of radiologist’. The results showed the trained DL network model could help to identify and categorize ovarian masses with a high accuracy from MR images.
INTRODUCTION
Ovarian borderline tumors (BOTs) account for approximately 10-15% of epithelial ovarian tumors, with an annual prevalence of 1.8-4.8/100,000 women worldwide1. Compared with other ovarian malignant tumors, ovarian BOTs often occur in young patients with early-stage disease, and patients have a good prognosis with fertility-sparing conservative treatments2. Therefore, preoperative identification of patients with ovarian lesions suspected of being BOTs may be helpful for their management. Inspired by recent success of deep learning (DL) in medical images3, we proposed a novel method based on DL to locate ovarian lesion and discriminate between ovarian BOTs and malignant tumors in MR images.METHODS
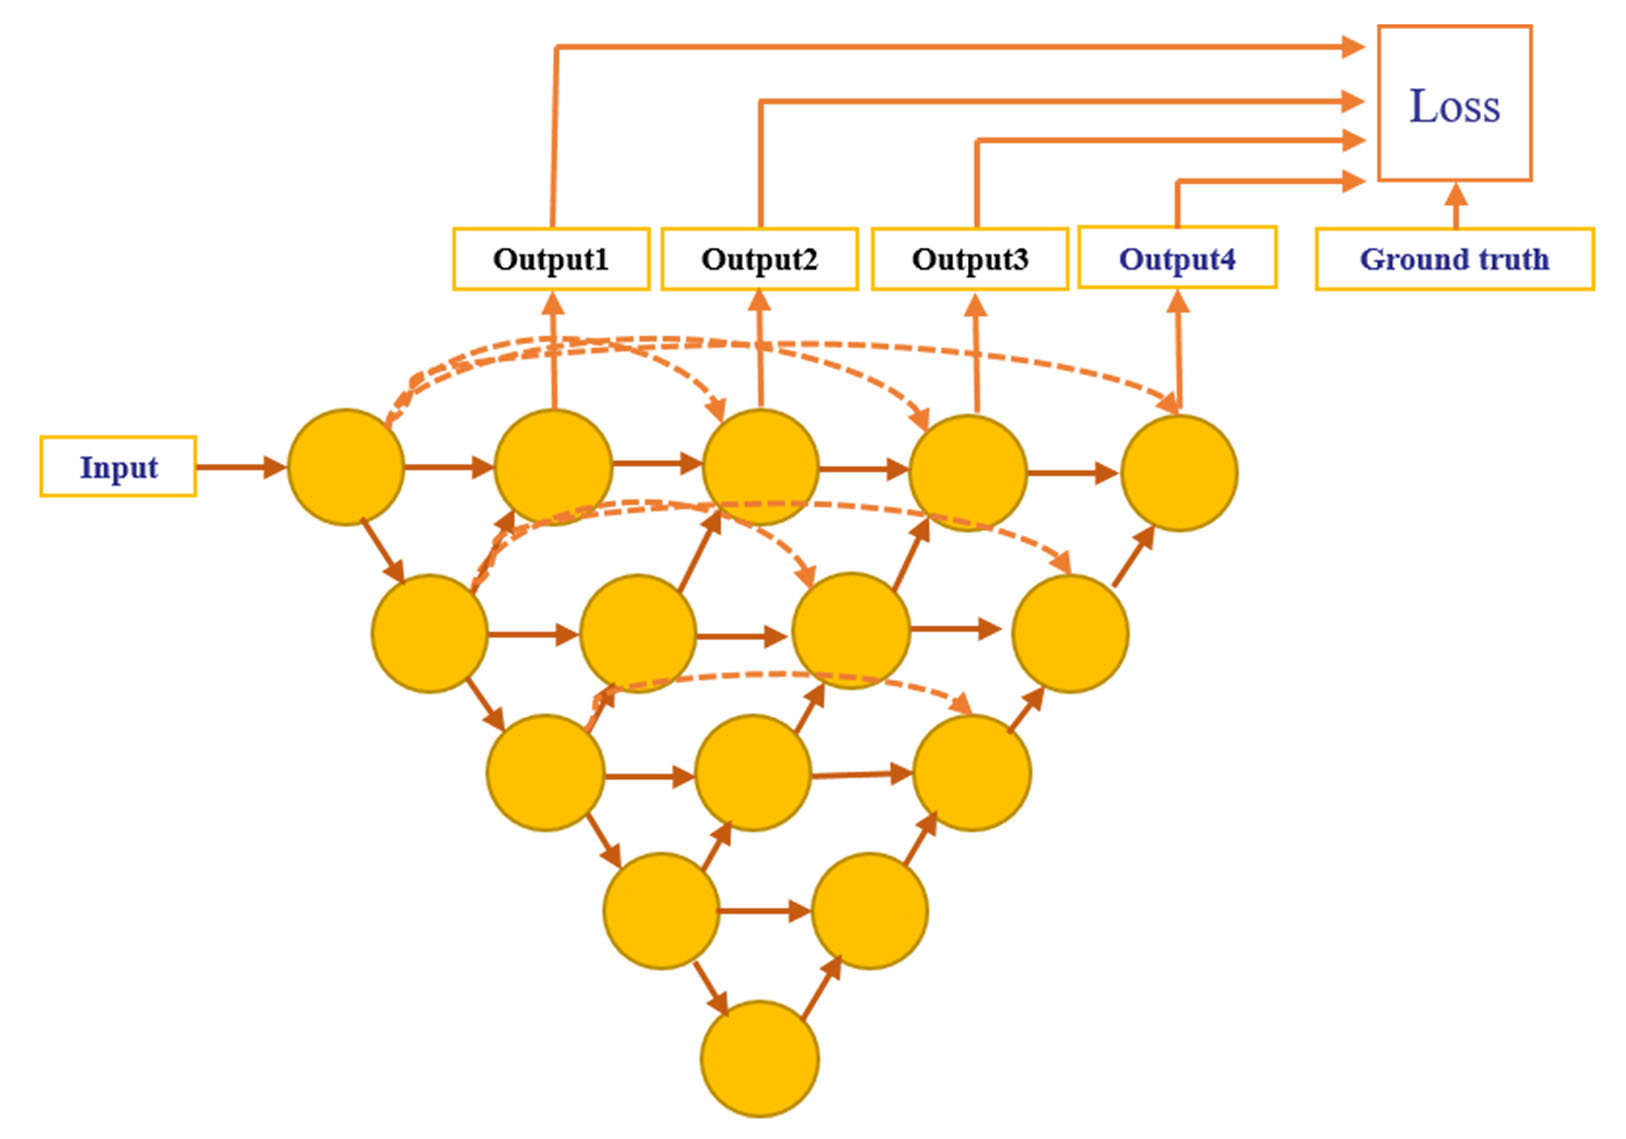
We retrospectively enrolled 201 cases with 102 pathologically proven ovarian BOTs and 99 malignant tumors from Obstetrics and Gynecology Hospital of Fudan University between January 1, 2015 and December 31, 2017. Sagittal and coronal T2WI MRI was performed using a 1.5-T MR system (Magnetom Avanto, Siemens) with a phased-array coil. All volume lesion segmentation on MRI was manually outlined by an experienced radiologist (H. Z.) using ITK-SNAP software (ITK-SNAP, version 3.4.0) and treated as ground truth of the segmentation model. The dataset was randomly split into three sets: 123 cases (61 malignant / 62 borderline) for training dataset, 29 cases (14 / 15) for validation, and 49 cases (24 / 25) for test. Random augmentation including shifting, rotation and shearing was used for each sample and all samples were standardized by subtracting the mean value and dividing the standard deviation during the training process.Firstly, we used U-net++ model4 with deep supervision shown in Fig.1 to segment the ovarian tumor regions in MR images. U-net++ consisted of an encoder path to capture high-level semantic information and decoder path to recover spatial information. The encoder and decoder paths were connected with nested and dense skip connections. Tversky loss5 was used as the loss function to address the foreground and background pixels imbalanced problem shown in the following equation:
$$Tversky(P, G, \alpha, \beta) = \frac{|PG|}{|PG| + \alpha|P \backslash G|+\beta|G \backslash P|}$$
where P and G represents segmented results and ground truth, respectively, and the backslash stands for XOR operator. Hyper-parameters α and β was set as 0.7 and 0.3 in the experiments.
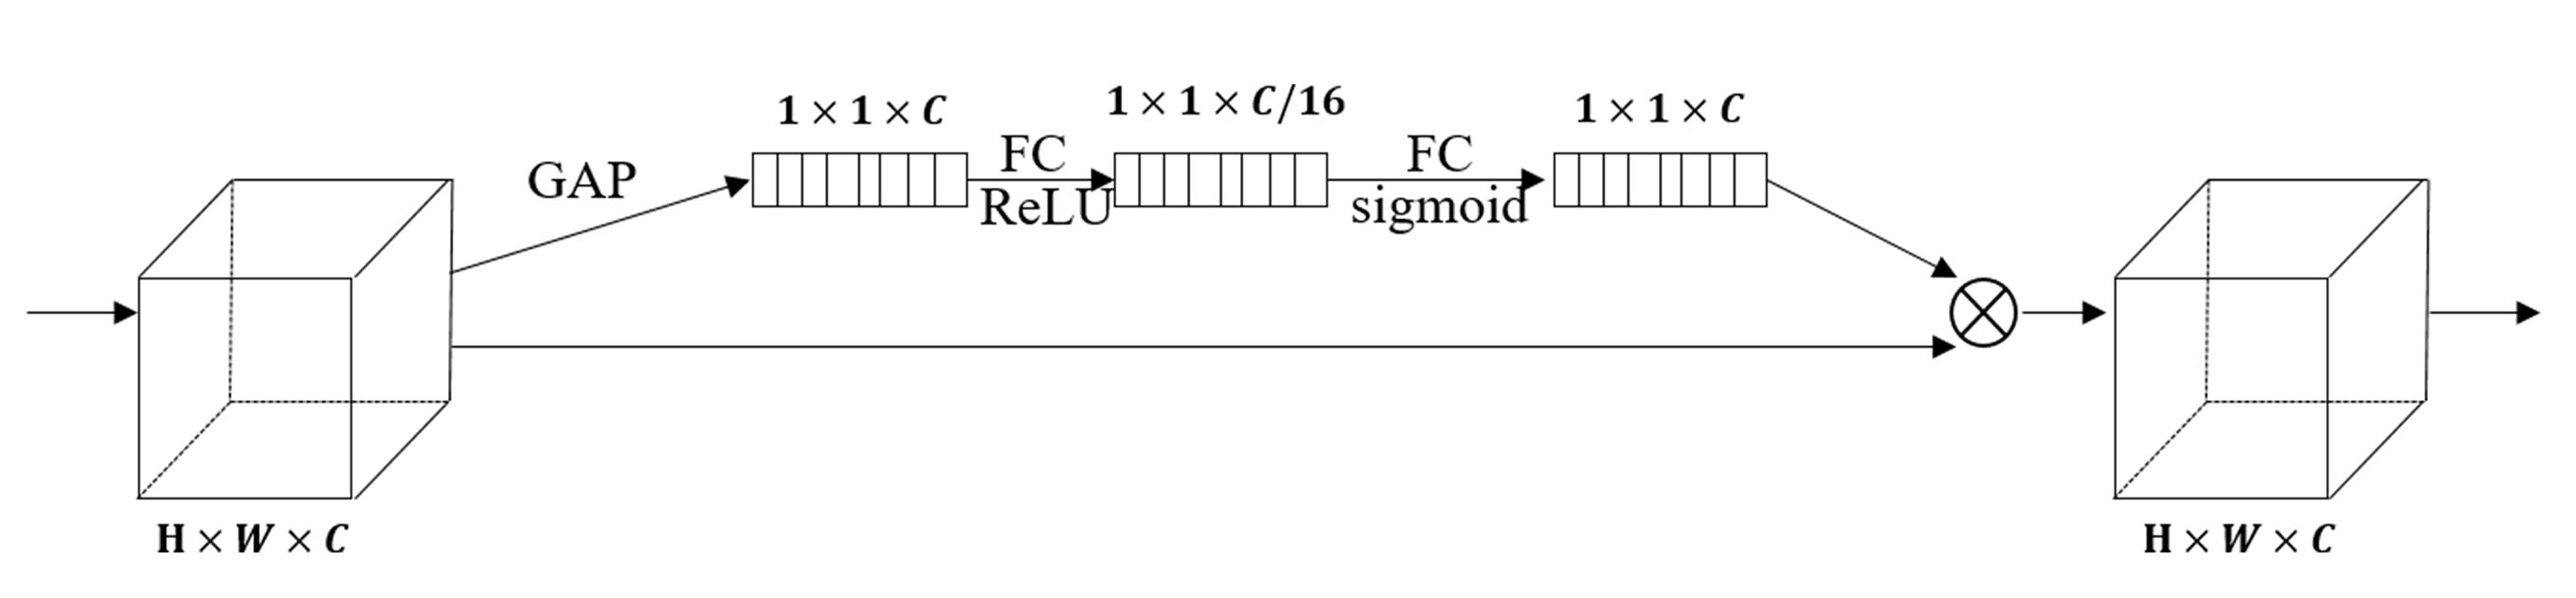
Then SE-ResNet-34 model was used to discriminate between borderline and malignant ovarian tumors. We integrated SE block6 (Fig. 2) into the ResNet-34 network and called it SE-ResNet-34. Tumor regions were cropped from MR images and resized to the 96 × 96 matrix size before input into the network. We applied cross-entropy function as the loss function for the classification experiment.
During the training process, we used early stopping to prevent overfitting and the training was stopped if the loss on the validation dataset did not reduce over 10 iterations. Adam algorithm was used with an initial learning rate of 10−4. The models were implemented using TensorFlow (version: 2.0.0) and Python (version: 3.7). The experiments were conducted on a workstation equipped with four NVIDIA TITAN XP GPUs.
In the testing process, normalized MR images were input into the trained U-net++ network to segment ovarian tumor regions. Then, we cropped and resized the segmented tumor region to 96 × 96 matrix size and fed resized patch into the trained SE-ResNet-34 model to get the probability of tumor being malignant in each slice. The average probability of all slices containing tumor regions was used to categorize ovarian masses for each case.
RESULTS
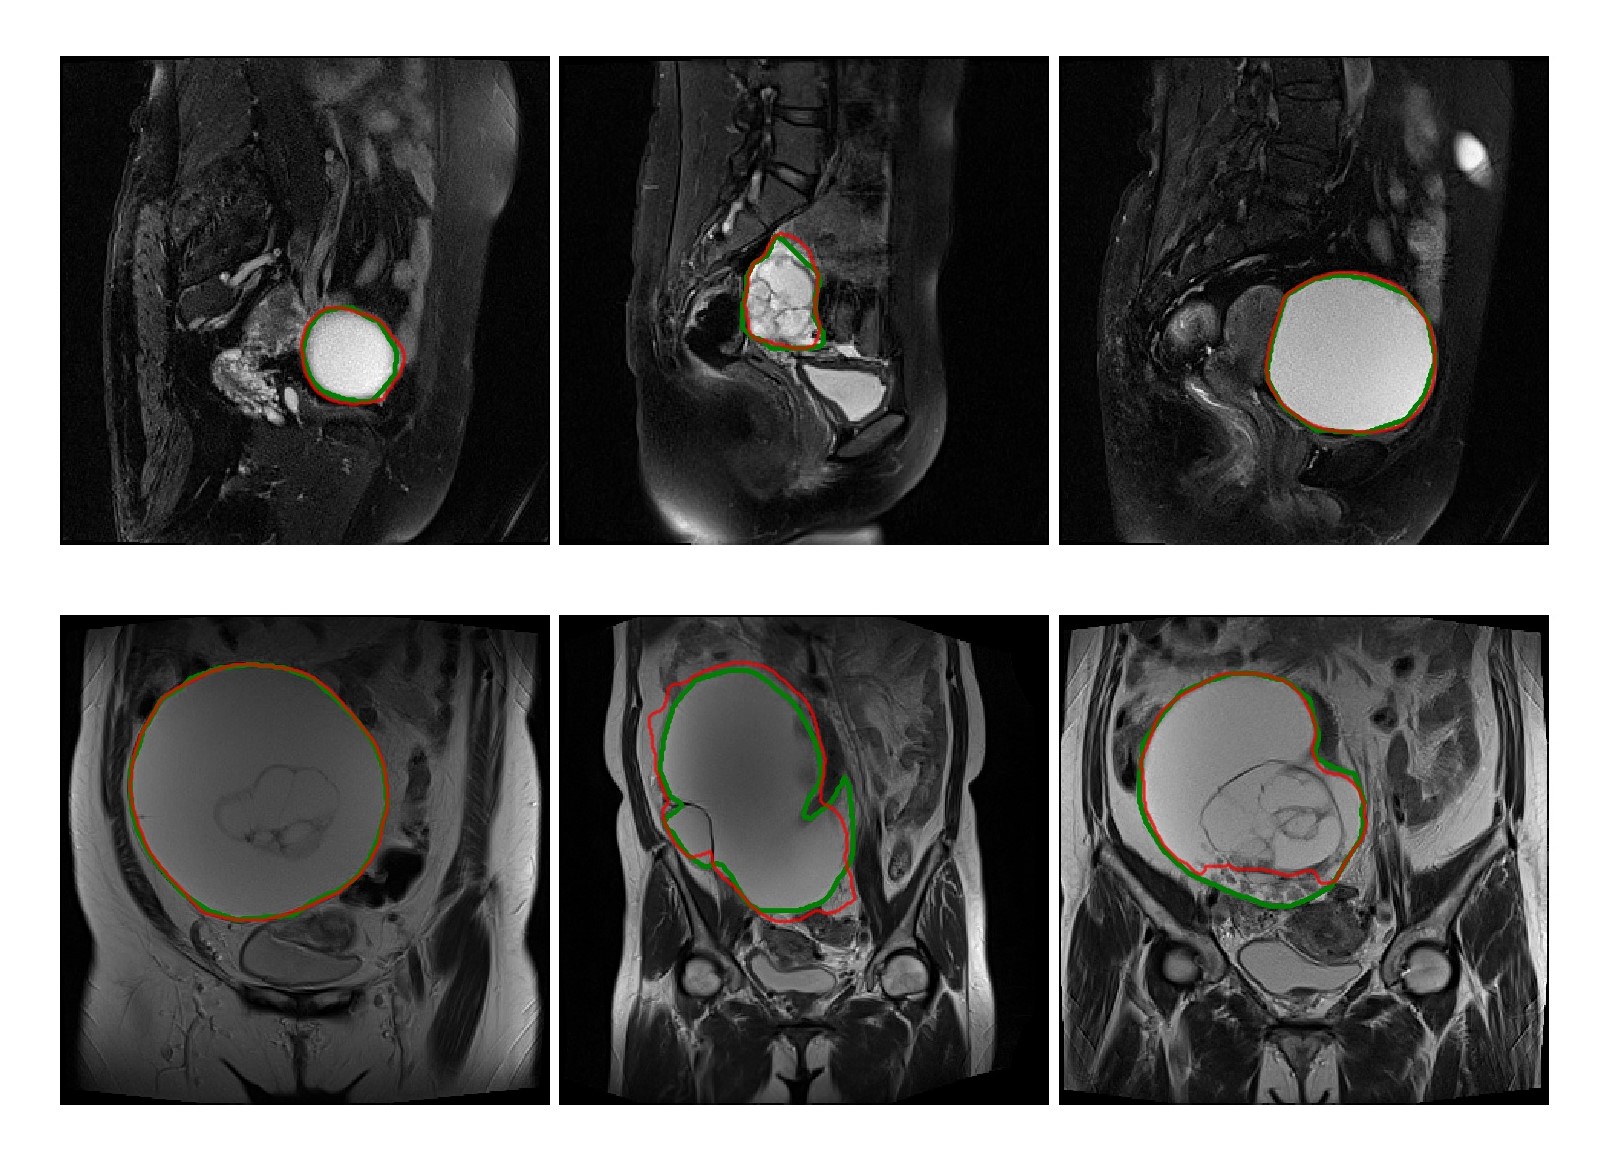
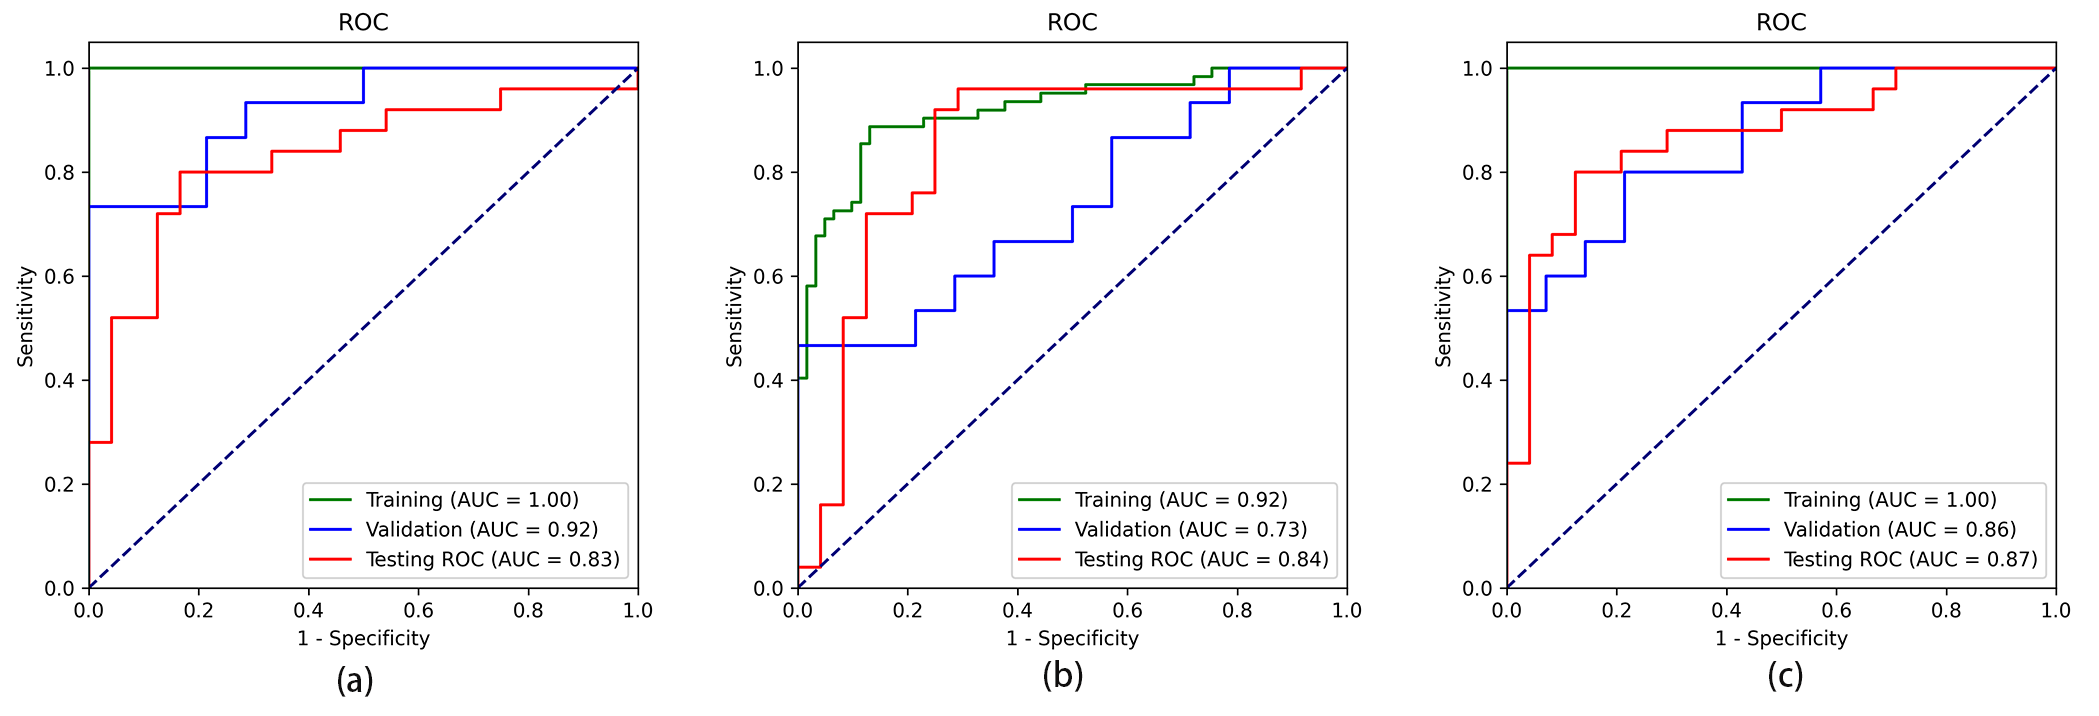
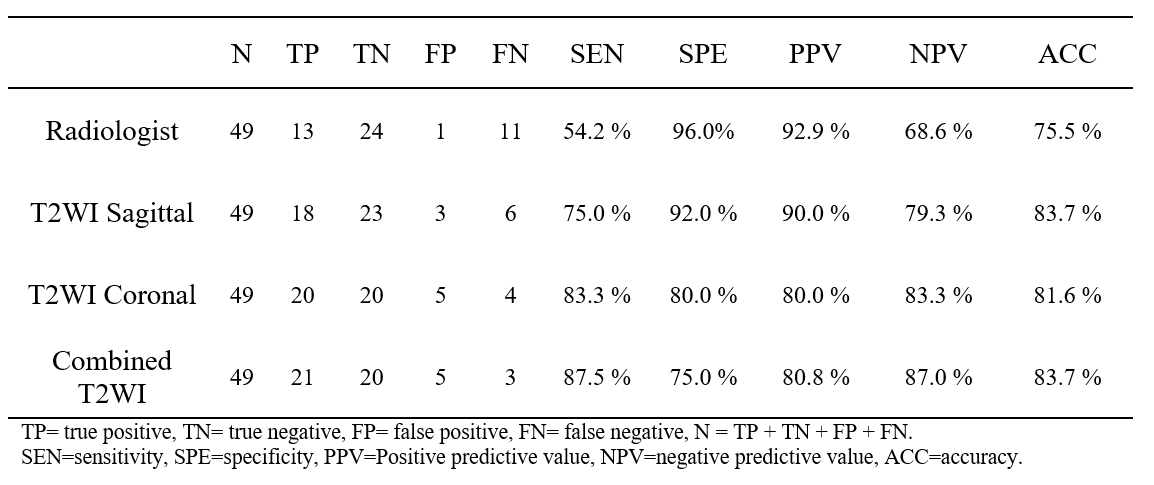
In the testing dataset, the segmentation model achieved a mean dice similarity coefficient (DSC) of 0.73 ± 0.25 and 0.76 ± 0.18 in the sagittal and coronal T2WI MR images, respectively. From the comparison between segmented regions and ground truth (Fig. 3), we can see that U-net++ could accurately segment ovarian tumor in MR images.We evaluated the performance of the proposed algorithm with the receiver operating characteristic (ROC) curve (Fig.4). We combined the identification results on both sagittal and coronal T2WI MR images and yielded an area under ROC curve (AUC) of 0.87 (95% CI, 0.751–0.96; p < 0.001), an accuracy of 84.1%, a sensitivity of 87.5%, a specificity of 75.0%; while the radiologist yielded an accuracy of 75.5%, a sensitivity of 54.2% and a specificity of 96.0% in determining ovarian cancer from BOTs. Diagnostic performance comparison between radiologist and DL models in ovarian masses discrimination in the testing dataset on MR imaging was shown in Table 1.
DISCUSSION
Different from previous works, we used DL model to automatically segment the ovarian lesion omitting the potentially individual segmentation bias. In the U-net++ model, nested and dense skip connection could reduce semantic gap between encoder and decoder stage. In the SE-ResNet-34 model, SE block extracted information from global receptive field and learnt channel-wise responses. The channel-weighted features could enhance useful features, suppress less useful ones, and improve performance of the model. From the results, we can see that the combined T2WI-based DL network showed better performance than single T2WI-based model did and may help clinicians make a correct diagnosis before surgery.CONCLUSION
In summary, our results suggested that the DL networks can be used to automatically delineate ovarian tumor lesions and differentiate ovarian BOTs from malignant from T2WI images with a high degree of accuracy.Acknowledgements
NoneReferences
1. Fang C, Zhao L, Chen X, et al. The impact of clinicopathologic and surgical factors on relapse and pregnancy in young patients (≤40 years old) with borderline ovarian tumors. BMC cancer 2018, 18(1):1147-1147.
2. Hauptmann S, Friedrich K, Redline R, et al. Ovarian borderline tumors in the 2014 WHO classification: evolving concepts and diagnostic criteria. Virchows archive. 2017, 470(2): 125-142.
3. Litjens G, Kooi T, Bejnordi B E, et al. A survey on deep learning in medical image analysis. Medical image analysis. 2017, 42: 60-88.
4. Zhou Z, Siddiquee MMR, Tajbakhsh N, et al. UNet++: Redesigning Skip Connections to Exploit Multiscale Features in Image Segmentation. IEEE Transactions on Medical Imaging. 2020, 39(6):1856-1867.
5. Salehi SSM, Erdogmus D, Gholipour A. Tversky loss function for image segmentation using 3D fully convolutional deep networks. In: International Workshop on Machine Learning in Medical Imaging Springer, Cham. 2017: 379-387.
6. Hu J, Shen L, Sun G. Squeeze-and-excitation networks. In: Proceedings of the IEEE conference on computer vision and pattern recognition: 2018. 2018: 7132-7141.
Figures