0761
DTI quantitative parameters were used to differentiate uterine sarcoma from cell - rich uterine fibroids
Changjun Ma1, Ailian Liu1, Shifeng Tian1, and Jiazheng Wang2
1Radiology Department, The First Affiliated Hospital of Dalian Medical University, Dalian, China, Dalian,China, China, 2Philips Healthcare,Beijing,China, Beijing,China, China
1Radiology Department, The First Affiliated Hospital of Dalian Medical University, Dalian, China, Dalian,China, China, 2Philips Healthcare,Beijing,China, Beijing,China, China
Synopsis
DTI is a novel MRI sequence that enables quantitative assessment of various diseases. However, its potential for diagnosis of uterus has not been explored,and it may also help differential diagnosis of myoma of uterus and uterine sarcoma.In this study, the DTI was used for quantitative analyses of myoma of uterus and uterine sarcoma.
Purpose
To explore the value of diffusion tensor imaging(DTI) in the differential diagnosis of uterine sarcoma and cell - rich uterine fibroids.Introduction
Diffusion tensor imaging(DTI) is able to quantify the velocity and direction of water molecules in human tissues, thus to reflect micro-structure of tissues as well as physiological and pathological changes. DTI related parameters fractional anisotropy(FA) and apparent diffusion coefficient(ADC) value can reveal microscopic structure quantitatively. Fiber tractography(FT) can visually display the direction and distribution of fiber bundles, providing more anatomical details.Presently,the application of DTI in uterus has come to increasingly attention. DTI can well diplay fibrous structure of normal uterus and also be applied in uterine diseases, for instance,the differentiation of uterine sarcoma and cell - rich uterine fibroids.Uterine sarcoma is the malignant tumor in the uterus, It can be difficult to distinguish the two types of cervix tumor on conventional MR images due to similar signals. In this study, the possibility of DTI for differential diagnoses of uterine sarcoma and cell - rich uterine fibroids was investigated.Materials and Methods
Data of 16 patients with uterine sarcoma and 18 patients with cell-rich uterine fibroids confirmed by operation and pathology were retrospectively DTI and Conventional MR scan, such as T1W, T2W, DWI and DYNAMIC were performed on a 1.5T MR scanner(Table1). Next, DTI raw data was upload to GE AW 4.6 workstation, and the DTI parameter maps were caclulated by post-processing in Functool software. Referring to the anatomical location of lesion obtained on T2-weighted or DWI images, the size circle ROIs (100mm2-200mm2) were manually placed on the largest lesions on DTI parameter images, respectively. Mean values of the DTI values of the two layers were calculated and recorded. Intra-group correlation coefficient (ICC) was used to test the measurement consistency between the two observers.DTI parameters (ADC-T,FA,Iso,VRA,Exat,T2-T)were measured and compared between the two groups using Mann-Whitney U test. ROC curves of the above parameters were used to analyze the diagnostic efficiency of uterine sarcoma and cell-rich uterine fibroids.Result
ICC for all parameters were more than 0.75(table1). The mean ADC-T,FA,VRA value of cell-rich uterine fibroids was statistically higher than that of uterine sarcoma ( [1.553 ± 0.193]mm2 /s vs.[1.225 ± 0.143]mm2 /s;P=0.000) 、( [0.255 ± 0.053] vs.[0.158 ± 0.061]; P = 0.000) 、( [0.076 ± 0.035] vs.0.023[0.014,0.047]; P =0.000) but the mean Iso,Exat and T2-T values of cell-rich uterine fibroids were sta- tistically lower than those of uterine sarcoma ( [130.634 ± 63.434] vs. [230.474 ± 78.811]; P =0.000) 、( [0.404 ± 0.047] vs.[0.488 ± 0.040]; P = 0. 000) and ( [130.834 ± 63.497] vs. [230.479 ± 78.813]; P = 0.000) (table2). The area under the ROC curve ( AUC) of ADC- T was 0.934 ; The AUC of FA was 0.882; The AUC of Iso was 0.845; The AUC of VRA was 0.858;The AUC of Exat was 0.937; The AUC of T2-T was0.854. The diagnosis of cut-off point between cell-rich uterine fibroids and uterine sarcoma forADC-T,FA,Iso,VRA,Exat andT2-T was 1.423mm2 /s、0.214、156.675、0.0406、0.431 and156.663,respectively. The sensitivity and specificity for ADC-T,FA,Iso ,VRA,Exat andT2-T in differentiating cell-rich uterine fibroids from uterine sarcoma were 83.3%,83.3%,93.8%,88.9%,100%,81.2%,72.2%,75.0%,77.8%,72.2%.(table3)Discussion and conclusion
ADC-T value can reflect the speed of diffusion motion of water molecules in unit time, which is negatively correlated with the degree of restriction of water molecules.Exat reflects the characteristics of tissue diffusion, but the change direction is opposite to that of .Both FA and VRA values are indicators reflecting the degree of anisotropy of an .The values of both are 0-1.The closer to 0,the more anisotropic the organization is, the more isotropic it.The results of this study showed that ADC-T value of the cell-rich uterine fibroids was higher than that of uterine sarcoma, however,the ExAt value of uterine sarcoma was higher than that of the cell-rich uterine fibroids.The difference was statistically significant(P<0.05). The reason for this may be that uterine sarcoma has a higher degree of malignancy than cellular-rich uterine fibroids. Uterine sarcoma has a high cell density, close arrangement, and reduced extracellular space, leading to significantly limited diffusion movement of water molecules inside and outside the cell and in the intercellular space, and reduced movement speed. Therefore, ADC –T value is reduced and ExAt value is increased. The FA and VRA values of the cellular-rich uterine fibroids were higher than those of uterine sarcomas, which may indicate that the smooth muscle cells of the cell-rich uterine fibroids were dense, with a high nucleo-cytoplasmic ratio, and the fiber bundles were more tightly arranged and regular than those of uterine sarcomas, resulting in the increased FA and VRA values tending to be .Acknowledgements
NoReferences
: ZHANG Wen-ting,YIN Hua-bin, et al.Research Progress on the Application of Diffusion Tensor Imaging in Uterus and Uterine Diseases. Int Obstet Gynecol,December 2019,Vol. 46,No. 6 HAN Xu,SUN Meiyu,CHEN Dan,et al.Diffusion Tensor Imaging for Differentiating Borderline from Malignant Epithelial Ovarian Tumors. Journal of Clinical Radiology, vol. 38, No. 4, 2019.Figures
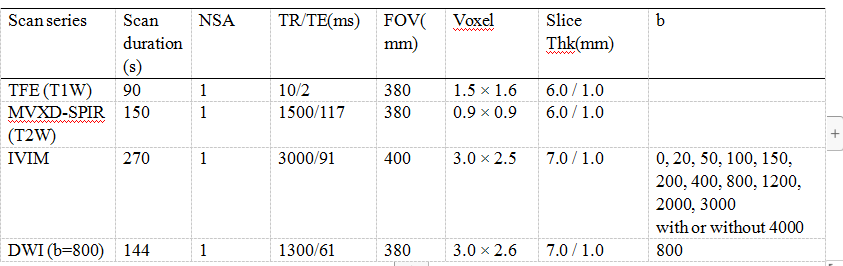
Table1: Scan parameters
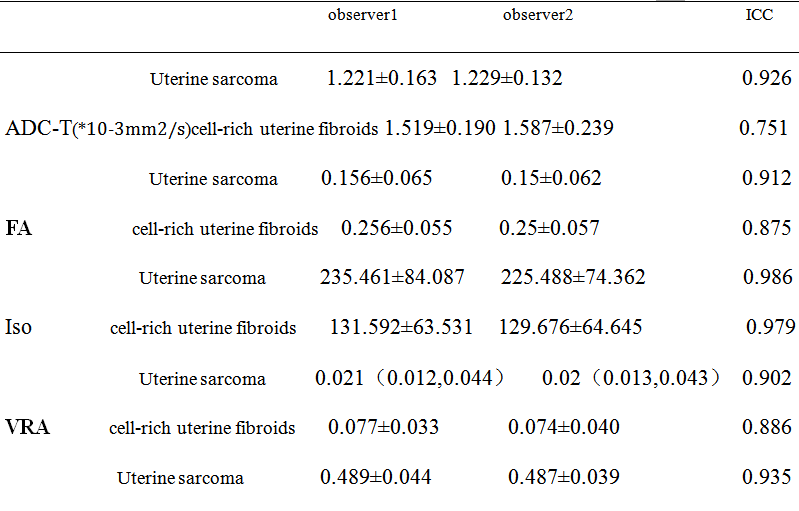
Table2:The consistency test results of each parameter measured by two observers were obtained(cell-rich uterine fibroids n=18 Uterine sarcoma n=16)
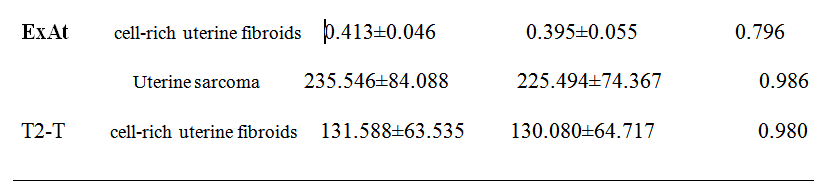
Table2:
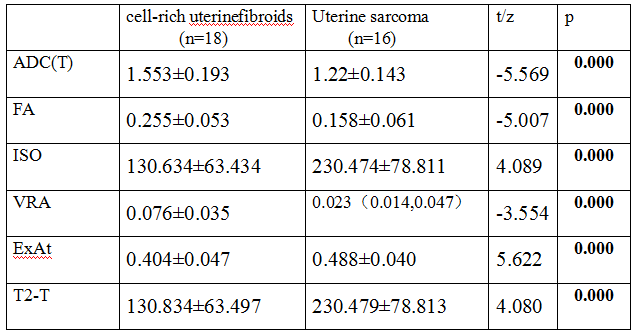
Table3:*P < 0.05 was considered statistically significant different.
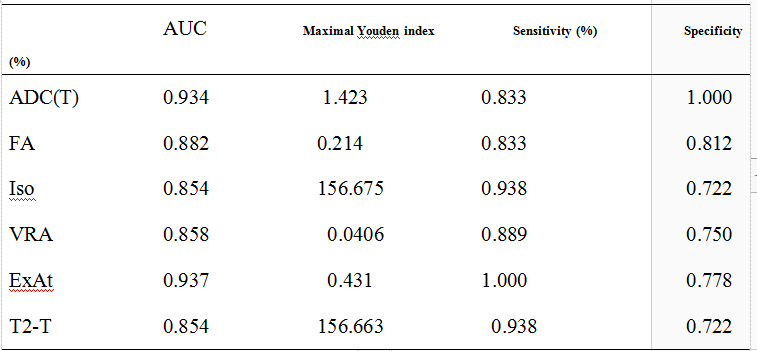
Table4:
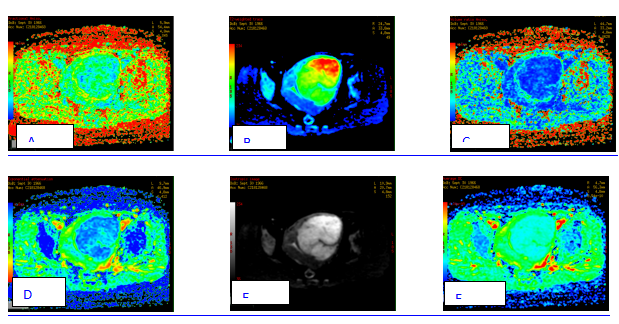
Figure1::A 54-year patient with cell-rich uterine fibroids.(A):FA;(B):T2-T;(C):VRA;(D)EA;(E):Iso;(F):ADC(T).
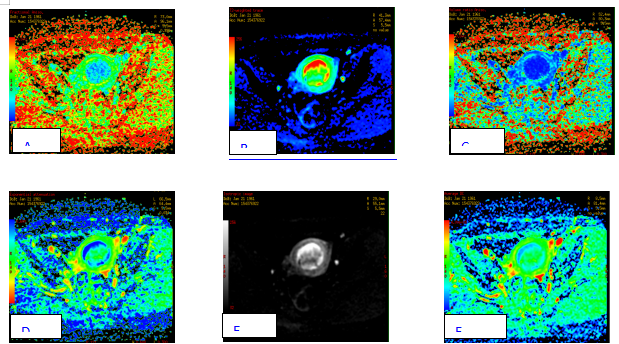
Figure2:A 59-year patient with Uterine sarcoma.(A):FA;(B):T2-T;(C):VRA;(D)EA;(E):Iso;(F):ADC(T).
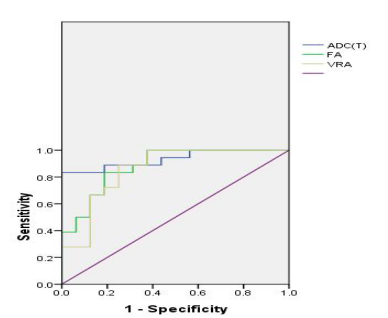
Figure3: Receiving operating characteristic (ROC) analysis of ADC(T),FA,VRA value in differention of cell-rich uterinefibroids And Uterine sarcoma.