0760
Preliminary study about T2 mapping technology in quantification of uterine benign and malignant tumors under 1.5T and 3.0T MRI1Radiology, Xiamen Branch, Zhongshan Hospital, Fudan University, Xiamen, China, 2GE Healthcare, Beijing, China
Synopsis
MRI is the best imaging tool for evaluation of uterine tumors, but conventional MRI diagnosis results are subjective. T2 mapping is an objective quantification technique under certain magnetic field. Here we compared T2 values of common benign and malignant tumors under different field strengths. We found that T2 value of benign lesions was significantly lower than those of malignant lesions under both 1.5T and 3.0T, while diagnostic performance of T2 value under 3.0T were higher than 1.5T. We concluded that T2 mapping can be an effective quantitative tool in distinguishing between benign and malignant tumors, especially under 3.0T MR.
Introduction
With the rapid development of magnetic resonance imaging (MRI) techniques and big data era, the diagnosis of lesions is no longer limited to contrast-weighted imaging manifestations, and can benefit from the quantitative measurements [1]. As one of the MRI quantitative techniques, T2 mapping is objective, reproducible and stable. It has been applied to a number of diseases including prostate tumors, breast tumors, and uterine endometrial carcinoma [2-4], except osteoarthritis and myocardial edema. This study aimed to systematically compare the differences of T2 values in normal uterine structure, common benign and malignant tumors under different magnetic field strengths, and to explore the feasibility of T2 mapping in quantifying and distinguishing common benign and malignant tumors.Methods
Thirty-five healthy subjects and 81 patients with uterine lesions were enrolled in this study after getting the institutional review board approval. Pathological results of each uterine lesion were confirmed after surgical operations. Healthy subjects underwent non-contrast conventional uterus MRI examinations, while patients with uterine lesions underwent contrast-enhanced uterus MRI examinations. All participants finished the T2 mapping data acquisitions on a 1.5T (Amira 1.5T, Siemens, German) and a 3.0T MRI scanner (Discovery MR750w, GE Healthcare, Milwaukee, WI, USA) in the same day. The detailed acquisition parameters for T2 mapping sequence under 1.5T were: slice thickness/gap = 4.0/0.8 mm, FOV = 250 x 250 mm, TR = 2000 ms, TE = 11.1/ 22.2/.../11.1*9, scan duration = 4’22”. Those under 3.0T were: slice thickness/gap = 4.0/0.8 mm, FOV = 250 x 250 mm, TR = 1500 ms, TE = 9.05/18.1/.../9.05*8, scan duration = 5’15”. T2 values were calculated by mono-exponential fitting using a custom code in MATLAB (MathWorks, Natick, MA). Regions of interest (ROIs) in normal tissues (normal endometrium: n = 34; junctional zone: n = 33; extra-myometrium layer: n = 34; fat: n = 34; gluteus maximus: n = 34), benign (adenomyosis: n = 16; myoma: n = 28; endometrial polyps: n = 12) and malignant lesions (cervical cancer: n = 15; endometrial carcinoma: n = 11) were manually delineated, and the mean T2 values in these ROIs were measured. Mann-Whitney U test was used to compare the differences of T2 values in normal uterine structure, common benign and malignant tumors between data acquired from different magnetic field strengths. The differences of T2 values between benign and malignant tumors under the same magnetic field strength were also compared. The diagnostic efficacy was evaluated by receiver operating characteristic (ROC) analysis, and the area under the curve (AUC), sensitivity and specificity were obtained.Results
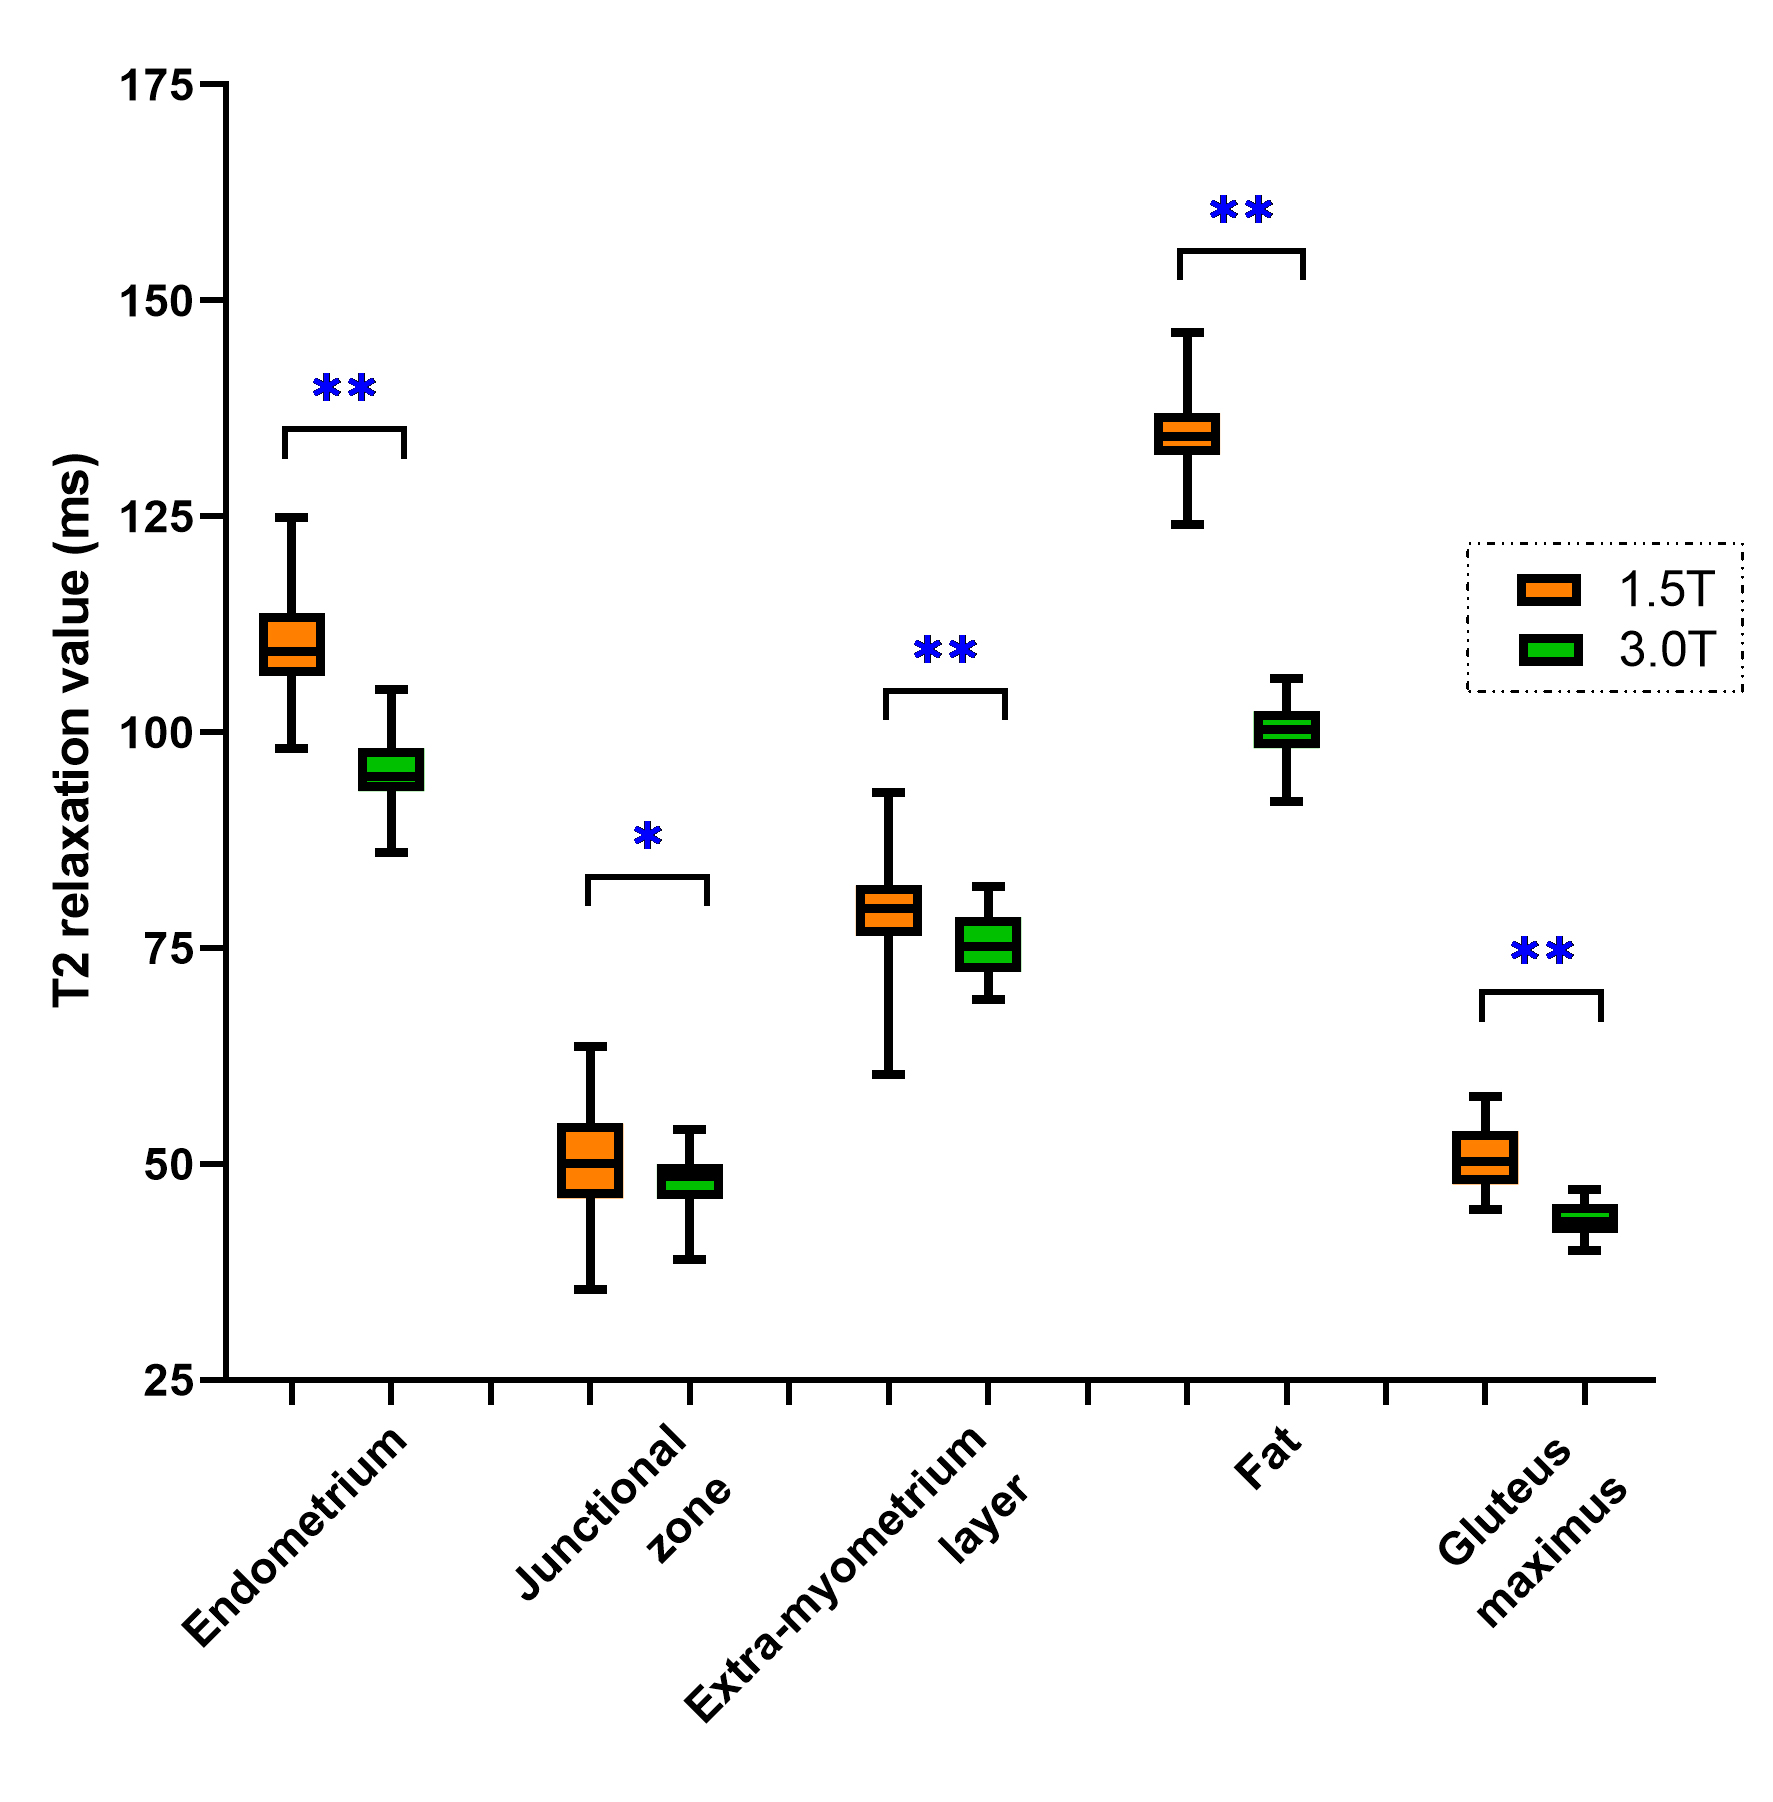
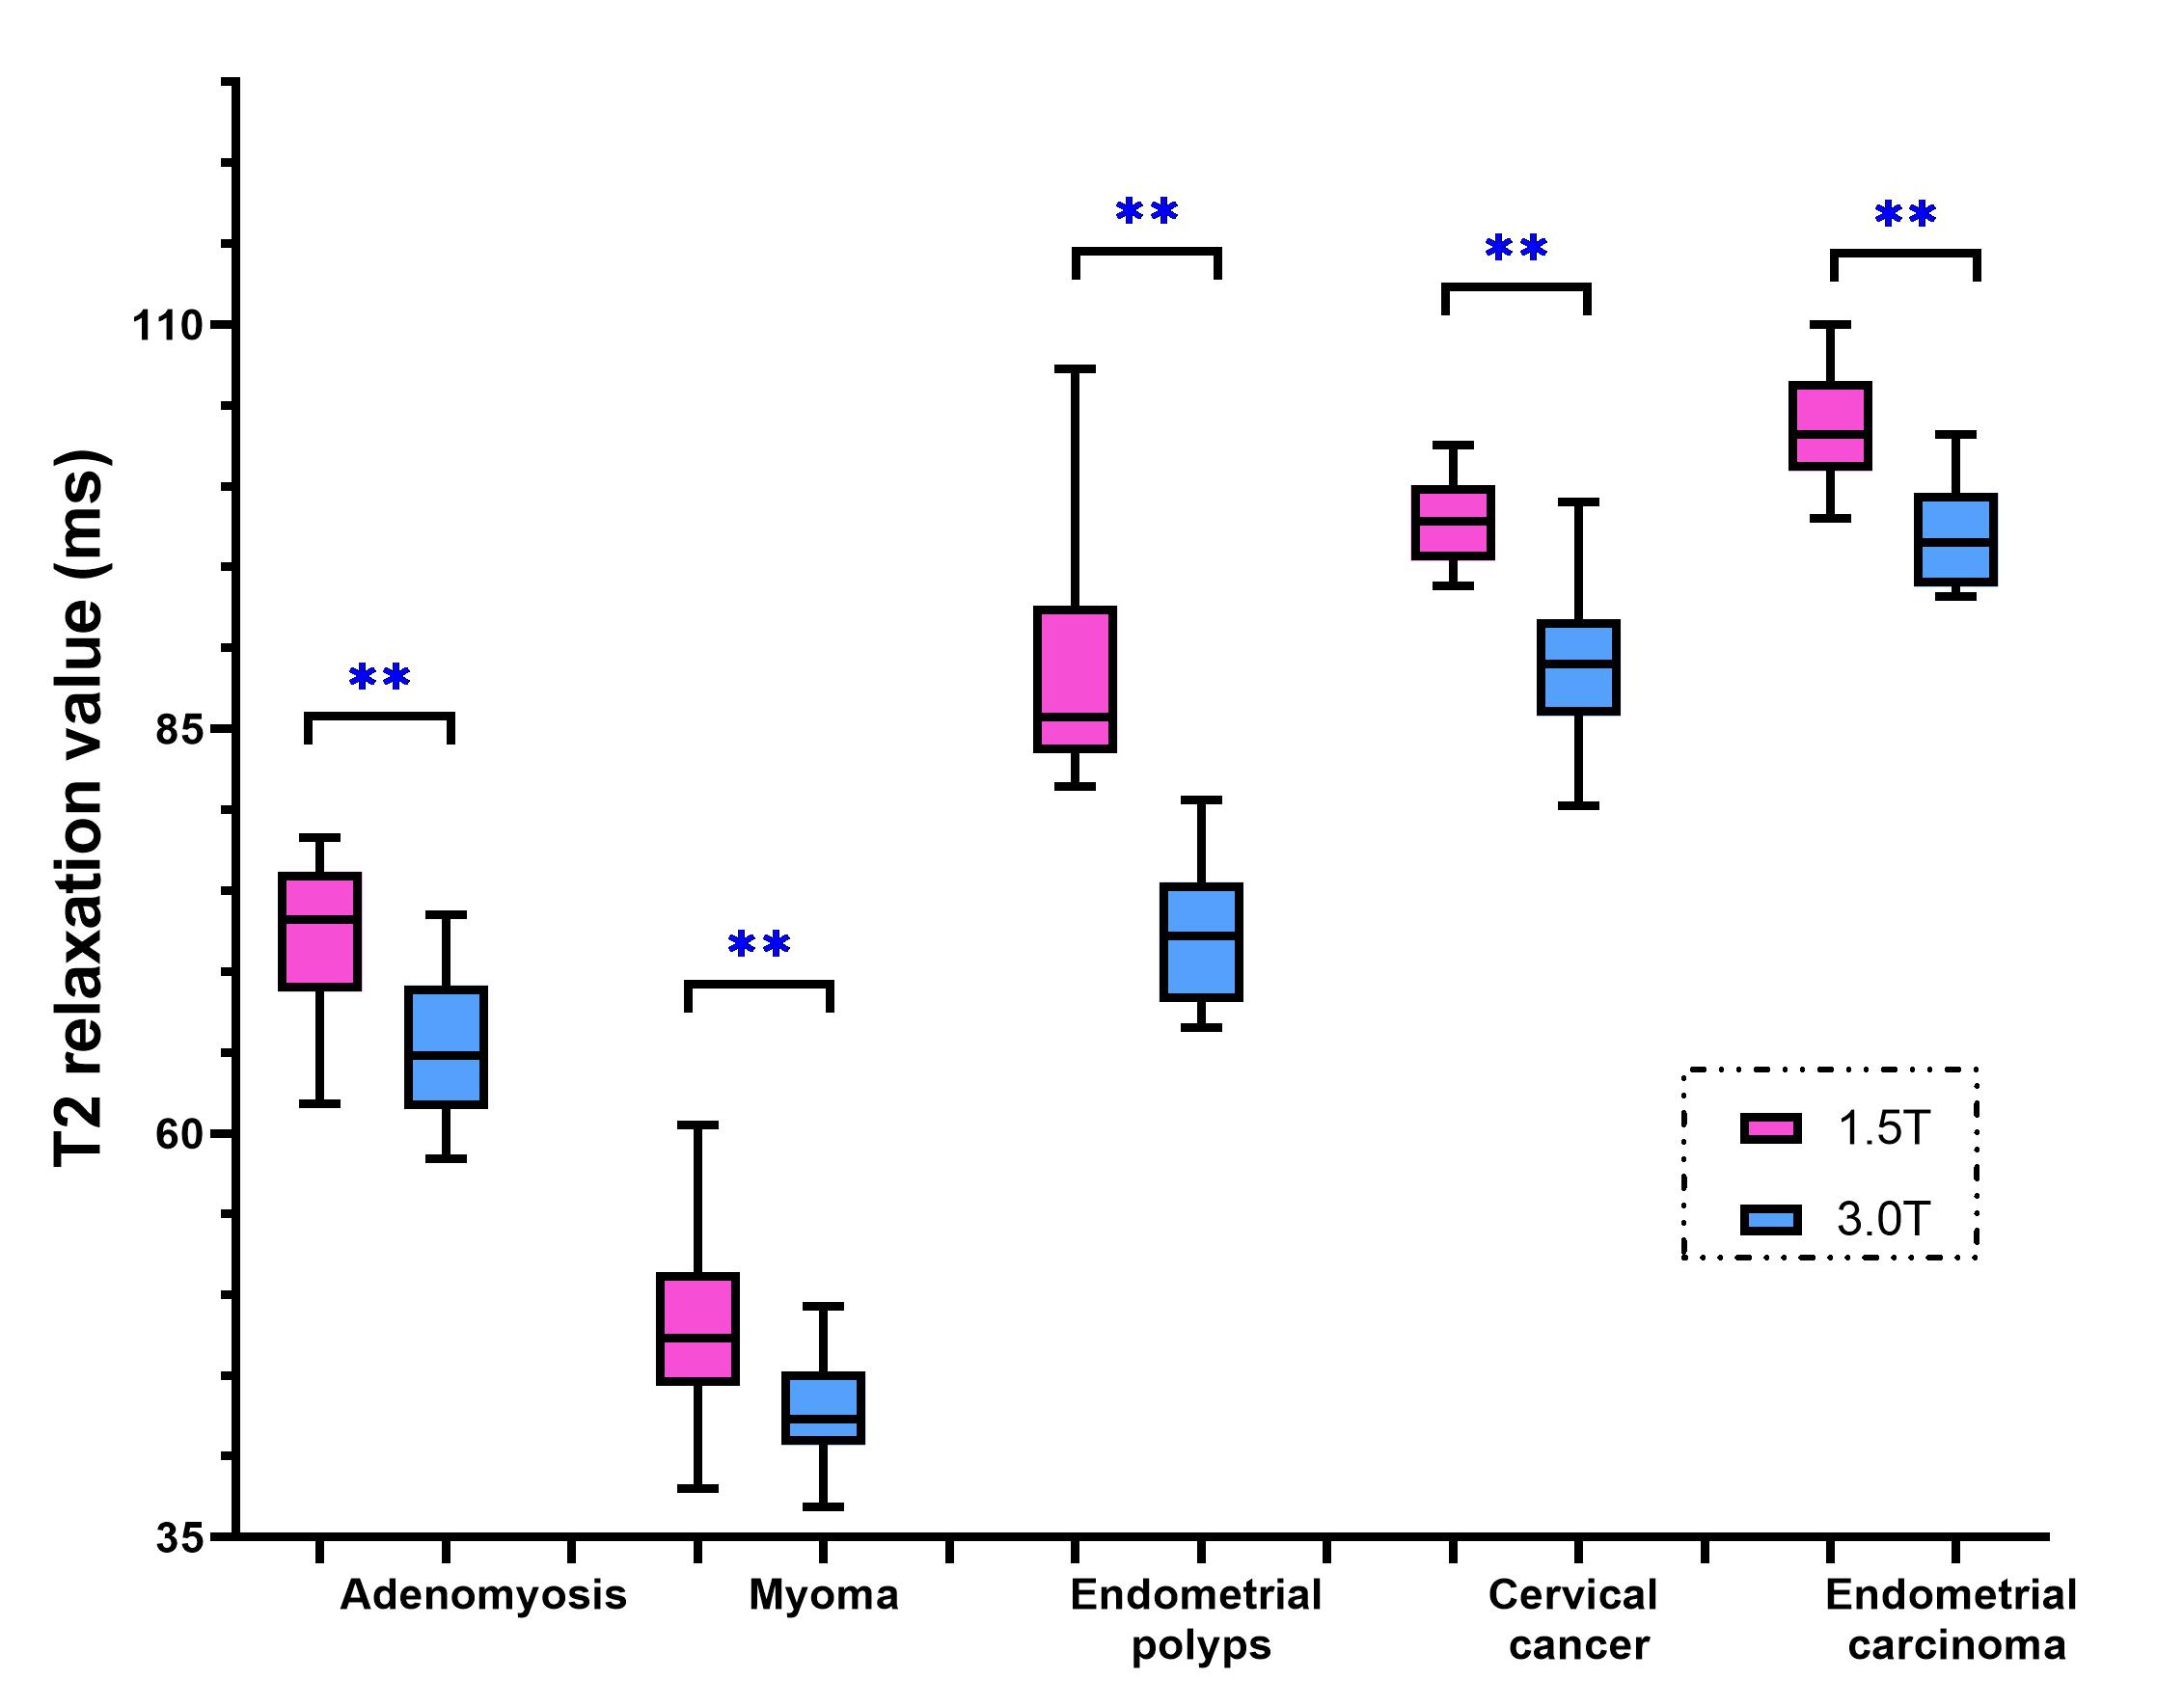
The T2 values of normal tissues, benign and malignant lesions under 1.5T MRI were significantly higher than those under 3.0T MRI (p < 0.05, Figure 1 and 2). The T2 value of benign lesions (63.50 ± 18.35 ms for 1.5T, 55.23 ± 13.45 ms for 3.0T) was significantly lower than those of malignant lesions (100.39 ± 4.30 ms for 1.5T, 92.60 ± 6.04 ms for 3.0T) under both 1.5T and 3.0T MRI (p < 0.05, Table 1). And the ROC analysis showed that the AUC and specificity of T2 value under 3.0T in differentiating benign and malignant lesions were higher than those under 1.5T MRI.Discussion
In this study, we found that T2 values of normal tissues at 3.0T were lower than those at 1.5T (Figure 1), which was in line with the principle that T2 value decreased as field strength increased. The T2 value of endometrial carcinoma was the highest, followed by cervical cancer, submucosal polyps and adenomyosis lesions, while the T2 value of myoma was the lowest. The T2 value of normal endometrium was high. Endometrial carcinoma was composed of a group of epithelial malignant tumors derived from endometrium, which explained the high T2 value of endometrial carcinoma. Cervical cancer derived from abnormal hyperplasia and poorly differentiated cells, whose T2 value was second to endometrial carcinoma. Endometrial polyp was aroused by focal excessive hyperplasia of endometrium. It was composed by some dense fibrous tissue, thick blood vessels and endometrial glands, which determined the T2 value. Adenomyosis was caused by endometrial glands and stroma invading into the myometrium, which accompanied with old hemorrhage in general. Therefore, the T2 value of adenomyosis integrates the T2 value of endometrial gland, stroma, myometrium and old hemorrhage. In this study, the T2 value of adenomyosis at 1.5T was 72.20 ± 4.79 ms, which was slightly lower than that of extra-myometrium layer (78.96 ± 6.82 ms). Myoma was mainly formed by the proliferation of smooth muscle cells and some fibrous connective tissue, which mainly determined its T2 value. In our study, the T2 value of myoma (47.92 ± 4.86 ms) was slightly lower than that of gluteus maximus (51.46 ± 4.98 ms), which was consistent with its composition. In our study, the T2 value of benign tumors was significantly lower than that of malignant tumors, which can be explained by the composition of tumors.Conclusion
T2 mapping technique provides quantitative measurements of normal uterine tissues, benign and malignant lesions under different field strengths, and can be applied to distinguish the differences between benign and malignant tumors, offering a new imaging tool for the quantitative study of uterine tumors.Acknowledgements
No acknowledgement found.References
[1]. ChenW, Zheng R,Baade PD, et al. Cancer statistics in China 2015. CA Cancer J Clin, 2016, 66(2): 115-132.
[2]. Siegel RL,Miller KD,Jemal A. Cancer statistics 2016. CA Cancer J Clin, 2016, 66(1): 7-30.
[3]. Fasmer KE,Bjomemd A,Ytre-Hauge S, et al. Preoperative quantitative dynamic contrast-enhanced MIU and diffusion-weighted imaging predict aggressive disease in endometrial cancer. Acta Radiol, 2018, 59(8):1010-1017.
[4] Ghosh A, Singh T, Bagga R, et al. T2 relaxometry mapping in demonstrating layered uterine architecture: parameter optimization and utility in endometrial carcinoma and adenomyosis: a feasibility study. Br J Radiol, 2018; 91: 20170377.
Figures