0759
Prediction of prognosis after definitive radiotherapy for uterine cervical cancer using changes of ADC histogram during the clinical course1Radiology, Department of Radiology, Chiba University Hospital, Chiba, Japan, 2Radiology, Department of Diagnostic Radiology and Radiation Oncology, Graduate School of Medicine, Chiba University, Chiba, Japan, 3Obstetrics and gynecology, Department of Reproductive Medicine, Graduate School of Medicine, Chiba University, Chiba, Japan
Synopsis
To realize precision medicine for cervical cancer, it is essential to predict the prognosis. We focused on changes in ADC histogram during the clinical course. Sixty-eight patients were included and they underwent MRI evaluation 4 times during the clinical course. Imaging features were extracted from the ADC histogram in the whole tumor VOI and their change rates were calculated. The change rates of kurtosis between the first and third, and between the first and second imaging could predict recurrence with high AUCs (0.90 and 0.83). By predicting the prognosis early during clinical course, a more personalized treatment can be provided.
INTRODUCTION
In recent years, various treatment methods have been developed to realize precision medicine for uterine cervical cancer (CC). Among them, 3D image-guided brachytherapy (IGBT) has made it possible to perform more individualized treatments such as dose-distribution control according to the shape of individual tumors and dose adjustment according to the risk of recurrence. Therefore, it is essential to predict the prognosis of CC.In recent studies of prognosis prediction using MRI images for CC, ADC values of the tumor have been reported as a significant predictor1,2), but few studies have focused on changes in ADC histogram during the clinical course. We hypothesized that the prognosis could be predicted more accurately by using the ADC change during the clinical course.
The purpose of this study was to investigate whether imaging features of ADC histogram and their changes during the clinical course could predict the prognosis in patients treated with definitive radiotherapy for cervical cancer.
METHODS
Patient cohort and treatmentOne hundred and twenty-five patients who underwent IGBT for CC between June 2015 and October 2019 at our institution were enrolled. All patients underwent MR imaging evaluation 4 times during the clinical course: before the start of treatment, just before the start of IGBT, at the end of External beam radiotherapy (EBRT), and 2-3 months after the end of treatment. The standard treatment method for CC at our institute is as shown in figure 1.
The following inclusion criteria were applied: (a) patients who underwent a 3T MRI (Ingenia, Philips Medical Systems, Best, Netherland) at least once during the clinical course, (b) primary tumors could be identified in the pretreatment MRI, and 68 patients were finally included (nall=68).
MRI acquisition and imaging processing
We only included MR images taken by 3T MRI (Ingenia, Philips). The imaging parameters are as shown in Figure 1, and the numbers of MR images available are shown in Figure 2. The entire tumor was set as the volume of interest (VOI) in the axial images of the ADC map with the consensus of two radiologists. Cystic, fibrotic, and necrotic portions in the tumor were excluded. If no residual tumor was observed after treatment, the VOI was placed in the area where the lesion was located at the previous MRI.
Eighteen imaging features were extracted from the ADC histogram in the VOI and the change rates of the features were calculated as follows: [(later feature value – previous feature value)/previous feature value] (Fig.1).
Statistics
Univariate analysis was performed for clinical data such as age, FIGO stage, and pathological type, using Fisher’s exact test and the Mann–Whitney test. We defined the number of patients who had recurrence within 2 years or no recurrence after 2 years of follow-up as "n2year". In patients (=n2year), the recurrence prediction ability of the features and their change rates were evaluated by receiver operating characteristic (ROC) analysis. The presence or absence of recurrence including local and distant within 2 years was set as an outcome. For features and their change rates that had a high AUC in this analysis, the cut-off values were determined from the ROC curve using the Youden index. The calculated cut-off values were applied to 68 cases (=nall) to divide them into two groups. Kaplan-Meier plots of disease-free survival were constructed, and the log-rank test was used for comparison.
RESULTS
Of all cases (nall=68), 21 cases had recurred. A total of 44 had recurrence within 2 years or no recurrence after 2 years of follow-up (n2year=44). Clinical data and the results of the univariate analysis are shown in Figure 3. The pathological type showed a significant difference (p=0.0028), and adenocarcinoma recurred more frequently than the other types.As a result of ROC analysis in 44 cases(=n2year), the AUCs of the change rates in kurtosis between the first and third imaging (change of kurtosis 1 to 3) and between the first and second imaging (change of kurtosis 1 to 2) were the best and the second-best (0.90 and 0.83) (Fig.4). For two change rates (change of kurtosis 1 to 3 and 1 to 2), we determined the cut-off values. The cut-off values were -0.37 and -0.034, respectively. These cut-off values were applied in 68 cases (=nall) to create Kaplan-Meier plots (Fig.5). The p-values from the log-rank test were 0.022 and 0.0034.
DISCUSSION
The predictive power of the change of kurtosis 1 to 3 and 1 to 2 was exceedingly high, and kurtosis tended to decrease during the clinical course in the recurrence group. The previous study using pretreatment MRI for CC reported that the group with higher pretreatment kurtosis was significantly more responsive to chemotherapy2), but another study reported that the prognosis prediction ability of kurtosis in pretreatment MRI alone was low4,5). Although it is difficult to speculate what the decline in kurtosis reflects pathologically, the decrease in ADC kurtosis during the clinical course may reflect heterogeneous therapeutic effects within the tumor.CONCLUSION
The change rate of kurtosis in ADC histogram during the clinical course was useful for predicting the prognosis after definitive chemoradiotherapy for CC. By predicting the risk of a recurrence early during treatment, a more personalized treatment can be provided.Acknowledgements
No acknowledgement found.References
- Gurcan Erbay, Cem Onal, Elif Karadeli, et al. Predicting tumor recurrence in patients with cervical carcinoma treated with definitive chemoradiotherapy: value of quantitative histogram analysis on diffusion-weighted MR images. Acta Radiologica. 2017;58(4):481-488
- Jie Meng, Lijing Zhu, Li Zhu, et al. Whole-lesion ADC histogram and texture analysis in predicting recurrence of cervical cancer treated with CCRT. Oncotarget. 2017;8(54): 92442-92453
- Shinsuke Hanawa, Akira Mitsuhashi, Hirokazu Usui, et al. Daily low-dose Cisplatin-based concurrent chemoradiotherapy for the treatment of cervical cancer in patients 70 years or older. Int J Gynecol Cancer. 2015;25(5):891-896.
- Maria Ciolina, Valeria Vinci, Laura Villani, et al. Texture analysis versus conventional MRI prognostic factors in predicting tumor response to neoadjuvant chemotherapy in patients with locally advanced cancer of the uterine cervix. La radiologia medica. 2019;124:955–964
- Kyo-won Gu, Chan Kyo Kim, Chel Hun Choi et al. Prognostic value of ADC quantification for clinical outcome in uterine cervical cancer treated with concurrent chemoradiotherapy. European Radiology. 2019;29:6236–6244
Figures
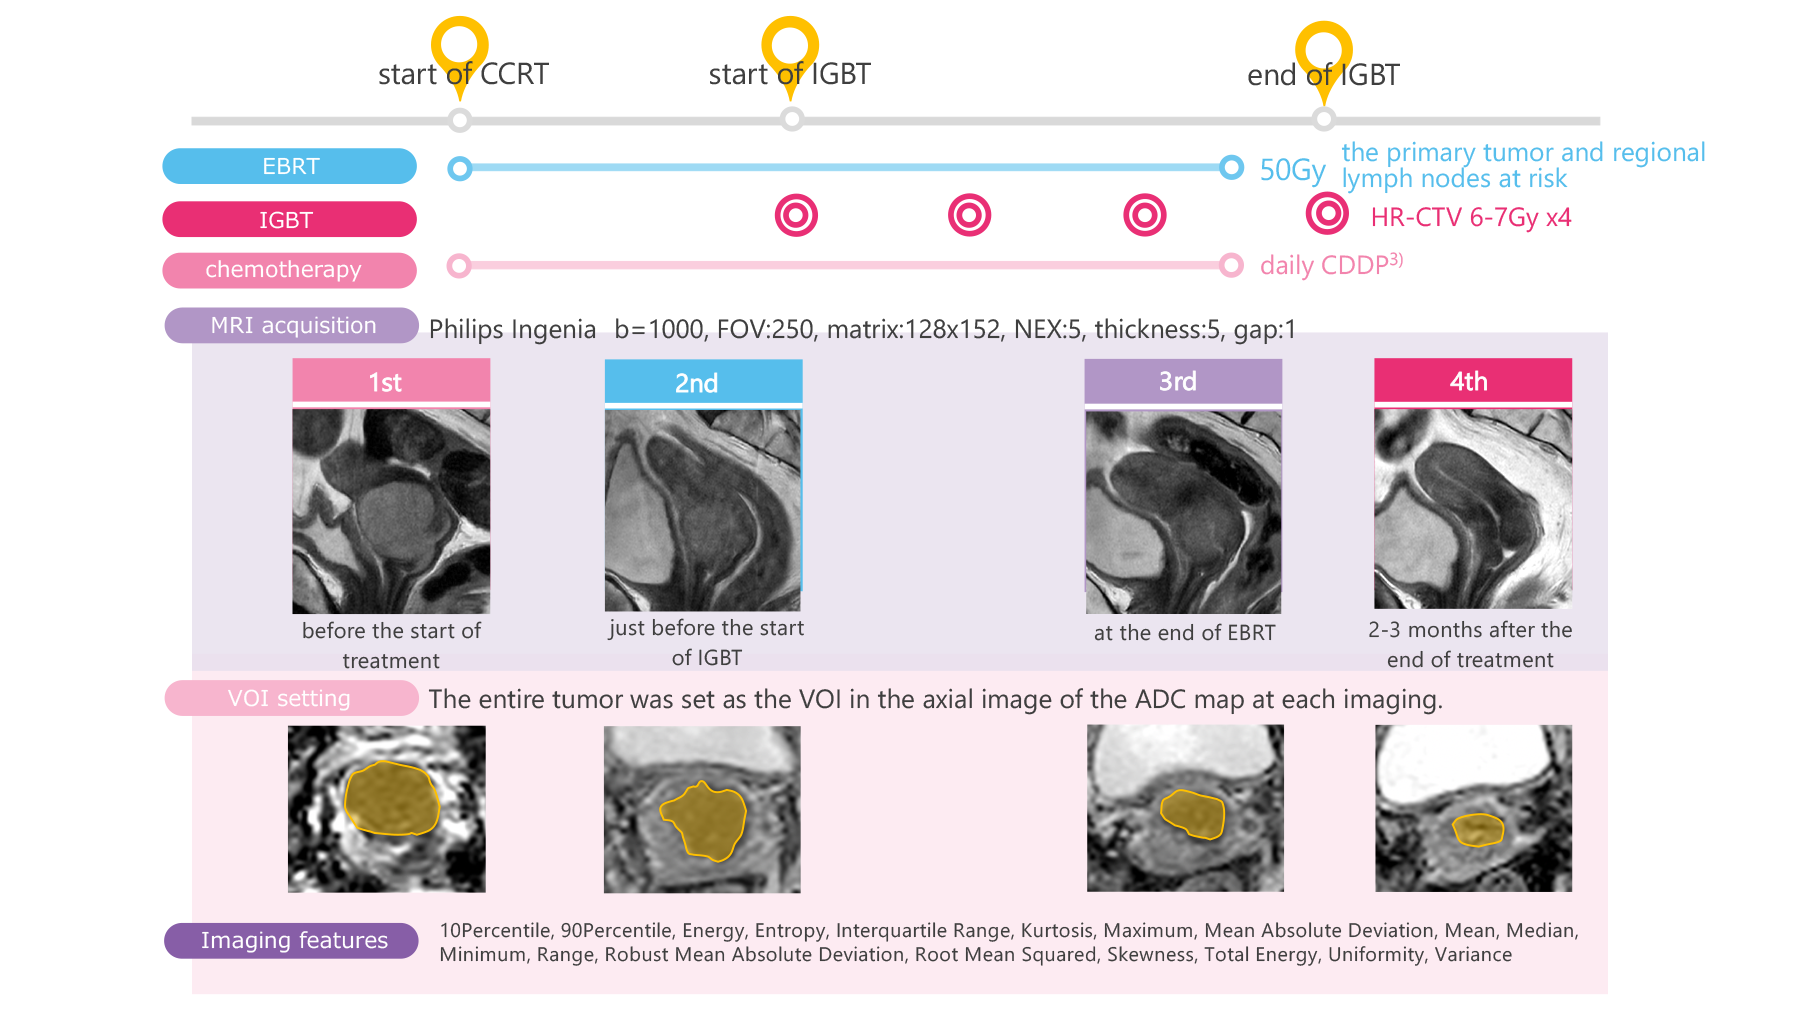
Fig.1 Treatment course and MRI acquisition
The treatment schedule and the timing of MRI acquisition are shown.MRI examinations with DWI were performed a total of 4 times during the clinical course: before the start of treatment, just before the start of IGBT, at the end of EBRT, and 2-3 months after the end of treatment. The entire tumor was set as the VOI in the axial images of the ADC map. Eighteen histogram features were extracted from each VOI.
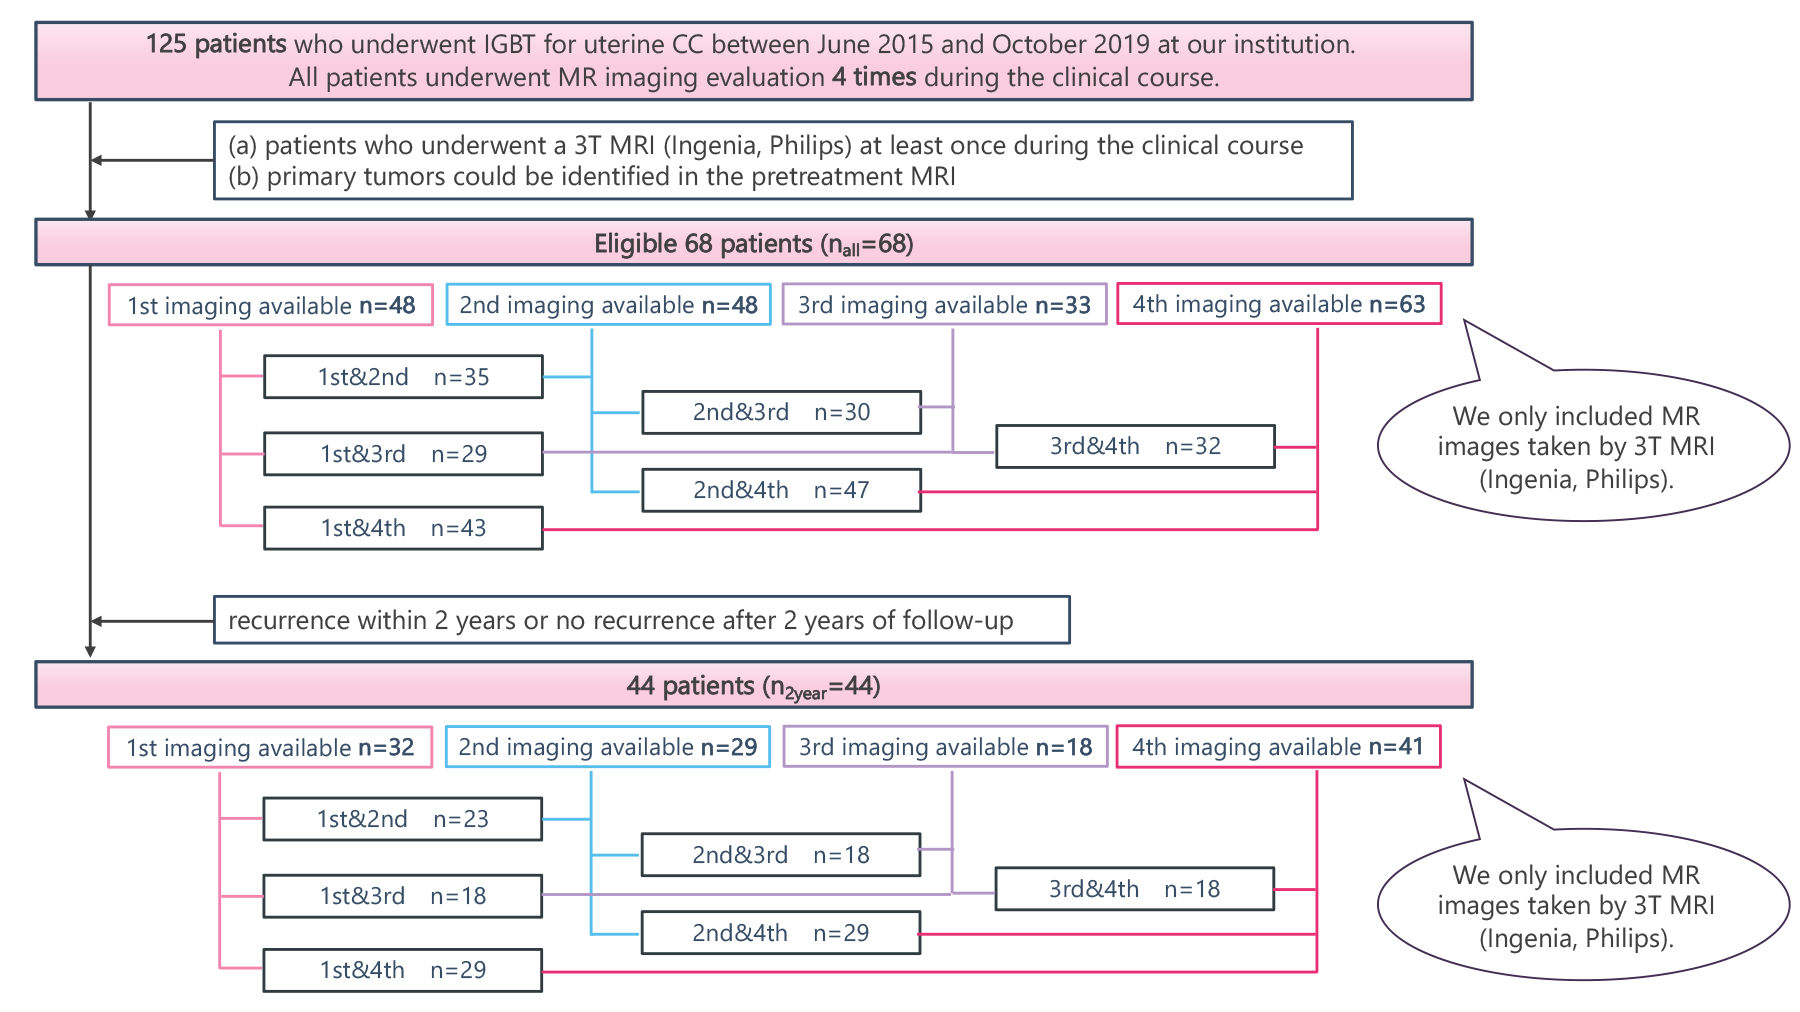
Fig.2 The number of patients and MR images available
The number of MRIs at each timing (1st-4th) and the number of MRIs available for calculating the change rate are shown for nall and n2year.
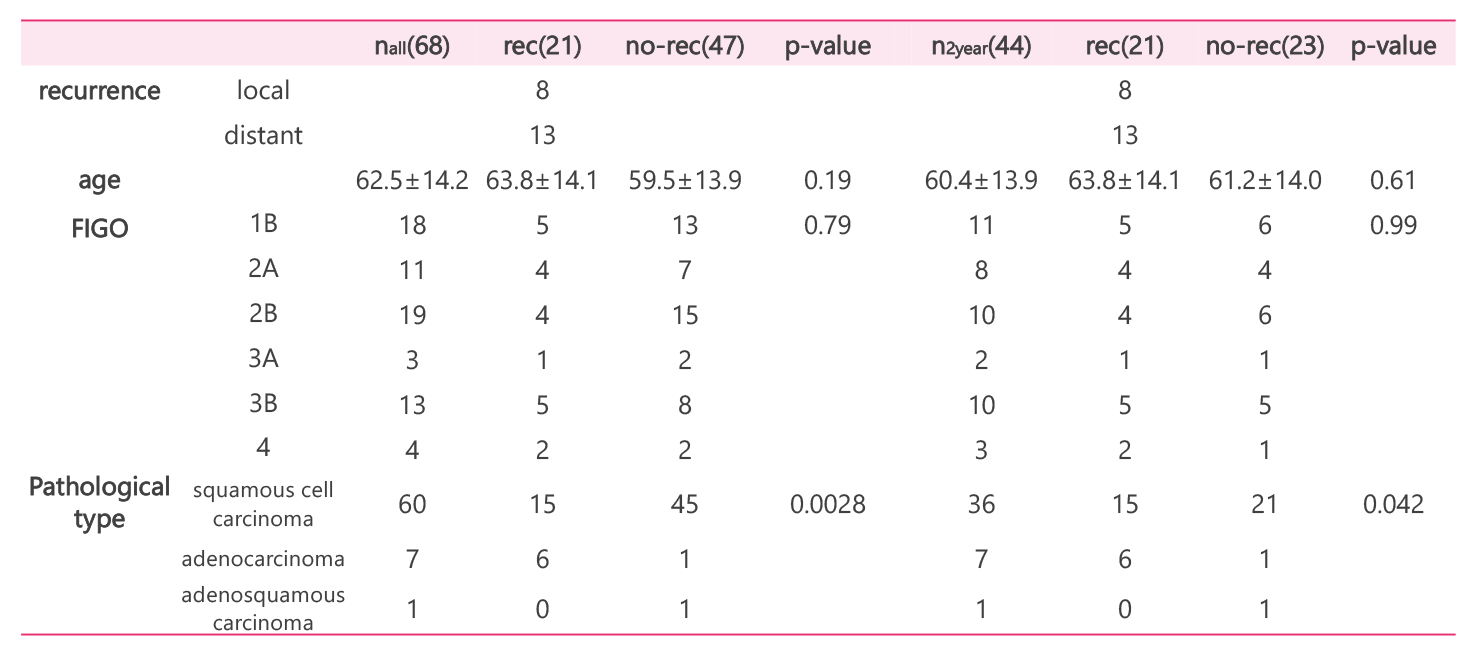
Fig.3 Patients’ clinical characteristics
Clinical data and the results of the univariate analysis are shown in the Table. Pathological type showed a significant difference. There was no significant difference in age and FIGO stage.
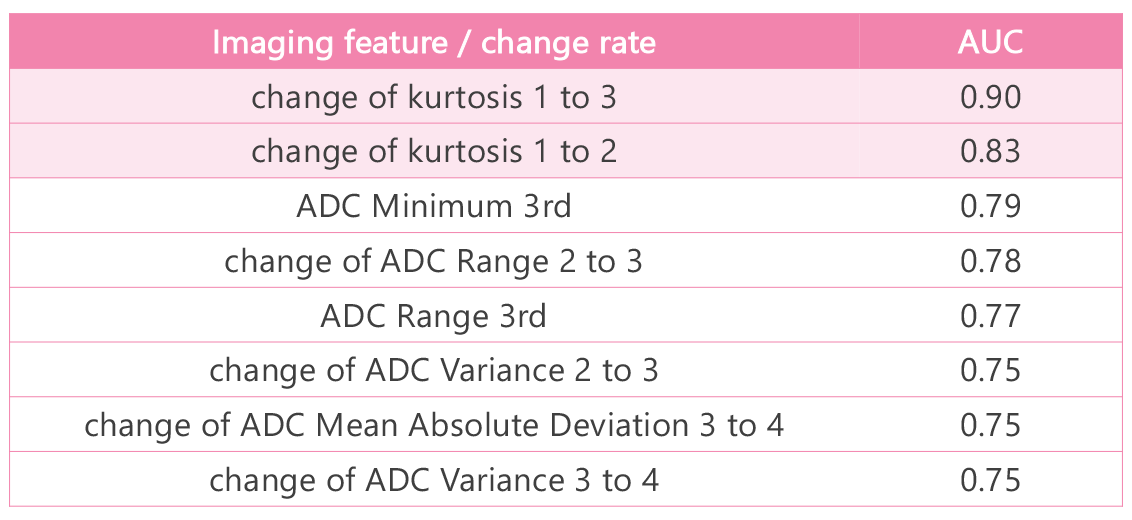
Fig.4 The imaging features and change rates with high AUC
The AUCs of the change rates in kurtosis between the first and third imaging (change of kurtosis 1 to 3) and between the first and second imaging (change of kurtosis 1 to 2) were the best and the second-best.
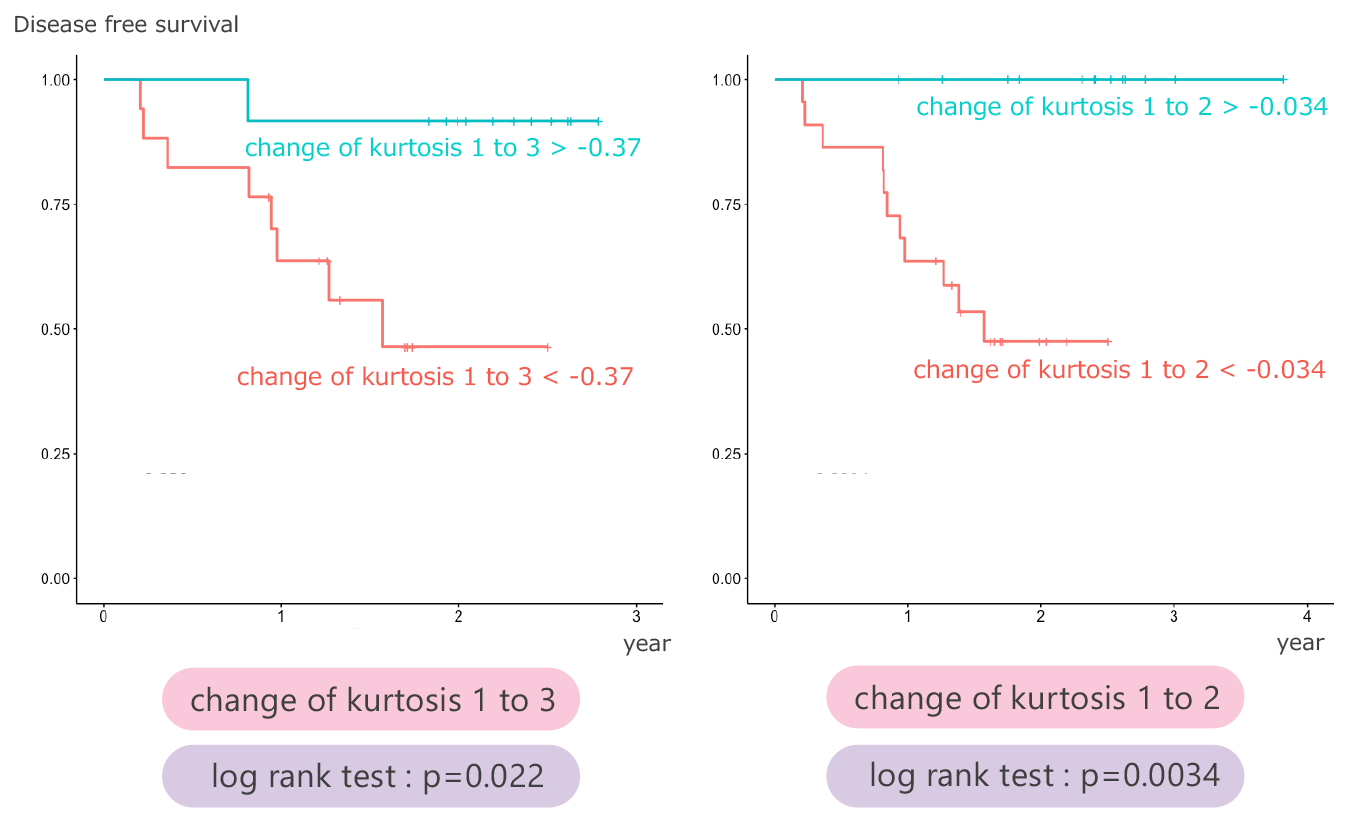
Fig.5 Kaplan-Meier plot and the p-values
Kaplan-Meier plot and the p-values from the log-rank test on disease-free survival. Kurtosis change can divide between better and worth prognosis groups.