0758
Differential diagnosis of cervical adenocarcinoma and squamous carcinoma by using multiple parameters of Enhanced T2* -Weighted Angiography1The First Affiliated Hospital of Dalian Medical University, Dalian, China
Synopsis
The aim of this study was to explore the value of multiple quantitative parameters of enhanced T2 star-weighted angiography (ESWAN) in differentiating cervical adenocarcinoma (CA) from Squamous cell carcinoma (SCC). The areas under the ROC curve of amplitude, R2* and T2* in US group were 0.729, 0.851 and 0.843, respectively, promising to be a valuable diagnostic method for differentiation CA from SCC.
Introduction
Cervical cancer is the fourth most frequently diagnosed cancer and the fourth leading cause of cancer death in women [1]. The prognosis of cervical cancer is closely associated with the pathology type and the differentiation grade. Cervical adenocarcinoma (CA) is more aggressive and is associated with a poor prognosis [2]. Studies have shown that the 5-year survival rate of CA is approximately 10%-20% lower than that of cervical squamous cell carcinoma (SCC) [3]. Enhanced T2 star-weighted angiography (ESWAN) is a recently-developed and based on magnetic susceptibility weighted imaging (SWI) technology. SWI is a promising technique for depicting hemorrhage, calcification and increased vascularity, which have been applied to differential diagnosis of benign and malignant abdominal tumors originating from the liver, spleen and kidney [4]. We hypothesize that it’s practicable to differentiating CA from SCC by multiple quantitative parameters of ESWAN.Methods
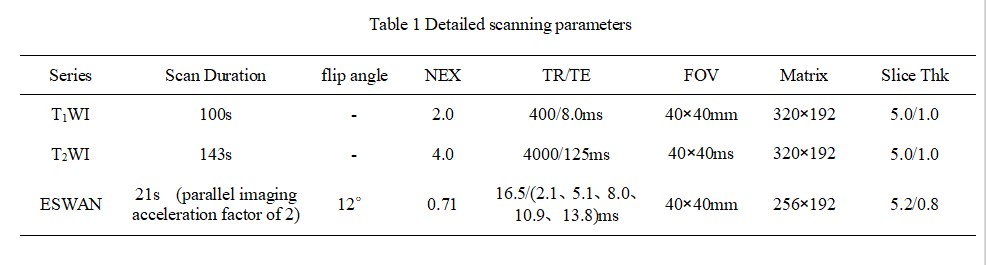
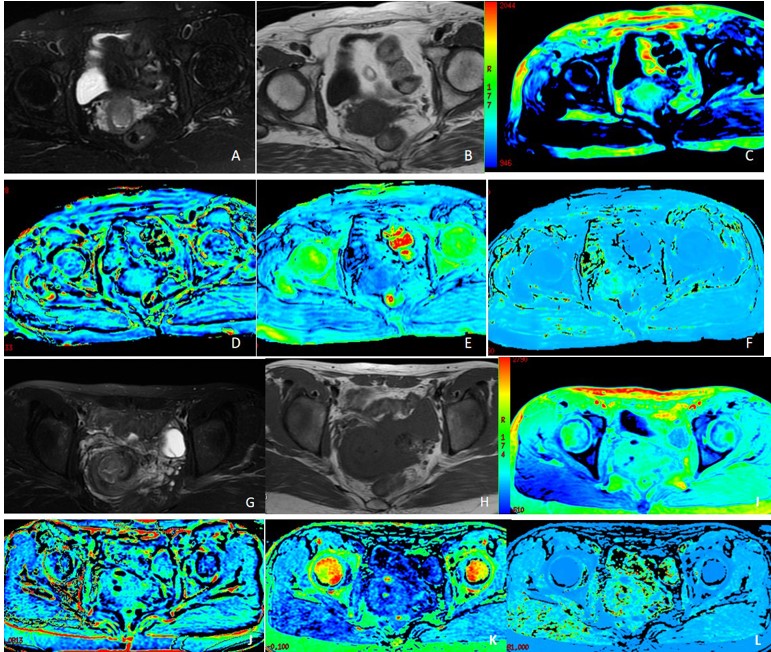
From April 2014 to December 2019, 26 patients in our hospital who were pathologically confirmed as CA (56.77 ± 10.83) years old, 52 patients in our hospital who were pathologically confirmed as SCC (52.19 ± 10.34) years old. All patients underwent 1.5 T MR scanner preoperatively (Signa HDxt, GE Medical Systems, USA) on T1WI, T2WI and 3D gradient echo (GRE) ESWAN sequence. Detailed MR scanning parameters were shown in Table 1. All images on ESWAN sequence were transferred to the GE AW 4.6 workstation for post-processing in Functool software. Amplitude, phase, R2* and T2* maps were obtained. Three ROIs were drawn on tumor maximal axial section (avoiding cystic and necrotic regions) on three continuous section. The sizes of ROIs were defifined depending on the shape and size of tumor [5], at least one third of the tumor parenchyma. All statistic analyses were analyzed by SPSS 25.0 software. Normal distribution was tested by Kolmogorov-Smirnov test. Amplitude, phase, R2* and T2* values between CA and SCC group were compared using Mann-Whitney U test. Receiver operating characteristic (ROC) analysis was performed to evaluate diagnostic performance.Results
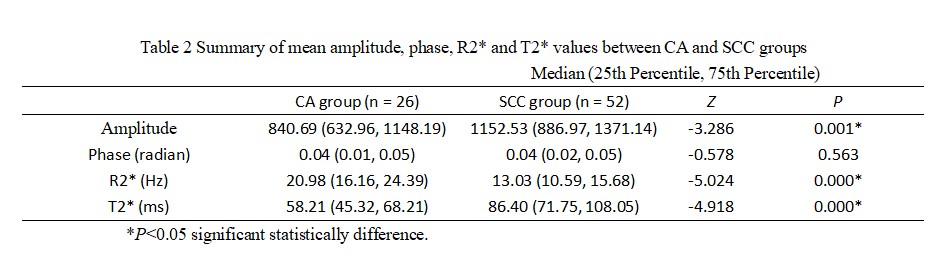
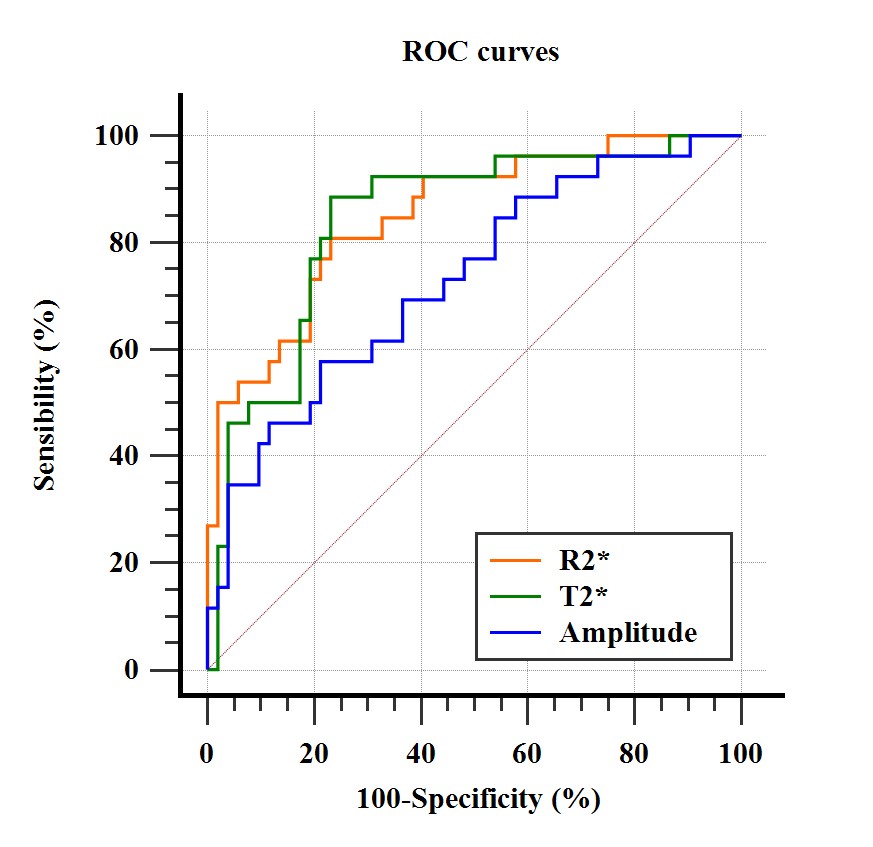
The R2* [20.98 (16.16, 24.39)Hz ] in CA group were significantly bigger than that in SCC group [13.03 (10.59, 15.68)Hz ], but the value of amplitude was smaller than that in SCC group [840.69 (632.96, 1148.19) vs. 1152.53 (886.97, 1371.14)], with statistical significance (P < 0.05) (Figure 1). There was no statistical significance in difference in phase value between the two groups (P > 0.05) (Table 2). The areas under the ROC curve of amplitude, R2* and T2* in CA group were 0.729, 0.851 and 0.843, respectively (Figure 2).Discussion
This study showed that the amplitude value, R2* and T2* values could differentiate CA from SCC availably. The R2* value has a direct relation to the tissue deoxygenated hemoglobin concentration and can be used to quantitatively assess changes of oxygen content in local tissue [6]. R2* value is the reciprocal of T2* value, and a high R2* value indicates a lower oxygen, an increase in deoxygenated hemoglobin, and a decrease in MR signal [4]. The amplitude diagram focuses on the contrast of signal intensity between tissues and can show the characteristics of different tissues clearly.Conclusion
In the present study, we suggested that the amplitude value, R2* and T2* values could differentiate CA from SCC availably.Acknowledgements
Thanks sincerely to my dear tutor and all my group parterns.References
[1] Zheng, C., Qing, S., Wang, J., Lü, G., Li, H., Lü, X., Ma, C., Tang, J., & Yue, X. Diagnosis of cervical squamous cell carcinoma and cervical adenocarcinoma based on Raman spectroscopy and support vector machine. Photodiagnosis and photodynamic therapy, 2019;27:156-161.
[2] Noh, J. M., Park, W., Kim, Y. S., Kim, J. Y., Kim, H. J., Kim, J., Kim, J. H., Yoon, M. S., Choi, J. H., Yoon, W. S., Kim, J. Y., & Huh, S. J. Comparison of clinical outcomes of adenocarcinoma and adenosquamous carcinoma in uterine cervical cancer patients receiving surgical resection followed by radiotherapy: a multicenter retrospective study (KROG 13-10). Gynecologic oncology, 2014;132(3): 618-623.
[3] Meng, N., Wang, J., Sun, J., Liu, W., Wang, X., Yan, M., Dwivedi, A., Zheng, D., Wang, K., & Han, D. (2019). Using amide proton transfer to identify cervical squamous carcinoma/adenocarcinoma and evaluate its differentiation grade. Magnetic resonance imaging, 2019;61:9-15.
[4] Xin, J. Y., Gao, S. S., Liu, J. G., et al. The value of ESWAN in diagnosis and differential diagnosis of prostate cancer: Preliminary study. Magnetic resonance imaging, 2017;12(44), 26-31.
[5] Li, B., Xu, A., Huang, Y., et al. Oxygen-Challenge Blood Oxygen Level-Dependent Magnetic Resonance Imaging for Evaluation of Early Change of Hepatocellular Carcinoma to Chemoembolization: A Feasibility Study. [published online ahead of print, 2020 Jul 31]. Acad Radiol. 2020;S1076-6332(20)30371-8.
[6] Han, X., Sun M. Y., Wang, M. Y., et al. The enhanced T2*-star weighted angiography (ESWAN) value for differentiating borderline from malignant epithelial ovarian tumors[J]. European Journal of Radiology, 2019, 118:187-193.
Figures