0752
Lipid droplet size mapping in human adipose tissue using a clinical 3 T system1Department of Diagnostic and Interventional Radiology, School of Medicine, Technical University of Munich, Munich, Germany, 2Else Kröner Fresenius Center for Nutritional Medicine, School of Life Sciences, Technical University of Munich, Munich, Germany, 3Institute for Nutritional Medicine, School of Medicine, Technical University of Munich, Munich, Germany, 4Broad Institute of MIT and Harvard, Cambridge, MA, United States, 5Beth Israel Deaconess Medical Center, Boston, MA, United States, 6Harvard Medical School, Harvard University, Boston, MA, United States
Synopsis
Despite its high relevance in metabolic research, the non-invasive measurement of adipocyte size remains an unmet need. DW-MRS has been previously applied to probe diffusion restriction effects in vivo to measure lipid droplets in animals up to diameters of 10 µm and in humans up to diameters of 50 µm. However, DW-MRS suffers from signal loss due to intravoxel-dephasing even when minimal motion is present. This work proposes a novel DW-MRI sequence and diffusion signal processing. In simulations and ex vivo adipose tissue measurements, the presented method results show agreement with ground truth and histology in measuring lipid droplet size.
Purpose
An increase in white adipose tissue (WAT) adipocyte size can be observed with the onset of obesity1,2. WAT adipocyte size is associated with comorbidities of obesity such as type-2-diabetes, dyslipidemia and cardiometabolic risk3. Therefore, the assessment of adipocyte size is highly desirable to identify the patient’s risk to develop obesity-related medical conditions. Currently, however, adipocyte size measurements require invasive biopsy procedures4. Diffusion-weighted (DW) magnetic resonance (MR) is a powerful tool to assess tissue microstructure non-invasively. The reduction of the apparent diffusion coefficient with increasing diffusion times due to diffusion restriction effects has been previously applied to extract cell size in water-containing tissues5. Measuring lipid diffusion properties is challenging because fat has a diffusion coefficient approximately two orders of magnitude lower than water6,7. The slow lipid diffusion increases the required DW, inducing technical challenges related to eddy-currents8 and increased motion sensitivity9. Single-voxel DW-MR spectroscopy (DW-MRS) was recently applied to measure lipid droplets up to a diameter of 10 µm in animals10,11 and up to 50 µm in humans12. However, human WAT consists of larger lipid droplets resulting in smaller measurable diffusion restriction effects. Due to the large voxel size, DW-MRS is sensitive to intra-voxel dephasing effects, which result in quantification errors even when minimal motion is present, limiting in vivo applicability. A high b-value lipid DW imaging (DWI) technique, acquiring data with smaller voxel size, would mitigate this effect and can also consider the voxel neighborhood in the fitting. The purpose of this work was to a) develop a lipid DWI sequence and signal processing pipeline, b) to investigate the noise performance and c) to validate the methodology in ex vivo WAT samples in comparison with histology.Methods
Pulse sequence and post processingA non-selective DW-STE preparation comprising four 90° MLEV RF-pulses13 and mono-polar diffusion gradients was combined with a single-shot 2D TSE readout (Figure 1). To eliminate eddy-current-induced and motion-induced phase errors, magnitude stabilizing gradients were introduced14,15. Data was phase corrected and spatially averaged to increase SNReffective. The lipid droplet size can be estimated based on DW signals12 by minimizing the function C:
$$C=\left\|S_0\;S_{MurdayCotts}(d,D)\;exp(-\frac{TM}{T1})-S_{exp}\right\|\;\;\;\;\;[1]$$
where S0: signal without DW, SMurday&Cotts: theoretical DW signal16, d: restricting barrier’s diameter, D: free diffusion constant, TM: DW-STE preparation’s mixing time, T1: longitudinal relaxation constant and Sexp: measured signal. To avoid local minima, fitting was performed with multiple initial starting values (i). The residual resi(r) and the estimated parameters were recorded for each voxel r and the final parameter maps were selected with two methods:
CbV: complex-based spatial averaging with voxel-wise residual minimization
Minima are selected voxel-wise:
$$[d_{CbV}(r),D_{CbV}(r), T1_{CbV}(r),S_{0,CbV}(r)]=\underset{d(r),D(r),T1(r),S_0(r)}{\operatorname{argmin}}{res}_{Cb}(r)\;\;\;\;\;[2]$$
CbR: complex-based spatial averaging with neighborhood-regularized residual minimization
A graph-cut processing17 imposing a small spatial lipid droplet size variation was performed for all voxels jointly. A regularized global cost function18,19 was employed, where rescb(r) replaced the data consistency term and the regularization term was the estimated diameter’s variation in the voxel’s neighborhood N(r):
$$[d_{CbR}(r),D_{CbR}(r),T1_{CbR}(r),S_{0,CbR}(r)]=\underset{d(r),D(r),T1(r),S_0(r)}{\operatorname{argmin}}\sum_r\;{res}_{Cb}(r)+\lambda\sum_{s\in N(r))}\left\|d(r)-d(s)\right\|\;\;\;\;\;[3]$$
The selection of λ followed the discrepancy principle20.
Noise simulation
A reference signal was calculated based on equation 1 with S0: 100, T1: 300 ms, d: 60 µm, D: 8x10⁻⁶ mm2/s and 110 b-value/TM pairs with b-values: 5,000 s/mm2 to 50,000 s/mm2 in 5,000 s/mm2 steps and TMPrep: 200 ms to 700 ms in 50 ms steps. Gaussian noise was added (SNR0: 50). Spatial averaging was simulated by averaging the data within a square window (1-11 voxels edge length). The averaged signal was fitted by CbV (repeated 1089 times). Afterwards, the noise samples were rearranged to a 33x33 voxels 2D-slice which was processed by CbR.
MR measurements
Ten subcutaneous WAT specimens were obtained from patients undergoing abdominoplasty and samples were extracted for histology. The remaining 10x10x5cm3 specimens were scanned on a 3T scanner (Ingenia Elition, Philips Healthcare) using an 8-channel extremity coil with FOV: (120x120) mm2, voxel size: (1.9x1.9x8) mm3, TR/TE/TEPrep: 2000/18.5/62 ms, 4 averages, spatially averaging: 6x6 voxels, b-value/TM values as in simulation, duration: 14:56 min. To minimize vibrations, a wooden table was utilized21.
Results
The simulated 2D histogram (Figure 3) shows a broad distribution for diameter and free diffusion constant estimates. The diameter estimation’s standard deviation (SD) was reduced with increasing SNReffective and even further with CbR compared to CbV. At high SNReffective (500), quantification biases were observed with CbV (3.9%) but were smaller with CbR (1.7%). In Figure 4, sample 1 shows smaller adipocyte sizes in histology and two distinct lipid droplet size peaks with CbV. With CbR, droplet size outliers were not observed. In sample 2, larger diameters and a better intra-method agreement was observed. Figure 5 shows that the MR-based method with CbR correlate significantly with histology (R2/p: 0.531/0.017).Discussion & Conclusion
The small diffusion restriction effects in WAT could explain the simulated noise performance in estimating the diameter. CbR compared to CbV not only reduces the SD but also the bias. In specimens, a reasonable agreement was observed between histology and the MR-based mean lipid droplet size using a clinical 3T system. However, large variations of the MR-based droplet size estimates were reported within the scanned samples. The presented methodology could be considered for replacing the invasive biopsy measurement and the in vivo application of the methodology should be fostered.Acknowledgements
We would like to thank Oliver Gmach and the chair of Chair for Food and Bioprocess Engineering for the preparation and measurement of the water–fat emulsion phantoms and Prof Burgkart for the wooden support table. We would also like to thank Stefanie Winkler for assisting with the adipose tissue sample collection, Cora Held, Lisa Patzelt and Mark Zamskiy for assisting with the adipose tissue sample measurements and Mingming Wu for helpful discussions. The present work was supported by the European Research Council (grant agreement No 677661, ProFatMRI and grant agreement No 875488, FatVirtualBiopsy), Philips Healthcare and the Else Kröner-Fresenius Foundation, Bad Homburg, Germany. This work reflects only the authors view and the funders are not responsible for any use that may be made of the information it contains.References
1. Spalding KL, Arner E, Westermark PO, Bernard S, Buchholz BA, Bergmann O, Blomqvist L, Hoffstedt J, Näslund E, Britton T, Concha H, Hassan M, Rydén M, Frisén J, Arner P. Dynamics of fat cell turnover in humans. Nature 2008;453(7196):783-787.
2. Salans LB, Cushman SW, Weismann RE. Studies of human adipose tissue. Adipose cell size and number in nonobese and obese patients. J Clin Invest 1973;52(4):929-941.
3. Laforest S, Labrecque J, Michaud A, Cianflone K, Tchernof A. Adipocyte size as a determinant of metabolic disease and adipose tissue dysfunction. Critical Reviews in Clinical Laboratory Sciences 2015;52(6):301-313.
4. Laforest S, Michaud A, Paris G, Pelletier M, Vidal H, Géloën A, Tchernof A. Comparative analysis of three human adipocyte size measurement methods and their relevance for cardiometabolic risk. Obesity 2017;25(1):122-131.
5. Assaf Y, Blumenfeld-Katzir T, Yovel Y, Basser PJ. AxCaliber: a method for measuring axon diameter distribution from diffusion MRI. Magn Reson Med 2008;59(6):1347-1354.
6. Lehnert A, Machann J, Helms G, Claussen CD, Schick F. Diffusion characteristics of large molecules assessed by proton MRS on a whole-body MR system. Magn Reson Imaging 2004;22(1):39-46.
7. Steidle G, Eibofner F, Schick F. Quantitative Diffusion Imaging of Adipose Tissue in the Human Lower Leg at 1.5 T. Magnetic Resonance in Medicine 2011;65(4):1119-1125.
8. Jezzard P, Barnett AS, Pierpaoli C. Characterization of and correction for eddy current artifacts in echo planar diffusion imaging. Magn Reson Med 1998;39(5):801-812.
9. Anderson. Analysis and correction of motion artifacts in diffusion weighted imaging. Magn Reson Med 1994;32(3):379-387.
10. Cao P, Fan SJ, Wang AM, Xie VB, Qiao Z, Brittenham GM, Wu EX. Diffusion magnetic resonance monitors intramyocellular lipid droplet size in vivo. Magn Reson Med 2015;73(1):59-69.
11. Verma SK, Nagashima K, Yaligar J, Michael N, Lee SS, Xianfeng T, Gopalan V, Sadananthan SA, Anantharaj R, Velan SS. Differentiating brown and white adipose tissues by high-resolution diffusion NMR spectroscopy. J Lipid Res 2017;58(1):289-298.
12. Weidlich D, Honecker J, Gmach O, Wu M, Burgkart R, Ruschke S, Franz D, Menze BH, Skurk T, Hauner H, Kulozik U, Karampinos DC. Measuring large lipid droplet sizes by probing restricted lipid diffusion effects with diffusion-weighted MRS at 3T. Magn Reson Med 2019;81(6):3427-3439.
13. Tycko R, Cho HM, Schneider E, Pines A. Composite pulses without phase distortion. Journal of Magnetic Resonanc 1985;61(1):90 - 101.
14. Alsop DC. Phase insensitive preparation of single-shot RARE: application to diffusion imaging in humans. Magn Reson Med 1997;38(4):527-533.
15. Van AT, Cervantes B, Kooijman H, Karampinos DC. Analysis of phase error effects in multishot diffusion-prepared turbo spin echo imaging. Quantitative Imaging in Medicine and Surgery 2017;7(2):238-250.
16. Murday JS, Cotts RM. Self-Diffusion Coeffcient of Liquid Lithium. J Chem Phys 1968;48(11):4938-&.
17. Shah A, Abámoff MD, Wu X. Optimal surface segmentation with convex priors in irregularly sampled space. Medical Image Analysis 2019;54:63-75.
18. Boehm CD, M. N.; Haase, A.; Karampinos, D. C. . Accelerated Single-Min-Cut Graph-Cut Algorithm Using a Variable-Layer Graph Construction Improves Field-Mapping in Water–Fat Regions. 2019; Montreal, Canada.
19. Cui C, Shah A, Wu XD, Jacob M. A rapid 3D fat-water decomposition method using globally optimal surface estimation (R-GOOSE). Magnetic Resonance in Medicine 2018;79(4):2401-2407.
20. Engl HWH, M. Neubauer, A. Regularization of Inverse Problems: Springer Netherlands; 2000. 322 p.
21. Weidlich D, Zamskiy M, Maeder M, Ruschke S, Marburg S, Karampinos DC. Reduction of vibration-induced signal loss by matching mechanical vibrational states: Application in high b-value diffusion-weighted MRS. Magnetic Resonance in Medicine 2020;84(1):39-51.
Figures
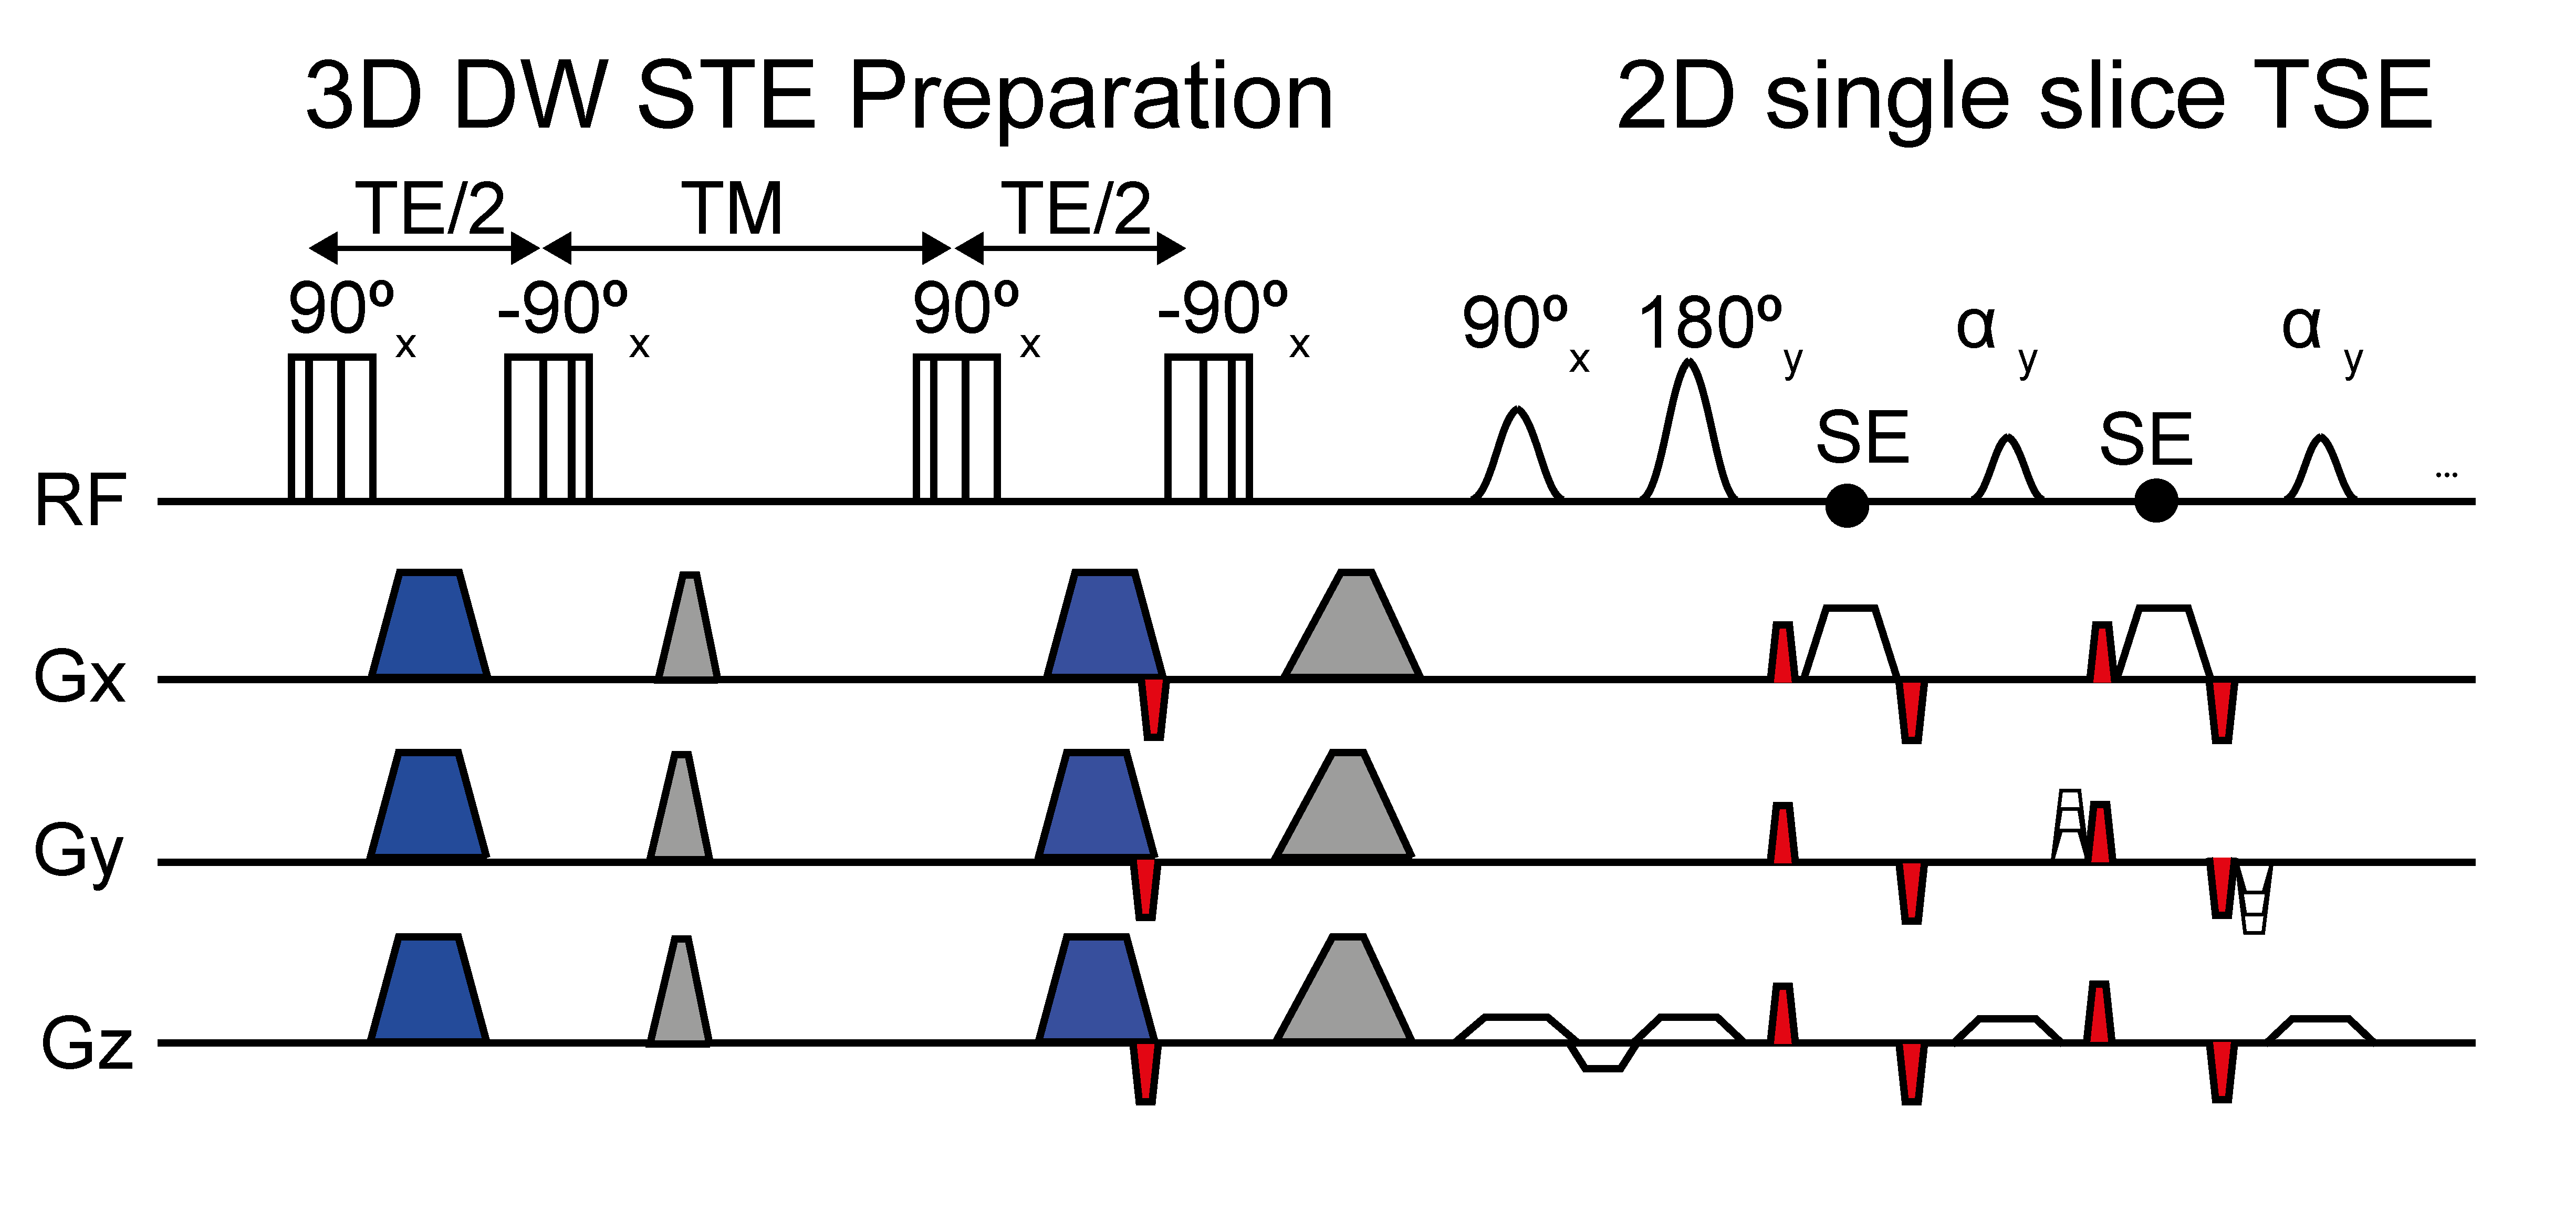
Figure 1:
Sequence diagram of the proposed DW STE-prepared single-shot 2D TSE. The diffusion weighted DW-STE magnetization preparation comprises four composite 90° RF pulse and mono-polar diffusion sensitizing gradients (blue). To eliminate eddy current- and motion-induced phase errors an additional pair of de-/rephasing gradients (indicated in red) denoted as magnitude stabilizers are introduced before the last tip-up pulse and immediately before and after every spin echo formation. The spoiler gradients within the magnetization preparation are indicated in grey.

Figure 2:
Overview fitting process. Data is acquired with different diffusion times (Δ - rows) and diffusion weightings (b-value - diagonal dimension). First, the complex data is phase corrected and then spatially averaged to increase SNReffective. All data is pooled and a voxel-wise fitting is performed with different initial starting values which result in different parameter estimates. Taking the voxel-wise estimate with lowest residual leads to the CbV processing (blue). Additionally imposing a spatially slowly varying lipid droplet size leads to the CbR processing (green).

Figure 3:
Noise performance of the lipid droplet size estimation in the adipose tissue sample case (true diameter: 60 µm). In the 2D histogram a rather broad width for the droplet diameter and free diffusion constant estimates can be observed. The histogram width and the SD in the mean diameter estimation decrease with increasing SNReffective and is further reduced by CbR processing. At high SNReffective (by spatial averaging) quantification biases can be observed. At a SNReffective of 500, the deviation from the true diameter is 3.9% (CbV) and 1.7% (CbR).

Figure 4:
Histology slides, CbV-based and CbR-based diameter maps and corresponding histograms for two adipose tissue samples. Adipose tissue sample 1 shows smaller adipocytes compared to adipose tissue sample 2. The SD is decreased with the CbR compared to the CbV processing (compare the distribution broadness in the diameter histograms).

Figure 5:
Correlation analysis of the mean droplet diameter obtained with CbR processing compared to microscopy in the white adipose tissue sample study. A significant correlation was found when comparing the mean adipocyte size (R2/p: 0.531/0.018) obtained by both methods although a large uncertainty was found in the size estimation of the MR-based method. Mean values ±1 standard deviation (error bar) are shown.