0743
Assessing breast density using the standardized proton density fat fraction based on chemical shift encoding-based water-fat separation1Department of Diagnostic and Interventional Radiology, Technical University of Munich, Munich, Germany, 2Philips Healthcare, Hamburg, Germany
Synopsis
Breast density is confirmed as a strong, independent risk factor of breast cancer which is why there is a clinical need for a robust, reader-independent, non-ionizing, quantitative assessment of breast density. This retrospective study proposes the proton density fat fraction (PDFF) derived from chemical shift encoding-based water-fat separation as a novel quantitative MRI biomarker of breast density. As a clinically highly practicable biomarker that is automatedly obtainable and insensitive to acquisition parameters and the partial volume effect, the PDFF significantly negatively correlated with the most commonly used conventional radiographic mammogram breast density estimations.
Purpose
Breast cancer is the leading cause of cancer related deaths among women worldwide with almost 650.000 deceases per year (1). In both screen-detected and symptomatic patients, high breast density, as a measure of fibroglandular parenchyma relative to adipose tissue, has been identified as one of the strongest independent risk factors for the development of breast cancer and is associated with a twofold increase in breast cancer incidence rates (2-4). In clinical practice, the breast density is assessed in conventional radiographic mammograms whose accuracy is limited by a great intra- and inter-reader variability and a small calibration margin (5, 6). Therefore, a reader-independent, non-ionizing, quantitative assessment of breast density is desirable. MRI presents a suitable alternative for an objective, volumetric quantification of the structural composition of the breast without the use of ionizing radiation. Previous MRI techniques have primarily employed thresholding analysis of T1-weighted imaging and water-fat separated Dixon images (7-9). The water-fat MRI-based proton density fat fraction (PDFF) defined as the ratio of density of triglyceride protons to the total density of triglyceride and water protons is a comprehensive and clinically highly practical biomarker for the tissue fat concentration (10-12). The present study aims to investigate PDFF as a quantitative biomarker for fat tissue concentration in breast MRI and correlate its performance to mammography as the most widely used breast density measurement in the clinical setting.Methods
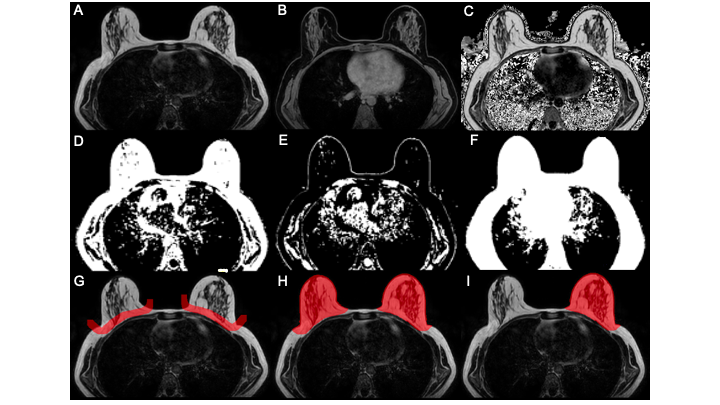
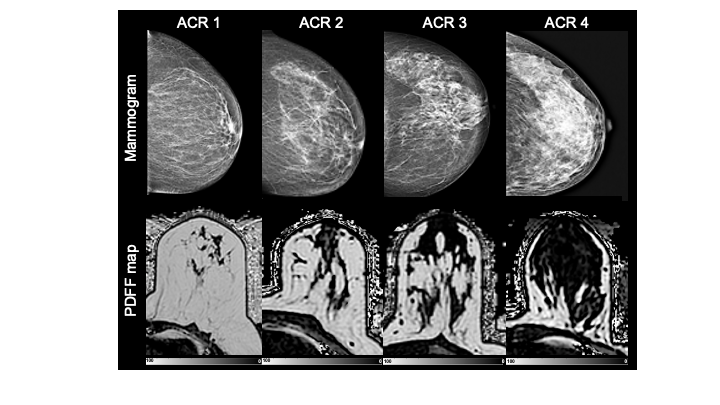
In this retrospective study, 193 pre- and postmenopausal women with a reported benign mammography screening within the last 15 months were subjected to 3T MRI (Philips Ingenia, Best, The Netherlands) from August to November 2020. MRI included a 6-echo chemical shift encoding-based water-fat imaging sequence with the following parameters: bipolar readout, 1.7mm isotropic acquisition voxel size, FOV(mm):AP=220,RL=440,FH=190, C-SENSE factor 3, TR/TE/deltaTE = 8.8/1.43/1.1, flip angle = 3°, acquisition time: 2:11 min. Water-fat separation was performed online using the water-fat separation algorithm of the vendor, after phase error correction. Water-fat separation was performed based on a signal model accounting for a single T2* decay and a pre-calibrated 7-peak fat spectrum accounting for the presence of multiple peaks in the fat spectrum. Resulting volumetric fat-only, water-only images and PDFF maps (reflecting the fat signal percentage in each voxel) were generated (Figure 1) (10). A semi-automated breast segmentation was performed by manually delineating the border between the pectoralis muscle and the breast parenchyma on every second slice in fat-only images with ITK-SNAP (13). Using k-means clustering, the FOV was divided into water, fat and background signal. The manually selected borders where connected with a dilation step and the centroids of the left and right breast were calculated by projecting the manual delineation in AP orientation. Both the centroid position and the border delineation helped separating the breast from the thorax using bwselect from the Image processing toolbox (MATLAB R2020b, The MathWorks) (Figure 2). Finally, the mean PDFF values of the isolated breasts were automatically extracted.The mammographic breast density was classified by visual estimation of two independent radiological readers with 4 and 1 years of experience in mammography using the American College of Radiology Breast Imaging Reporting and Data System categories 1-4 (14). Spearman correlation was used between PDFF and mammographic categories. To evaluate their congruity, the Kruskal-Wallis test was performed followed by the Bonferroni Holm correction criteria due to their non-gaussian distribution. Statistical analyses were performed using R (R Foundation for Statistical Computing, 1.3.1056, 2020).Results
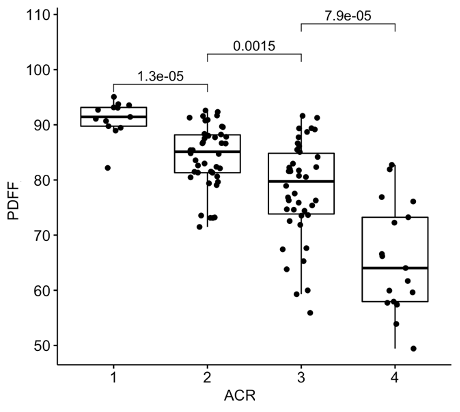
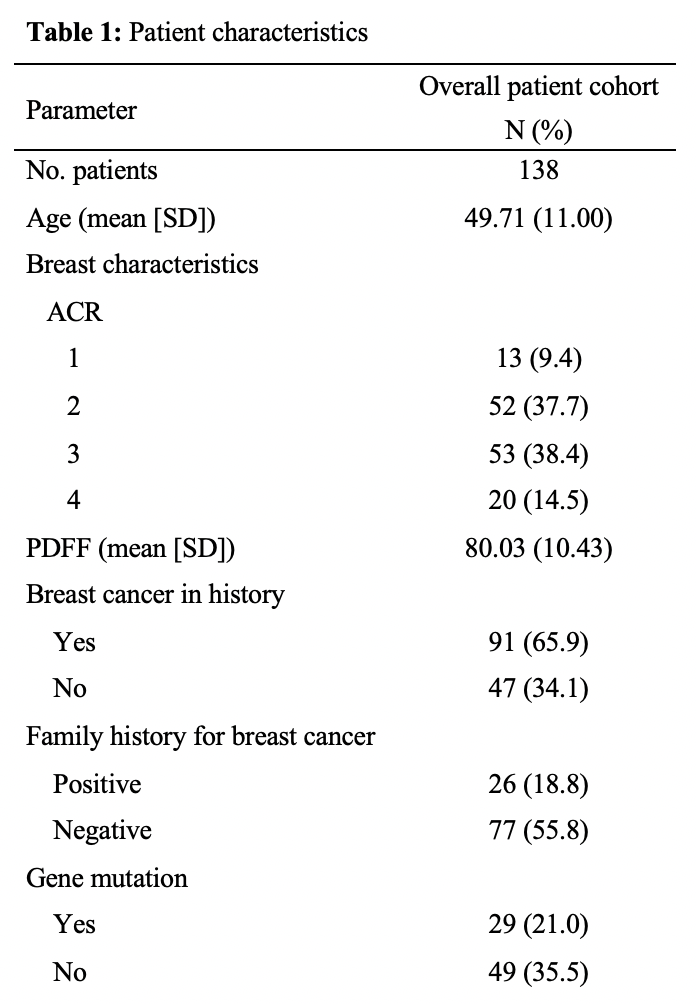
The inter-reader reliability in mammographic breast density estimations was 0.7. Good quality PDFF maps were obtained in 138 women, excluding images with artefacts due to a failing phase error correction or an incorrect selection of the center frequency in patients with silicone implants (Table 1). There was no difference between right and left breast (p = 0.94). The PDFF strongly, negatively correlated with the mammographic breast density measurements (Spearman rho: -0.74, p < 0.0001) and revealed a significant distinction between all four categories following the Bonferroni Holm correction (Figure 3).Discussion
Previous works for assessing breast density with MRI have relied on thresholding of T1-weighted and Dixon images, which is limited by partial volume effects. In a recent publication, Ding et al. employed a Dixon acquisition using a GRASE sequence which required additional calibrations to remove T1 and T2 weighting effects (15). The present work uses a low flip angle gradient echo sequence for mapping the PDFF, which is independent of the underlying relaxation properties and has been validated in other organs. Furthermore, the PDFF overcomes the 2D projection limitations of conventional mammography. The improved concordance of the poor reader reproducibility (6) and the simple integration of breast density measurements derived from the PDFF may provide clinicians with a valuable tool for an accurate cancer risk prediction and reliable evaluation of longitudinal changes in breast density.Conclusion
The proposed PDFF could be considered for an automated, reproducible tissue fat concentration measurement that is directly comparable with mammographic breast density estimations and therefore a promising approach to an accurate, user-independent and non-ionizing breast density assessment.Acknowledgements
The present work was in part supported by Philips Healthcare.References
1. Bray F, Ferlay J, Soerjomataram I, Siegel RL, Torre LA, Jemal A. Global cancer statistics 2018: GLOBOCAN estimates of incidence and mortality worldwide for 36 cancers in 185 countries. CA Cancer J Clin. 2018;68(6):394-424.
2. Vachon CM, van Gils CH, Sellers TA, Ghosh K, Pruthi S, Brandt KR, et al. Mammographic density, breast cancer risk and risk prediction. Breast Cancer Res. 2007;9(6):217.
3. Boyd NF, Guo H, Martin LJ, Sun L, Stone J, Fishell E, et al. Mammographic density and the risk and detection of breast cancer. N Engl J Med. 2007;356(3):227-36.
4. Lee CI, Chen LE, Elmore JG. Risk-based Breast Cancer Screening: Implications of Breast Density. Med Clin North Am. 2017;101(4):725-41.
5. Chong A, Weinstein SP, McDonald ES, Conant EF. Digital Breast Tomosynthesis: Concepts and Clinical Practice. Radiology. 2019;292(1):1-14.
6. Sohn G, Lee JW, Park SW, Park J, Woo J, Kim HJ, et al. Reliability of the percent density in digital mammography with a semi-automated thresholding method. J Breast Cancer. 2014;17(2):174-9.
7. Tagliafico A, Bignotti B, Tagliafico G, Astengo D, Martino L, Airaldi S, et al. Breast density assessment using a 3T MRI system: comparison among different sequences. PLoS One. 2014;9(6):e99027.
8. Thomson CA, Chow HHS, Wertheim BC, Roe DJ, Stopeck A, Maskarinec G, et al. A randomized, placebo-controlled trial of diindolylmethane for breast cancer biomarker modulation in patients taking tamoxifen. Breast Cancer Res Treat. 2017;165(1):97-107.
9. Wengert GJ, Helbich TH, Vogl WD, Baltzer P, Langs G, Weber M, et al. Introduction of an automated user-independent quantitative volumetric magnetic resonance imaging breast density measurement system using the Dixon sequence: comparison with mammographic breast density assessment. Invest Radiol. 2015;50(2):73-80.
10. Reeder SB, Hu HH, Sirlin CB. Proton density fat-fraction: a standardized MR-based biomarker of tissue fat concentration. J Magn Reson Imaging. 2012;36(5):1011-4.
11. Yokoo T, Shiehmorteza M, Hamilton G, Wolfson T, Schroeder ME, Middleton MS, et al. Estimation of hepatic proton-density fat fraction by using MR imaging at 3.0 T. Radiology. 2011;258(3):749-59.
12. Meisamy S, Hines CD, Hamilton G, Sirlin CB, McKenzie CA, Yu H, et al. Quantification of hepatic steatosis with T1-independent, T2-corrected MR imaging with spectral modeling of fat: blinded comparison with MR spectroscopy. Radiology. 2011;258(3):767-75.
13. Yushkevich PA, Piven J, Hazlett HC, Smith RG, Ho S, Gee JC, et al. User-guided 3D active contour segmentation of anatomical structures: significantly improved efficiency and reliability. Neuroimage. 2006;31(3):1116-28.
14. Liberman L, Menell JH. Breast imaging reporting and data system (BI-RADS). Radiol Clin North Am. 2002;40(3):409-30, v.
15. Ding J, Stopeck AT, Gao Y, Marron MT, Wertheim BC, Altbach MI, et al. Reproducible automated breast density measure with no ionizing radiation using fat-water decomposition MRI. J Magn Reson Imaging. 2018;48(4):971-81.
Figures