0741
Cost-Effectiveness Analysis of Magnetic Resonance Spectroscopy for the Differentiation of Recurrent Glioma from Radiation Necrosis1Center for Clinical Spectroscopy, Brigham and Women's Hospital, Boston, MA, United States
Synopsis
To date there have been no formal studies of the cost-effectiveness of magnetic resonance spectroscopy. Cost-effectiveness analysis was conducted by utilizing a decision-analytic model that compared MRS and standard of care to standard of care alone for recurrent glioma and necrosis differentiation. Our results showed that performing MRS was highly cost-effective with incremental cost-effectiveness ratios of -$98,978, -$50,666 and -$41,349 per quality-adjusted life-years over 5-year, 10-year and lifetime horizons. At the willingness-to-pay threshold of $50,000, performing MRS was more cost-effective with certainty of 96% to 97% over those time-horizons. MRS should be considered reimbursable by policy makers.
Introduction:
Magnetic Resonance Spectroscopy (MRS) has demonstrated diagnostic accuracy in the differentiation of recurrent glioma from necrosis after treatment1,6, however evidenced based medicines studies have pointed out that there are no studies examining the cost benefit of MRS in this scenario. As a result, reimbursement for MRS has been mixed1-3. To date, there has not been a formal cost benefit analysis for the use of spectroscopy in clinical practice. Therefore, the objective of this study is to determine the cost-effectiveness of MRS for the differentiation of recurrent glioma from necrosis utilizing a decision-analytic model.Methods:
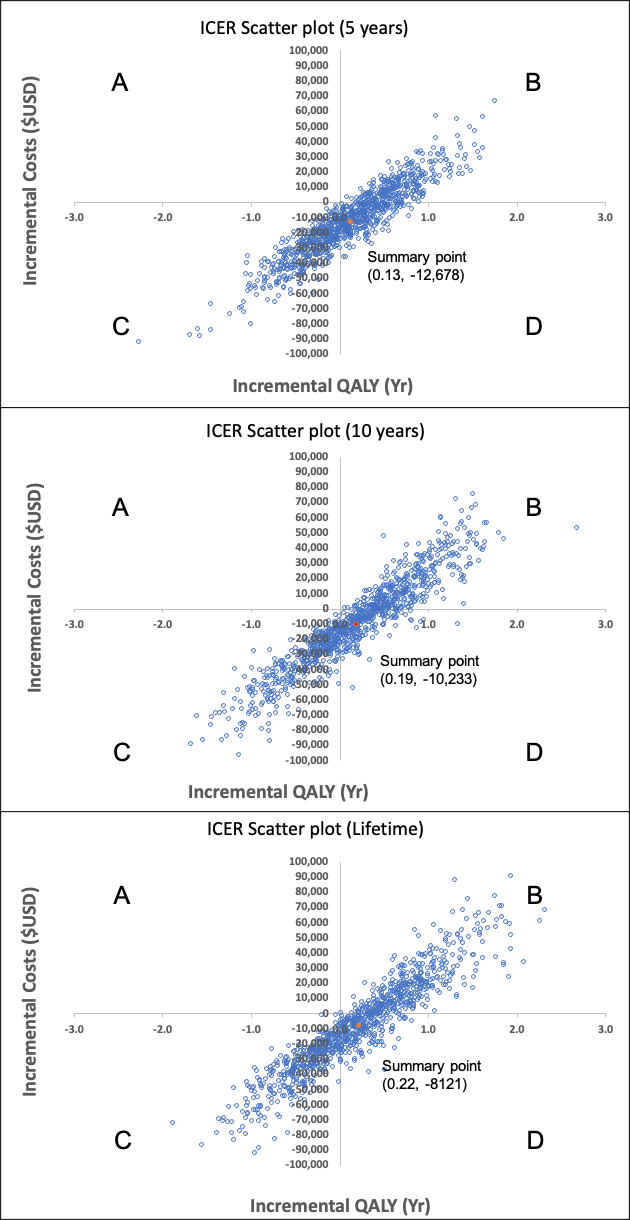
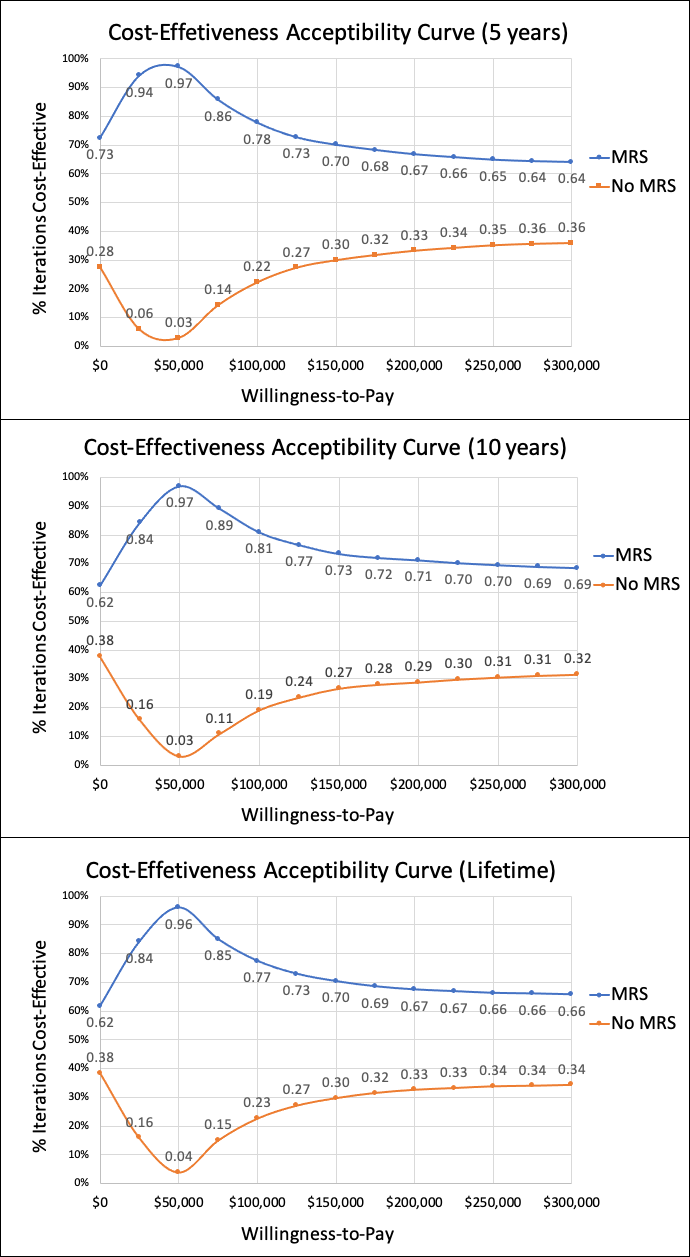
Model: A decision-analytic model4 was constructed using a combined decision tree and Markov model based on the scenario provided by Blue Cross/Blue Shield TEC Assessment Report5 (Fig.1). The goal of the model was to compare cost and effectiveness of two methods 1) when MRS was performed and 2) when MRS was not performed (go straight to biopsy) for patients that had undergone prior treatment for glioma and now have new or persistent brain findings on imaging that are suspicious for recurrent glioma or cerebral necrosis5. Analysis was performed from a U.S. health system perspective over 5-years, 10-years and lifetime horizons. Input data were derived from systematic literature searches, meta-analyses, and medical fee book. (Tables1&2)6-16. The primary outcome measure in this analysis was the incremental cost-effectiveness ratio (ICER) calculated based on the long-term outcomes in both methods: ICER=(cost of “MRS performed”– cost of “No MRS performed”)/(effectiveness of “MRS performed”– effectiveness of “No MRS performed”). The effectiveness was measured in terms of quality adjusted life years (QALYs), which was the product of survival rates and the utility associated with a health state. The estimates of QALYs and costs were already discounted at a 3% rate17 from which they were derived to reflect the fact that society prefers to receive benefits sooner rather than later and pay costs later rather than sooner18.Sensitivity Analysis: One-way sensitivity analysis was performed on all study variables over a plausible range of values shown in Table1&2 to recalculate model results in order to account for variability in factors such as test cost and local expertise. A probabilistic sensitivity analysis was also performed, and a Monte-Carlo simulation was used to create 1000 samples. Parameters were assumed to be unrelated to each other. Results of the simulations were presented in cost-effectiveness planes (Fig.2) and acceptability curves (Fig.3).
The decision-analytic model, all analysis and Monte Carlo simulations were performed by using a custom script using Microsoft® Excel (Microsoft Corporation, Redmond, WA, USA)19.
Results:
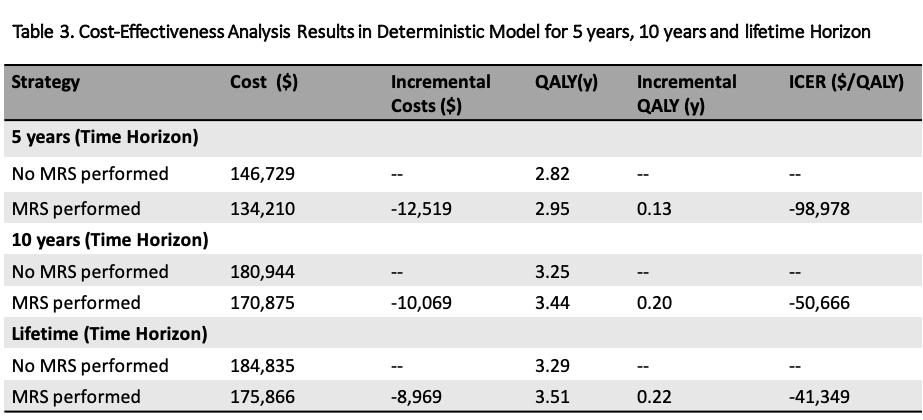
The cost, QALYs and ICERs of the two methods in a deterministic model (Cost-effectiveness-Analysis in Baseline-Case) over 5-year, 10-year and lifetime horizons are shown in Table 3. The results showed that it cost less and had higher QALYs over 5-year, 10-year and lifetime horizons respectively when a MRS exam was performed. This resulted in ICERs of -$98,978, -$50,666 and -$41,349 per QALY gained.One-way sensitivity analysis result revealed that only >31% was needed for the sensitivity of MRS to be cost-effective. All three ICER scatter plots of probabilistic sensitivity analysis20 for MRS versus no MRS performed (Fig.2) had their summary points in Quadrant-D where MRS performed was more effective (incremental QALYs:0.13, 0.19, 0.22) and less expensive (incremental Cost:-$12,678, -$10,233, -$8121) similar to the findings from deterministic model. Even in the ICER scatter plot of lifetime horizon with the fewest points observed in Quadrant-D, the probability that performing MRS was more effective and less costly was 24% (points in Quadrant-D) and the probability that performing MRS was effective was 62.4% (points in Quadrant-B+D).
At a Willingness-to-Pay (WTP) threshold of $0 per QALY, method of MRS performed was already superior to no MRS performed in 73%, 62% and 62% of simulations for 5-year, 10-year and lifetime horizon respectively as shown in Figure 3. MRS performed was dominated in even 94%, 84% and 84% of simulations at WTP threshold of $25,000 and in 97%, 97% and 96% of simulations at WTP threshold of $50,000 (USA-standard4,18,21).
Discussion:
Our results suggested that performing MRS was more cost-effective compared with not performing MRS in patients with brain lesion post treatment. Even at WTP threshold of $0 per QALY, using MRS would give a higher chance of being cost-effective, which was probably due to the success of avoiding unnecessary biopsy and complication might already made it a cost-effect diagnostic tool22.To the best of our knowledge, this is the first focused cost-effectiveness analysis on MRS for glioma diagnosis utilizing a decision-analytic model. This model was a valuable instrument for assessing the uncertainties and gaps in knowledge in the currently available literature and can serve as a reference point for assessing the studies that should be conducted to improve this model-based approach. Further research to account for differences from ages, glioma types and locations, follow-up strategy, long-term treatment options and their effects are needed to further validate the accuracy and reliability of our model.
Conclusion:
Our results suggested that performing MRS was more effective and less costly compared with not performing MRS for recurrent glioma and necrosis differentiation. MRS should be considered as a reimbursable diagnostic tool in the U.S by policy makers.Acknowledgements
No acknowledgement found.References
1. Magnetic Resonance Spectroscopy, Medical Clinical Policy Bulletins. Aetna. Number: 0202. Effective on March 05, 1998. Last Review on August 28, 2020. Available at: http://www.aetna.com/cpb/medical/data/200_299/0202.html#dummyLink1. Accessed December 14, 2020.
2. Magnetic Resonance Spectroscopy, Corporate Medical Policy, BlueCross BlueShield of North Carolina. Origination: Dec 1997. Last Review May 2020. Available at https://www.bluecrossnc.com/sites/default/files/document/attachment/services/public/pdfs/medicalpolicy/magnetic_resonance_spectroscopy.pdf . Accessed December 14, 2020.
3. Jordan HS, Bert R, Chew P, et al., and the Tufts-New England Medical Center Evidence-Based Practice Center. Magnetic resonance spectroscopy for brain tumors. EPC Technical Support of the CPTA Technology Assessment Program. Prepared for the Agency for Healthcare Research and Quality (AHRQ). Contract No. 290-02-0022, Task Order # 1. Rockville, MD: AHRQ; revised June 13, 2003. Available at: http://www.cms.hhs.gov/ncdr/trackingsheet.asp?id=52. Accessed June 17, 2003.
4. Kang SK, Hoffman D, Ferket B, Kim MI, Braithwaite RS. Risk-stratified versus Non–Risk-stratified Diagnostic Testing for Management of Suspected Acute Biliary Obstruction: Comparative Effectiveness, Costs, and the Role of MR Cholangiopancreatography. Radiology. 2017;284(2):468-481. doi:10.1148/radiol.2017161714
5. Magnetic Resonance Spectroscopy for Evaluation of Suspected Brain Tumor. Blue Cross Blue Shield Technology Evaluation Center. Assessment Program, Volume 18, No. 1, June 2003.
6. Zhang H, Ma L, Wang Q, Zheng X, Wu C, Xu B. Role of magnetic resonance spectroscopy for the differentiation of recurrent glioma from radiation necrosis: A systematic review and meta-analysis. European Journal of Radiology. 2014;83(12):2181-2189. doi:10.1016/j.ejrad.2014.09.018
7. Shukla-Dave A, Gupta RK, Roy R et al. Prospective evaluation of in vivo proton MR Spectroscopy in differentiation of similar appearing intracranial cystic lesions. Mag Res Imaging, 2001; 19:103-110
8. Varra V, Leyrer CM, Tom MC, et al. Risk Factors for Progression of Low Grade Glioma Following Gross Total Resection and Observation in the Molecular Era. International Journal of Radiation Oncology*Biology*Physics. 2018;102(3):S49. doi:10.1016/j.ijrobp.2018.06.098
9. Diamond EL, Panageas KS, Dallara A, et al. Frequency and Predictors of Acute Hospitalization Before Death in Patients With Glioblastoma. Journal of Pain and Symptom Management. 2017;53(2):257-264. doi:10.1016/j.jpainsymman.2016.09.008
10. Irwin C, Hunn M, Purdie G, Hamilton D. Delay in radiotherapy shortens survival in patients with high grade glioma. J Neurooncol. 2007;85(3):339-343. doi:10.1007/s11060-007-9426-z
11. Chen C-C, Hsu P-W, Erich Wu T-W, et al. Stereotactic brain biopsy: Single center retrospective analysis of complications. Clinical Neurology and Neurosurgery. 2009;111(10):835-839. doi:10.1016/j.clineuro.2009.08.013
12. Dammers R, Schouten JW, Haitsma IK, Vincent AJPE, Kros JM, Dirven CMF. Towards improving the safety and diagnostic yield of stereotactic biopsy in a single centre. Acta Neurochir. 2010;152(11):1915-1921. doi:10.1007/s00701-010-0752-0
13. Ray S, Bonafede MM, Mohile NA. Treatment Patterns, Survival, and Healthcare Costs of Patients with Malignant Glioma in a Large US Commercially Insured Population. 2014; 7(3):10
14. Rogers G, Garside R, Mealing S, et al. Carmustine Implants for the Treatment of Newly Diagnosed High-Grade Gliomas: A Cost-Utility Analysis. PharmacoEconomics. 2008;26(1):33-44. doi:10.2165/00019053-200826010-00004
15. Medical Fees 2018. Practice Management Information Corporation (PMIC) 2018.
16. Martino J, Gomez E, Bilbao JL, Dueñas JC, Vázquez-Barquero A. Cost-utility of maximal safe resection of WHO grade II gliomas within eloquent areas. Acta Neurochir. 2013;155(1):41-50. doi:10.1007/s00701-012-1541-8
17. Lipscomb J, Weinstein MC, Torrance GW. Time preference. In Cost-Effectiveness in Health and Medicine, M Gold, J Siegel, LB Russell, and MC Weinstein, eds. New York: Oxford, 1996.
18. Pahwa S, Schiltz NK, Ponsky LE, Lu Z, Griswold MA, Gulani V. Cost-effectiveness of MR Imaging–guided Strategies for Detection of Prostate Cancer in Biopsy-Naive Men. Radiology. 2017;285(1):157-166. doi:10.1148/radiol.2017162181
19. Edlin R, McCabe C, Hulme Claire, Hall P, and Wright J. Cost Effectiveness Modelling for Health Technology Assessment-A practical Course. Springer International Publishing Switzerland 2015 (eBook).
20. de Rooij M, Crienen S, Witjes JA, Barentsz JO, Rovers MM, Grutters JPC. Cost-effectiveness of Magnetic Resonance (MR) Imaging and MR-guided Targeted Biopsy Versus Systematic Transrectal Ultrasound–Guided Biopsy in Diagnosing Prostate Cancer: A Modelling Study from a Health Care Perspective. European Urology. 2014;66(3):430-436. doi:10.1016/j.eururo.2013.12.012
21. McDougall JA, Furnback WE, Wang BCM, Mahlich J. Understanding the global measurement of willingness to pay in health. Journal of Market Access & Health Policy. 2020;8(1):1717030. doi:10.1080/20016689.2020.1717030
22. Lin A, Ross BD, Harris K, Wong W. Efficacy of proton magnetic resonance spectroscopy in neurological diagnosis and neurotherapeutic decision making. NeuroRx. 2005;2(2):197-214. doi:10.1602/neurorx.2.2.197
Figures
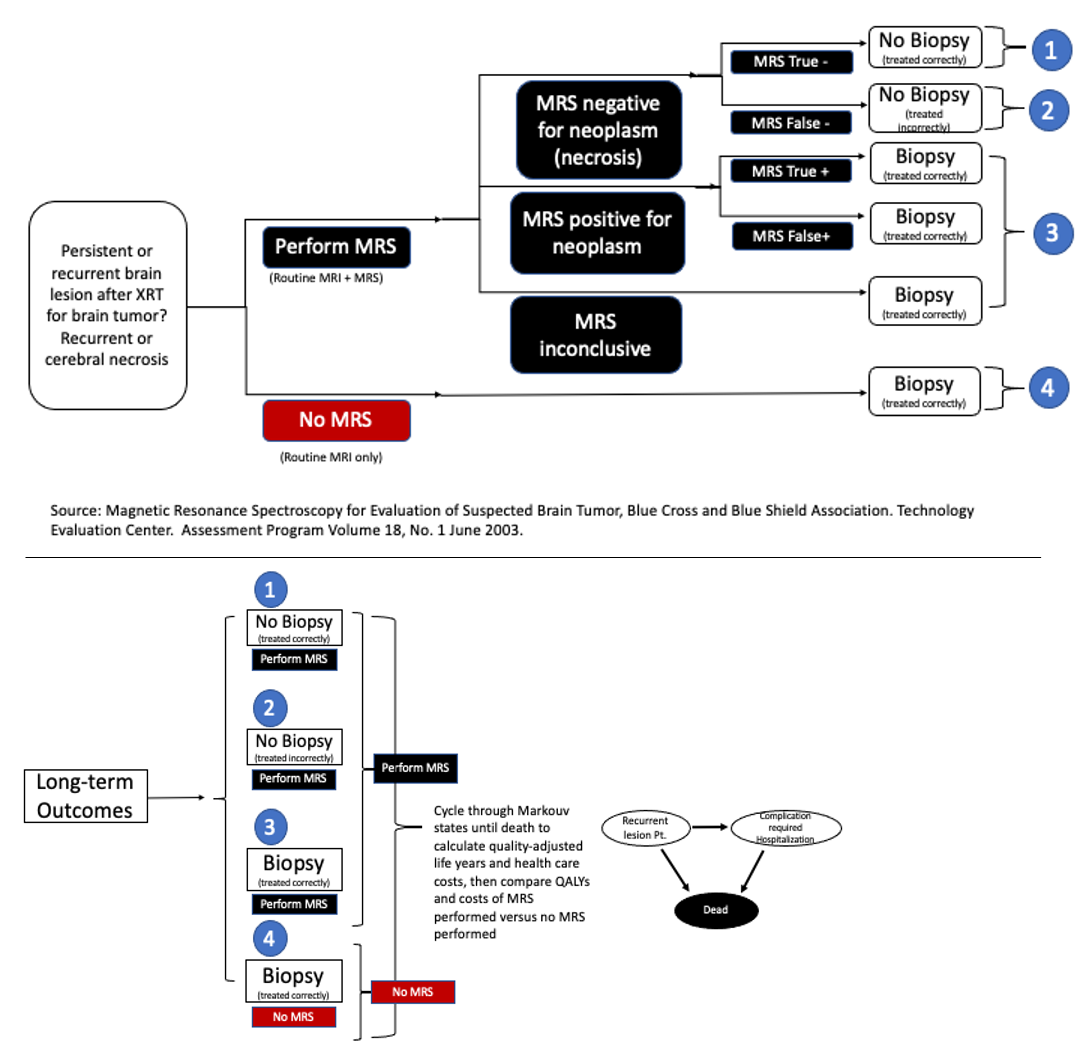
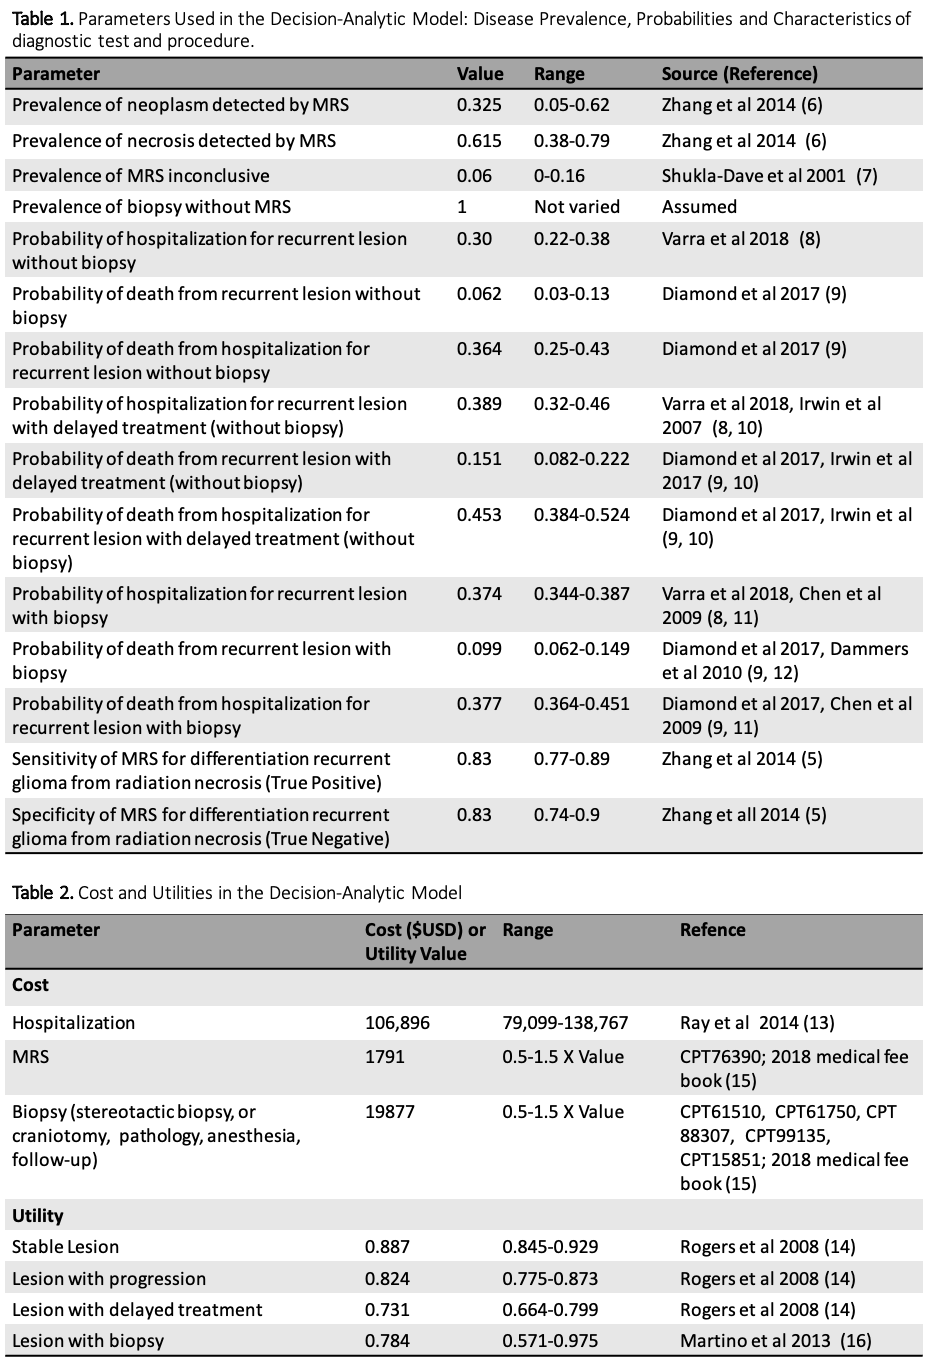
Table 1. Parameters Used in the Decision-Analytic Model: Disease Prevalence, Probabilities and Characteristics of diagnostic test and procedure.
Table 2. Cost and Utilities in the Decision-Analytic Model