0740
Imaging of electromagnetic field distribution in deep brain stimulation (DBS): a biological tissue phantom study1School of Biological and Health System Engineering, Arizona State University, Tempe, AZ, United States, 2Department of Surgery, University of Arizona, Tucson, AZ, United States
Synopsis
Knowledge of electromagnetic field distribution parameters such as current density, conductivity, and electric field distribution may play an essential role in understanding DBS therapeutic effects on living tissues. However, until now there has been no experimental method that can measure these field parameters. In this work, we demonstrate that it is possible to quantify electromagnetic field distribution during DBS therapy using magnetic resonance electrical impedance tomography (MREIT).
Introduction
Magnetic resonance current density imaging (MRCDI)1 and magnetic resonance electrical impedance tomography (MREIT)2 are two emerging techniques that can produce low-frequency current density and conductivity distributions, respectively using MR measurements of the z-component of the magnetic flux density (Bz) data induced due to external current injection. While the current density can be straightforwardly estimated using a single set of Bz data, the stable reconstruction of the conductivity distribution using MREIT requires data from two independent current administrations2. Administration of two independent currents are not normally possible in DBS settings.MRCDI has already been used to demonstrate current pathways during deep brain stimulation (DBS)3,4 therapy. However, it is not possible to find the corresponding electric field distributions due to the lack of a stable conductivity reconstruction method. Recently, Song et al.5 developed an iterative single-current algorithm that can stably reconstruct the ‘apparent’ conductivity distribution from data obtained using a single current administration by converting the first-order hyperbolic partial differential equation (PDE) used in the Harmonic Bz MREIT reconstruction algorithm2 into a second-order elliptical-PDE. The aim of this study is to demonstrate the capability of the new single-current harmonic Bz algorithm to characterize electromagnetic field distributions produced by DBS electrodes.
Methods
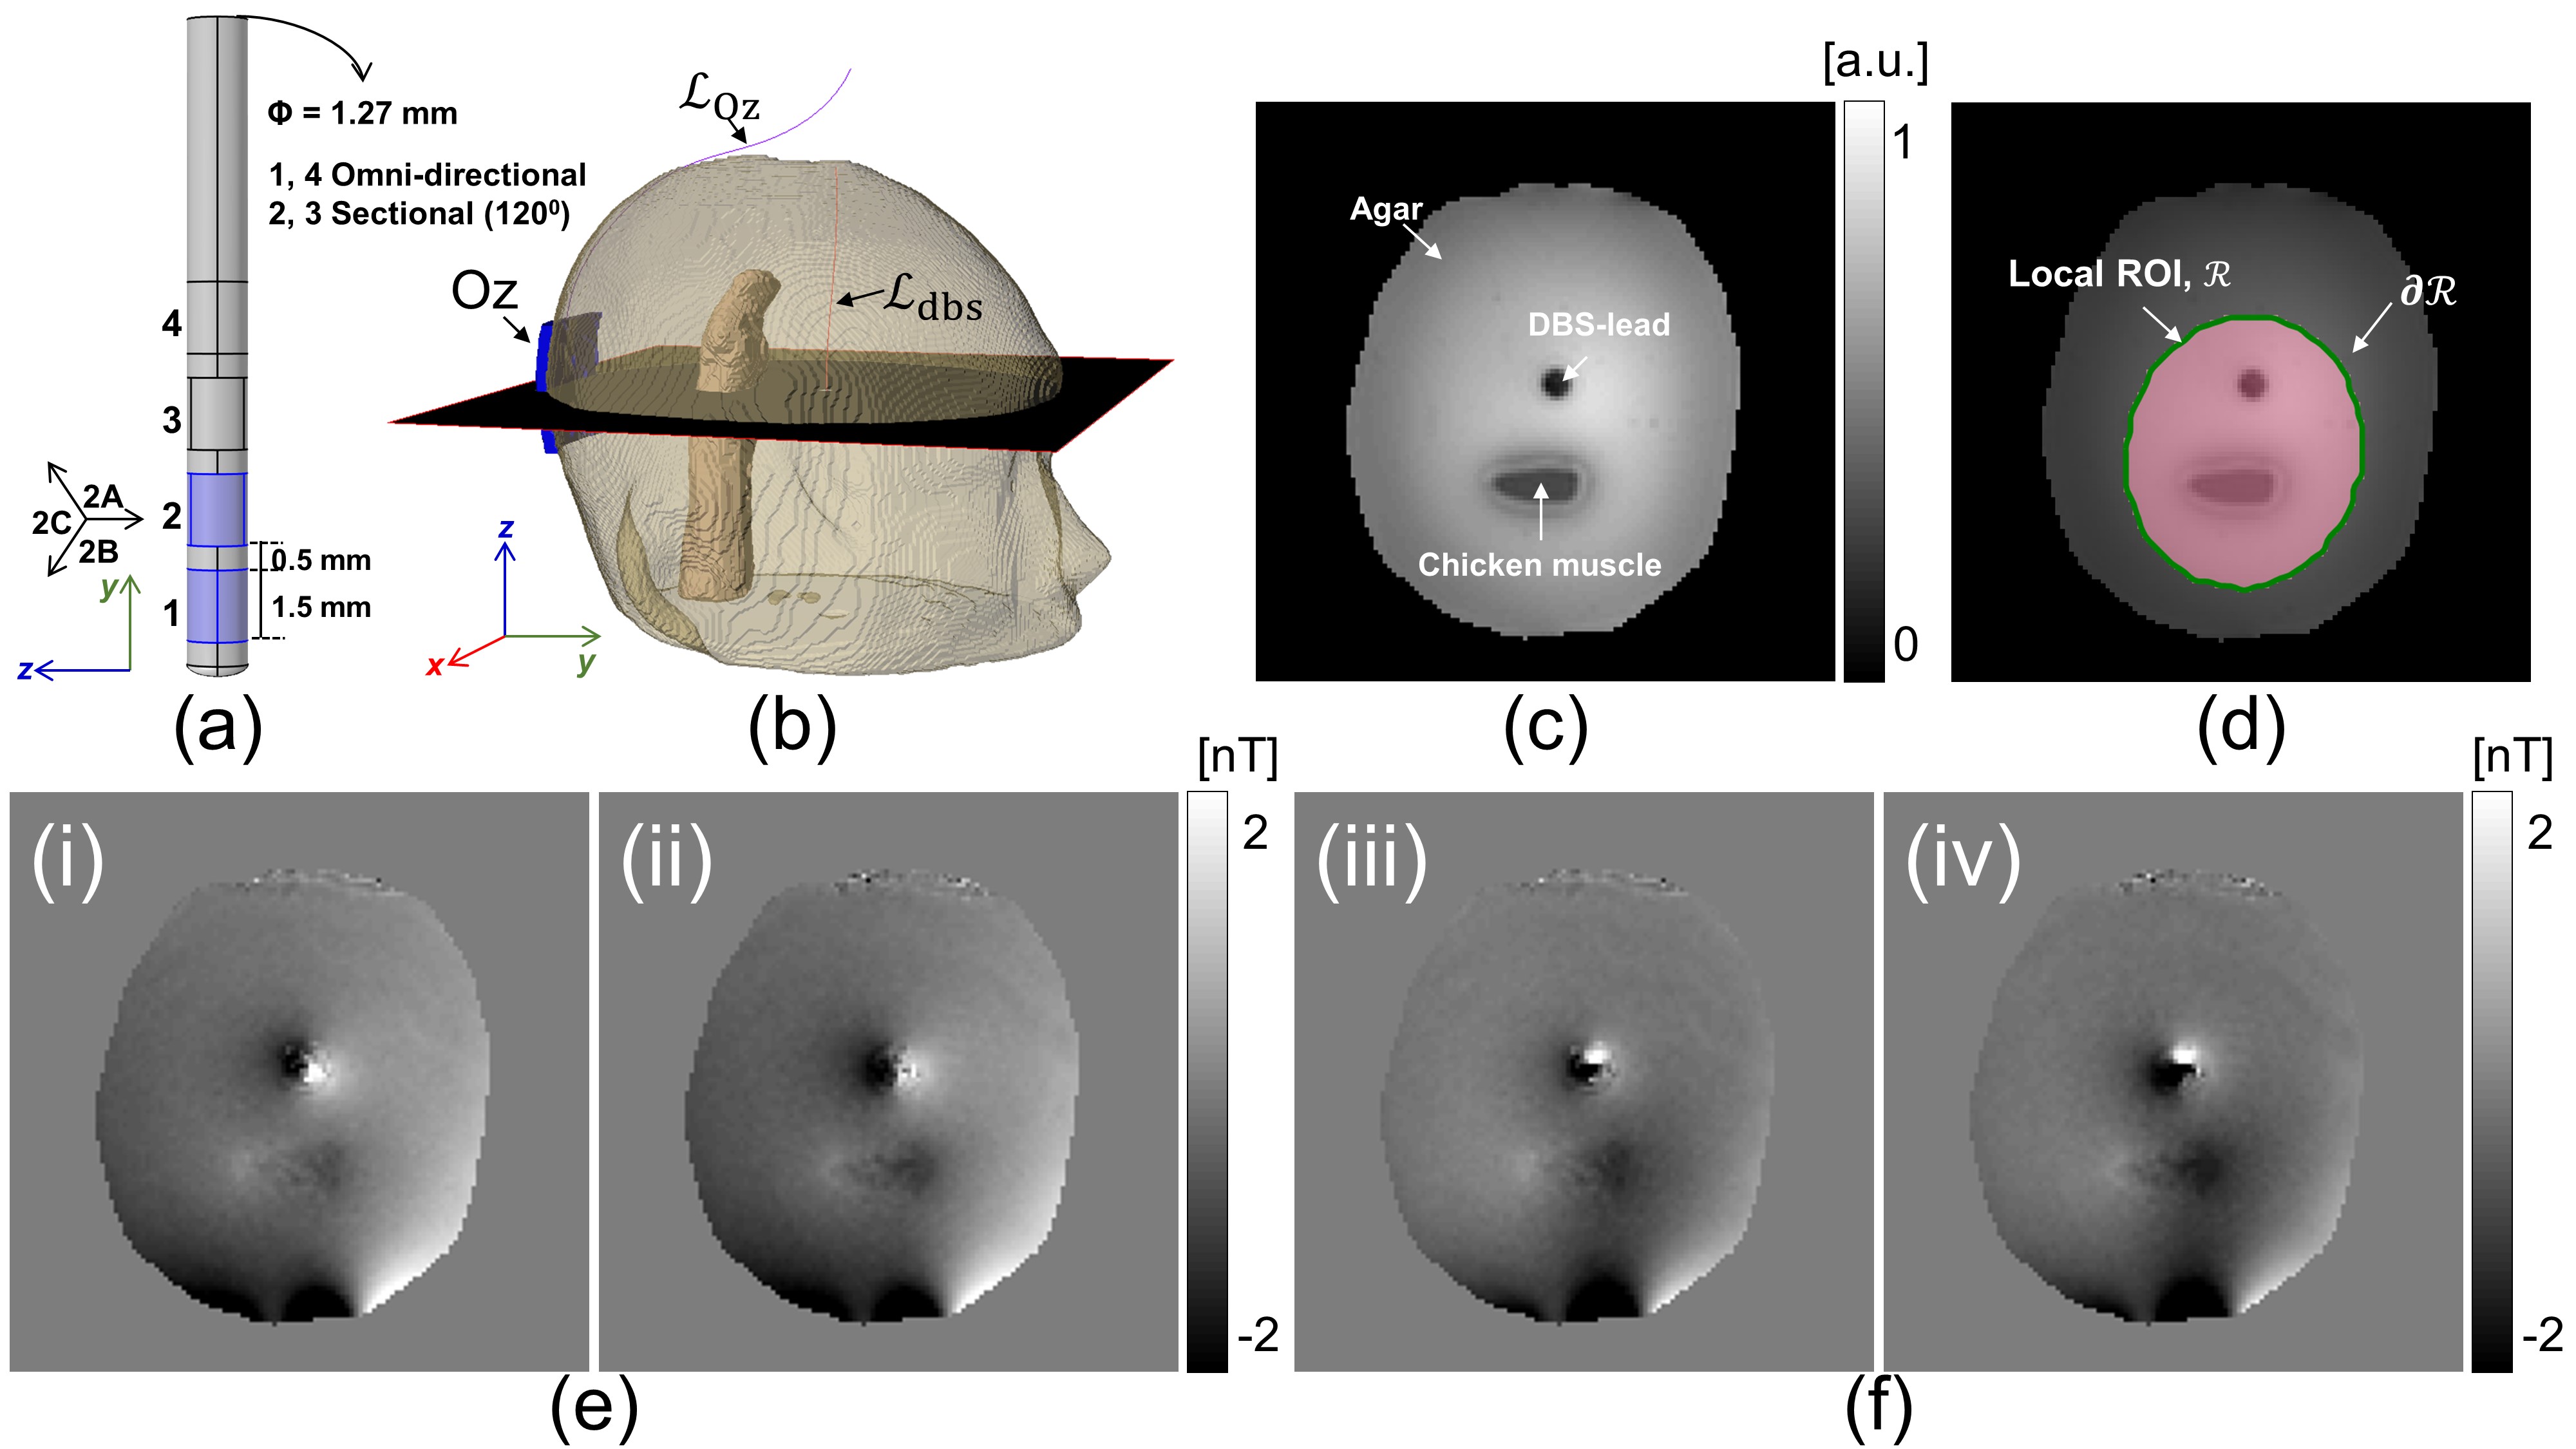
Phantom design: A head-shaped phantom formed of agarose-gel was used in this study4. At 10 Hz, the gel conductivity was measured to be 0.75 S/m. A directional DBS electrode (Abbott Infinity 6172, Abbott, Abbott Park, IL, USA) was inserted near the phantom center (Fig.1b). A 50 x 50 mm2 carbon return electrode (HUREV Co Ltd, South Korea) was also attached at the occipital (Oz) location (Fig.1b). We placed a piece of chicken muscle between DBS lead and Oz electrode (Fig.1b) to form a conductivity contrast. An MR safe electrical stimulator (DC-STIMULATOR MR, neuroConn, Ilmenau, Germany) was used to deliver a 1.0 mA current between the DBS electrode contact combinations and the return Oz electrode. In the DBS-1-Oz setting, the omni-directional electrode contact-1 (Fig.1a) of the electrode and Oz were used, and the DBS-2B-Oz setting denoted the use of the sectional electrode contact-2B (Fig.1a) facing towards the Oz direction. This allowed evaluation of the differences between electric fields produced using conventional omnidirectional DBS electrodes and newer directional DBS electrode designs.Magnetic flux density measurement: All MR data were measured using a 32-channel RF coil in a 3.0T Phillips scanner (Phillips, Ingenia, Netherlands) located at the Barrow Neurological Institute (Phoenix, Arizona, USA). Current induced Bz data was measured at three axial slice positions using the Phillips mFFE pulse sequence with an imaging matrix size of 128 x 128 and field-of-view 224x224 mm2. Other imaging parameters were TR/TE = 50/7 ms, number of echoes = 10, echo spacing = 3 ms, number of averages = 24. The total scan time was 6 min. A set of T1-weighted images with matrix size, 224x224x224 resulting in 1 mm3 isotropic resolution, were also collected during the imaging session to build a numerical model of the phantom and wiring6. Prior to estimating the electromagnetic field parameters, the echo combined7 optimized Bz images were corrected to account for wire-created stray magnetic-fields (Fig 1e-f).
Reconstruction of electromagnetic parameters: We first used the stray-field-corrected Bz data to reconstruct the current density distribution, $$$ \mathbf{\mbox{J}}^{P,R}$$$, within the local region $$$R$$$, (Fig. 1d) using the regional projected current density algorithm8. From the $$$ \mathbf{\mbox{J}}^{P,R}$$$, and the known conductivity, ($$$\sigma_{b}$$$), at the tissue boundary $$$\partial R$$$, the first-update of the internal conductivity distribution, $$$\sigma^1$$$ was reconstructed as5
$$ \begin{cases}\triangledown_{xy}^2 ln\sigma^{1}=\frac{1}{\mu_{0}}\triangledown_{xy} .\Bigg( -\frac{J_y^{P,R}}{(J_x^{P,R})^{2}+{(J_y^{P,R})^{2}}}\triangledown_{xy}^2B_{z},~\frac{J_x^{P,R}}{(J_x^{P,R})^{2}+{(J_y^{P,R})^{2}}}\triangledown_{xy}^2B_{z} \Bigg)~~~~~~in~~~ R~~~~~~~~~~~~~~~~~~~~~~~(1)\\\\~~~~~~~~~~~~~~~~~~~~~~~~~~~~~~~~~~~~~~~~ln \sigma^{1}=ln \sigma_{b}~~~~~~~~~~~~~~~~~~~~~~~~~~~~~~~~~~~~~~~~~~~~~~~~~~~~~~~~~on ~~\partial R \end{cases}$$
where $$$\mu_{0}$$$ denotes the permeability in free space. We set $$$\sigma_{b}$$$ =0.75 S/m.
The corresponding electric field distribution was then found using Ohm’s law
$$\mathbf{\mbox{E}}=\frac{\mathbf{\mbox{J}}^{P,R}}{\sigma}~~~~~~~~~~~~~~~~~~~~~~~~~~~~~~~~~~~~~~~~~~~~~~~~~~~~~~~~~~~~~~~~~~~~~~~~~~~~~~~~~~~~~~~~~~~~~~~~~~~~~~~~~~~~~~~~~~~~~~~~~~~~~~~~~~~~~~~~~~~~~(2)$$
Results
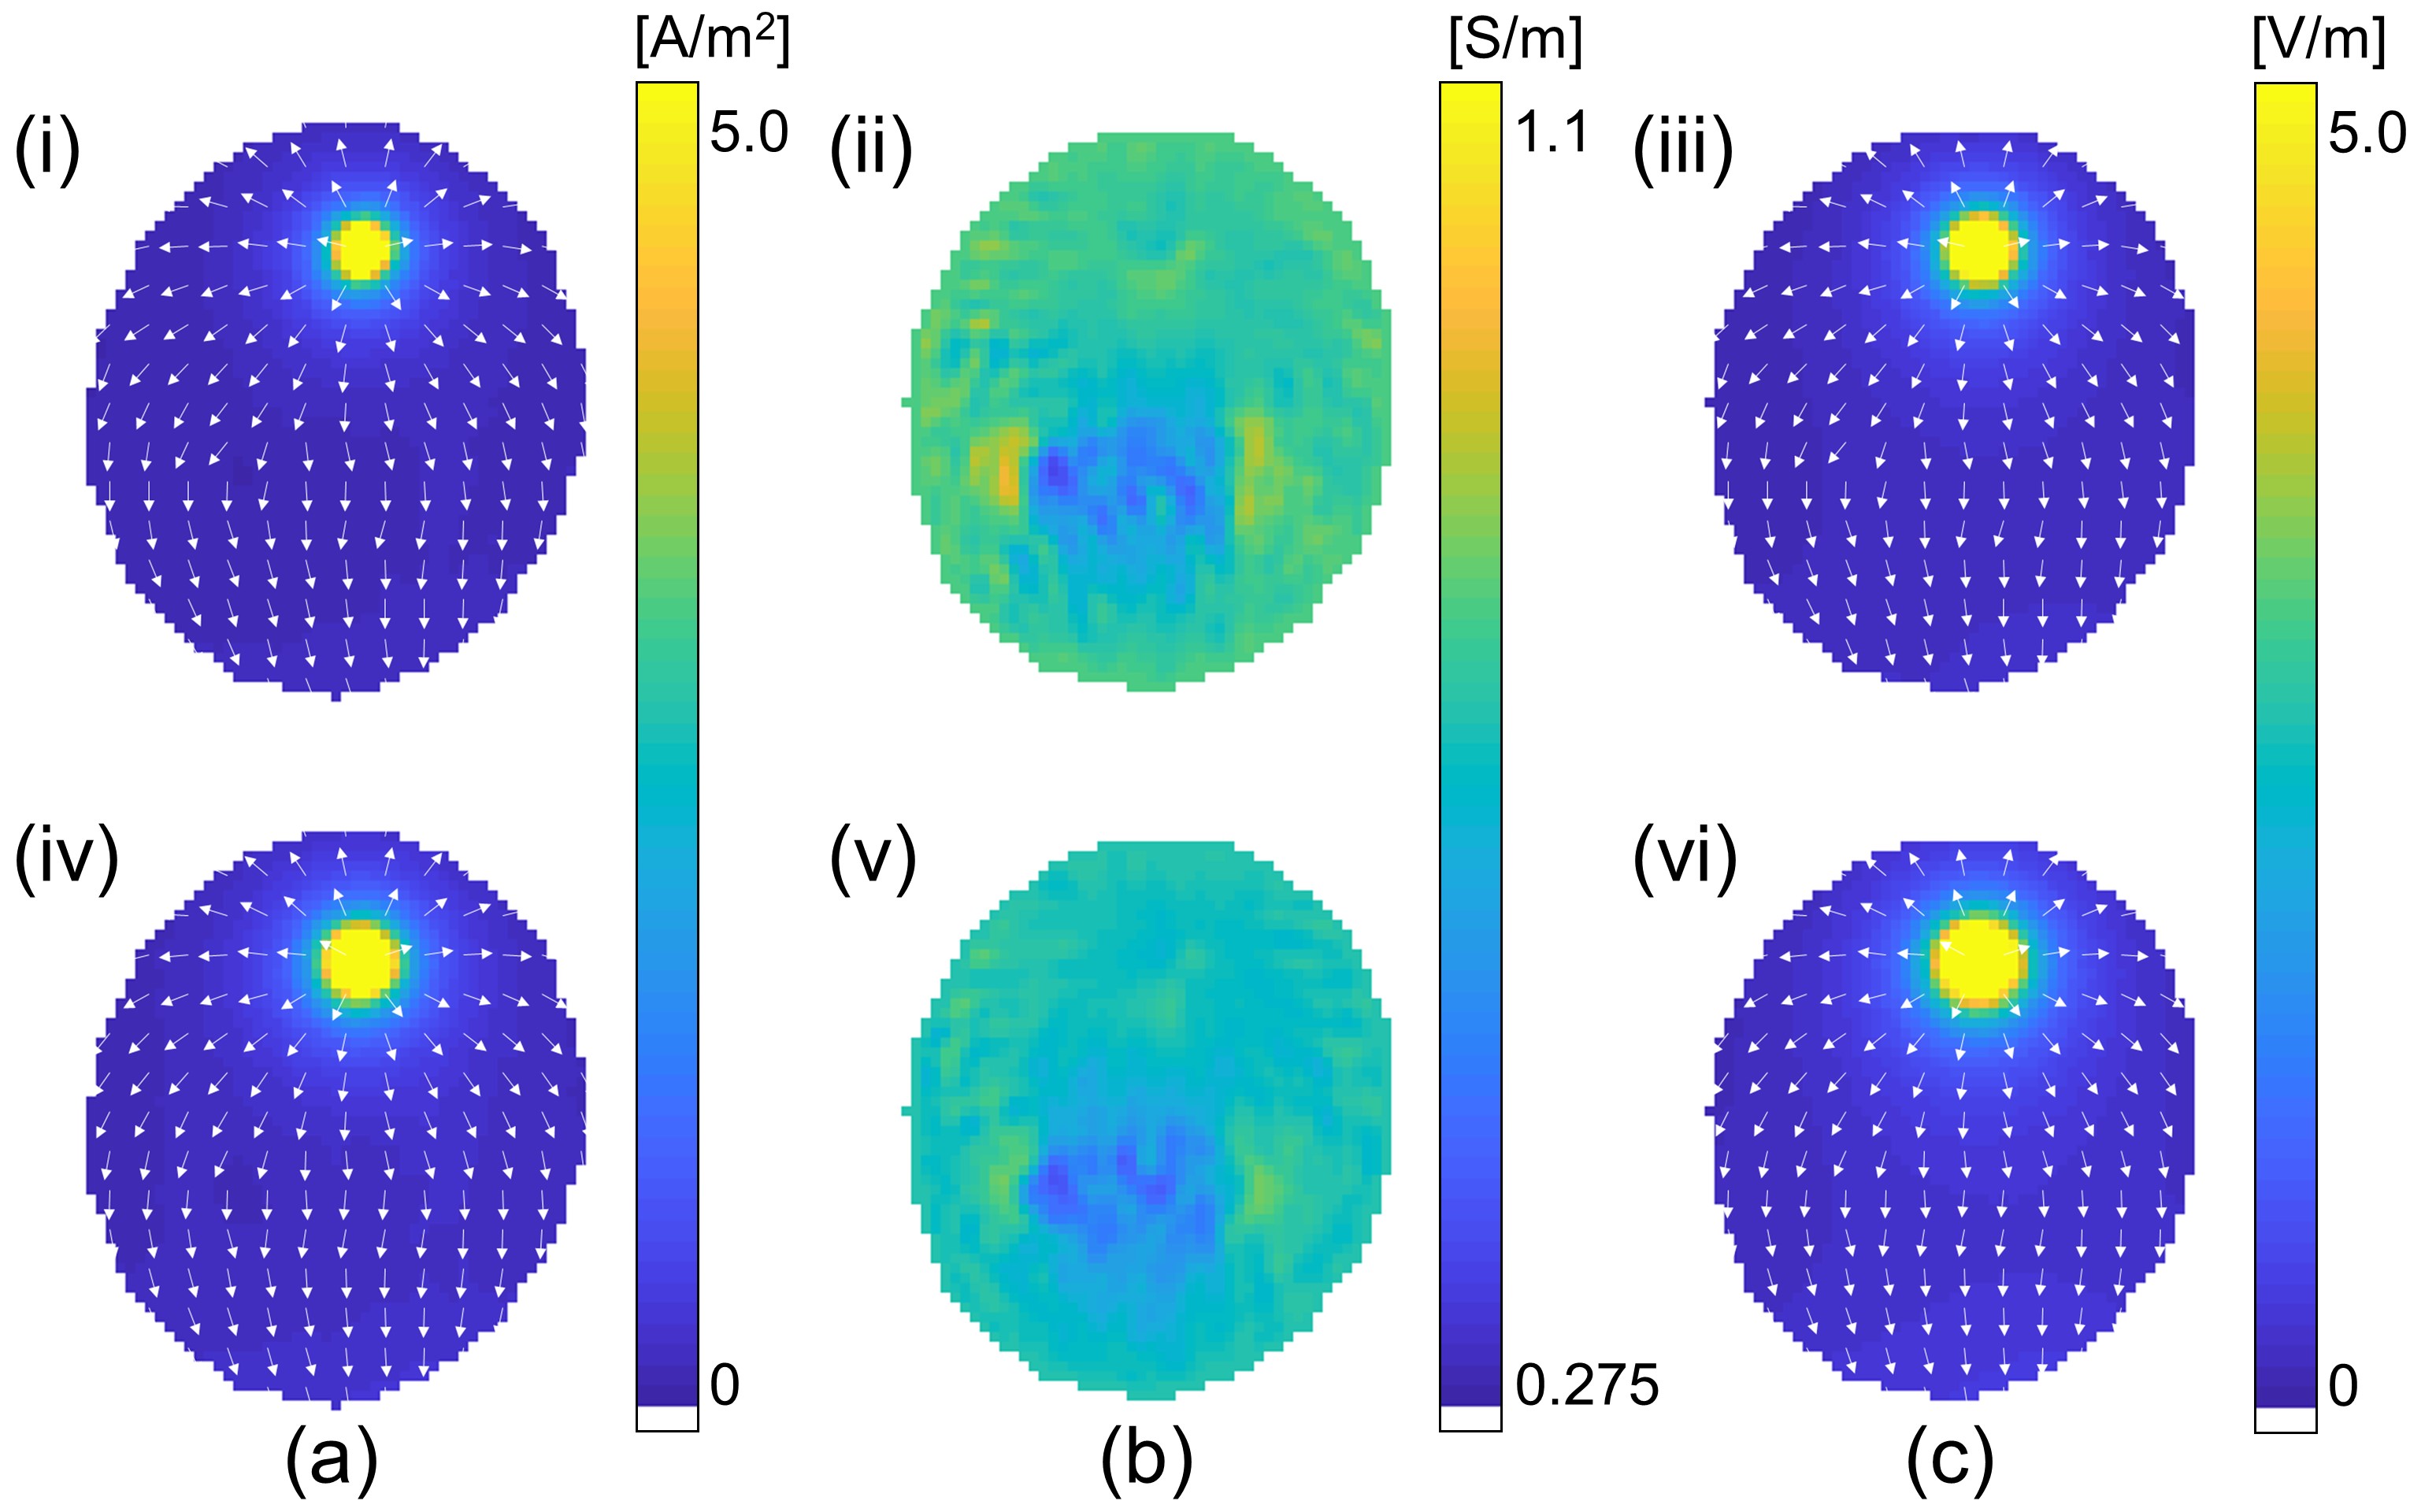
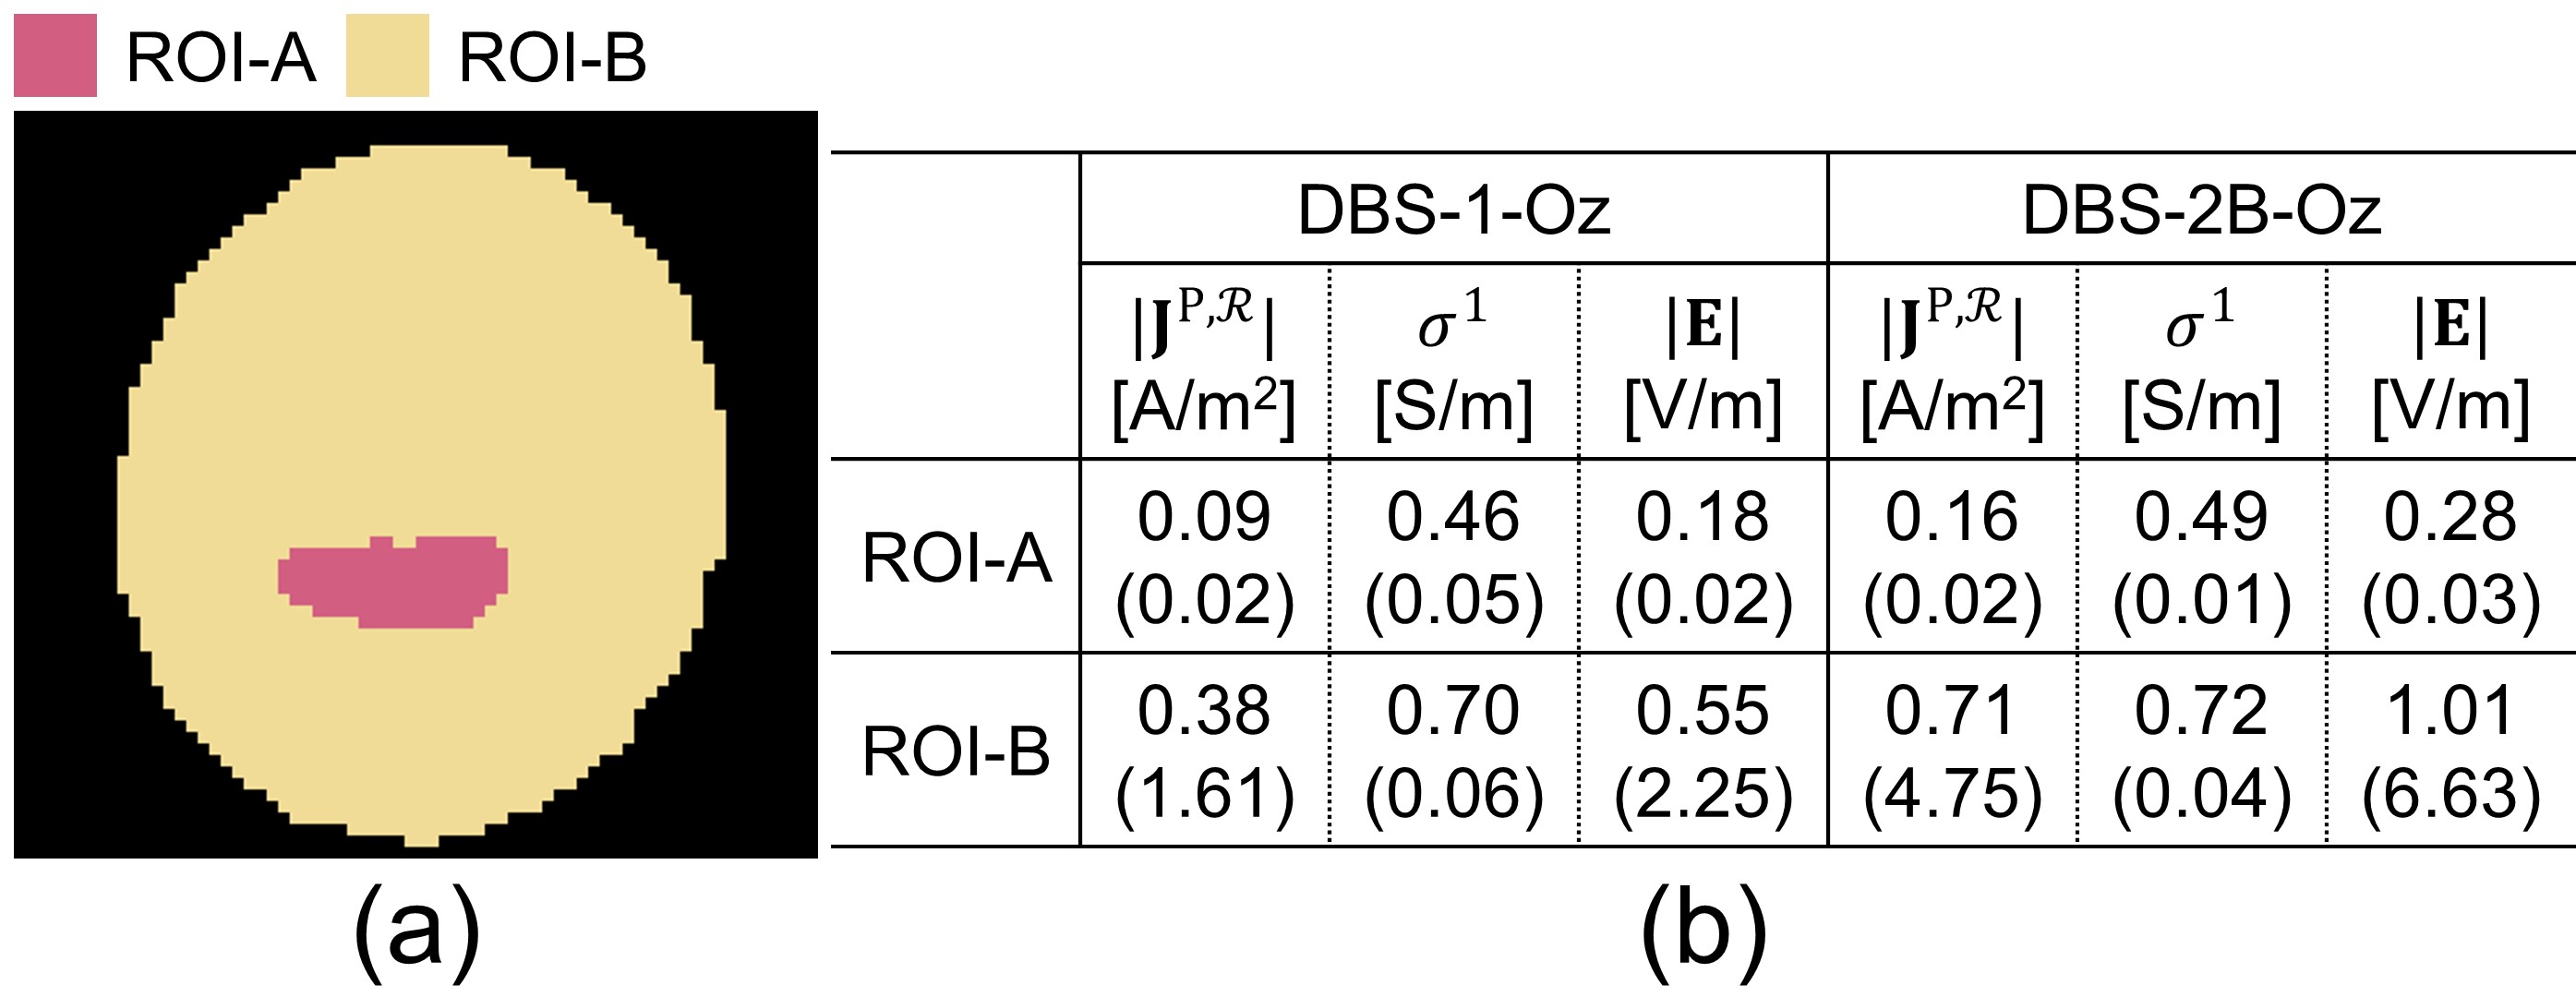
Figs. 2a (i) and (iv) show the reconstructed $$$ \mid \mathbf{\mbox{J}}^{P,R} \mid $$$distribution due to the 1.0 mA current injected using the DBS-1-Oz and DBS-2B-Oz electrode configurations, respectively. Reconstructed $$$\sigma^{1}$$$ distributions measured using the DBS-1-Oz and DBS-2B-Oz configurations are displayed in Figs. 2b (ii) and (v), respectively. The corresponding electric field magnitudes found using Eq. 2 are shown in Fig 2c (iii) and (vi). All reconstructed electromagnetic field parameters within the chicken muscle and agar background are summarized in the table in Fig 3.Discussion
As noted in5, the first update to the iterative reconstruction method $$$\sigma^{1}$$$ is sufficient to produce a result comparable with the two-current-injection non-iterative harmonic Bz algorithm9. Therefore, in this study, we only use the first-updated to the conductivity distribution to determine electromagnetic field parameters. In the case of the reconstructed $$$ \mid \mathbf{\mbox{J}}^{P,R} \mid$$$ and $$$\bf \mid E \mid$$$ fields (Fig. 3) we also found high standard deviations in the background agar region, which stems from the fact that most of the field distribution is concentrated nearby the DBS electrode region (Fig. 2(a), (c)). However, as expected this high field nearby the DBS electrode does not affect the reconstructed conductivity in the agar region (Fig. 3b).Conclusion
We have demonstrated that it is possible to characterize electromagnetic properties and fields deep within the brain using DBS electrode illumination using a biological tissue phantom.Acknowledgements
This work was supported by award RF1MH114290 to RJS.References
1. Scott G C, Joy M L G and Armstrong R L et al. Measurement of nonuniform current density by magnetic resonance. IEEE Trans. Med. Imaging. 1991; 10(3): 362-74.
2. Seo J K and Woo E J. Magnetic resonance electrical impedance tomography. SIAM Rev. 2011;53(1):40-68.
3. Sajib S Z K, Oh T I, and Kim H J et al. In vivo mapping of current density distribution in brain tissues during deep brain stimulation (DBS). AIP Adv. 2017; 7(1):015004.
4. Chauhan M, Sajib S Z K and Sahu S et al. Imaging of current density distribution in deep brain stimulation (DBS). Proc. Intl. Soc. Mag. Reson. Med. 2020; 28(2020):3180.
5. Song Y, Sajib S Z K and Wang H et al. Low frequency conductivity reconstruction based on a single current injection via MREIT. Phys. Med. Biol. 2020;65(22):225016.
6. Sajib S Z K, Chauhan M and Banan G et al. Compensation of lead-wire field contributions in MREIT experiment using image segmentation: a phantom study. Proc. Intl. Soc. Mag. Reson. Med. 2019; 27(2019):5049.
7. Kim M N, Ha T Y, Woo E J et al. Improved conductivity reconstruction from muti-echo MREIT utilizing weighted voxel-specific signal-to-noise ratios. Phys. Med. Biol. 2012; 57 (11):3643-59.
8. Sajib S Z K, Kim H J and Woo E J et al. Regional absolute conductivity reconstruction using projected current density in MREIT. Phys. Med. Biol. 2012;57(18):5841-59.
9. Seo J K, Jeon K and Lee C O et al. Non-iterative harmonic Bz algorithm in MREIT. Inverse Prob. 2011; 27(8):1-12.
Figures