0739
Relationships Between 7T Basal Ganglia QSM, Volume and Clinical Manifestation of Huntington’s Disease1Department of Radiology and Biomedical Imaging, University of California San Francisco, San Francisco, CA, United States, 2Department of Neurology, University of California San Francisco, San Francisco, CA, United States
Synopsis
Huntington’s Disease (HD) is a neurodegenerative disorder with severe cognitive and motor impairment caused by abnormal cytosine-adenine-guanine (CAG) repeat expansion within the HTT gene. The goal of this study was to explore differences in iron deposition measured by quantitative susceptibility mapping (QSM) and volume of basal ganglia structures between healthy controls and patients with pre-manifest HD or early manifest HD and correlate them with clinical variables. The caudate and putamen exhibited atrophy that increased with disease severity, CAP score, and impaired motor function. Iron deposition increased with the onset of symptoms, CAP scores, and cognitive decline.
Introduction
Huntington’s Disease (HD) is an autosomal dominant neurodegenerative disorder with severe cognitive, motor, and psychiatric disturbances caused by abnormal cytosine-adenine-guanine (CAG) repeat expansion within the gene HTT. Genetic testing enables identification of patients at risk of HD and implementation of strategies to prevent or delay disease onset. Although the transition from pre-manifest (PM) or pre-symptomatic HD to early-manifest (EM) is often defined by motor abnormalities, cognitive impairment can be evident decades before a motor diagnosis is given.1 The earliest neuropathologic changes occur within the caudate and putamen,2 where prior studies have reported volumetric changes as early as 12 years prior to predicted onset3. Iron deposition, measured by quantitative susceptibility mapping (QSM),4 because it precedes structural changes, is a promising marker for disease burden that can be used to monitor clinically silent disease progression and to monitor the response to emerging therapeutic approaches. The goal of this study was to explore differences in iron deposition and atrophy in basal ganglia structures between healthy controls and patients with PM HD or EM HD and assess their relationship to motor and cognitive impairment.Methods
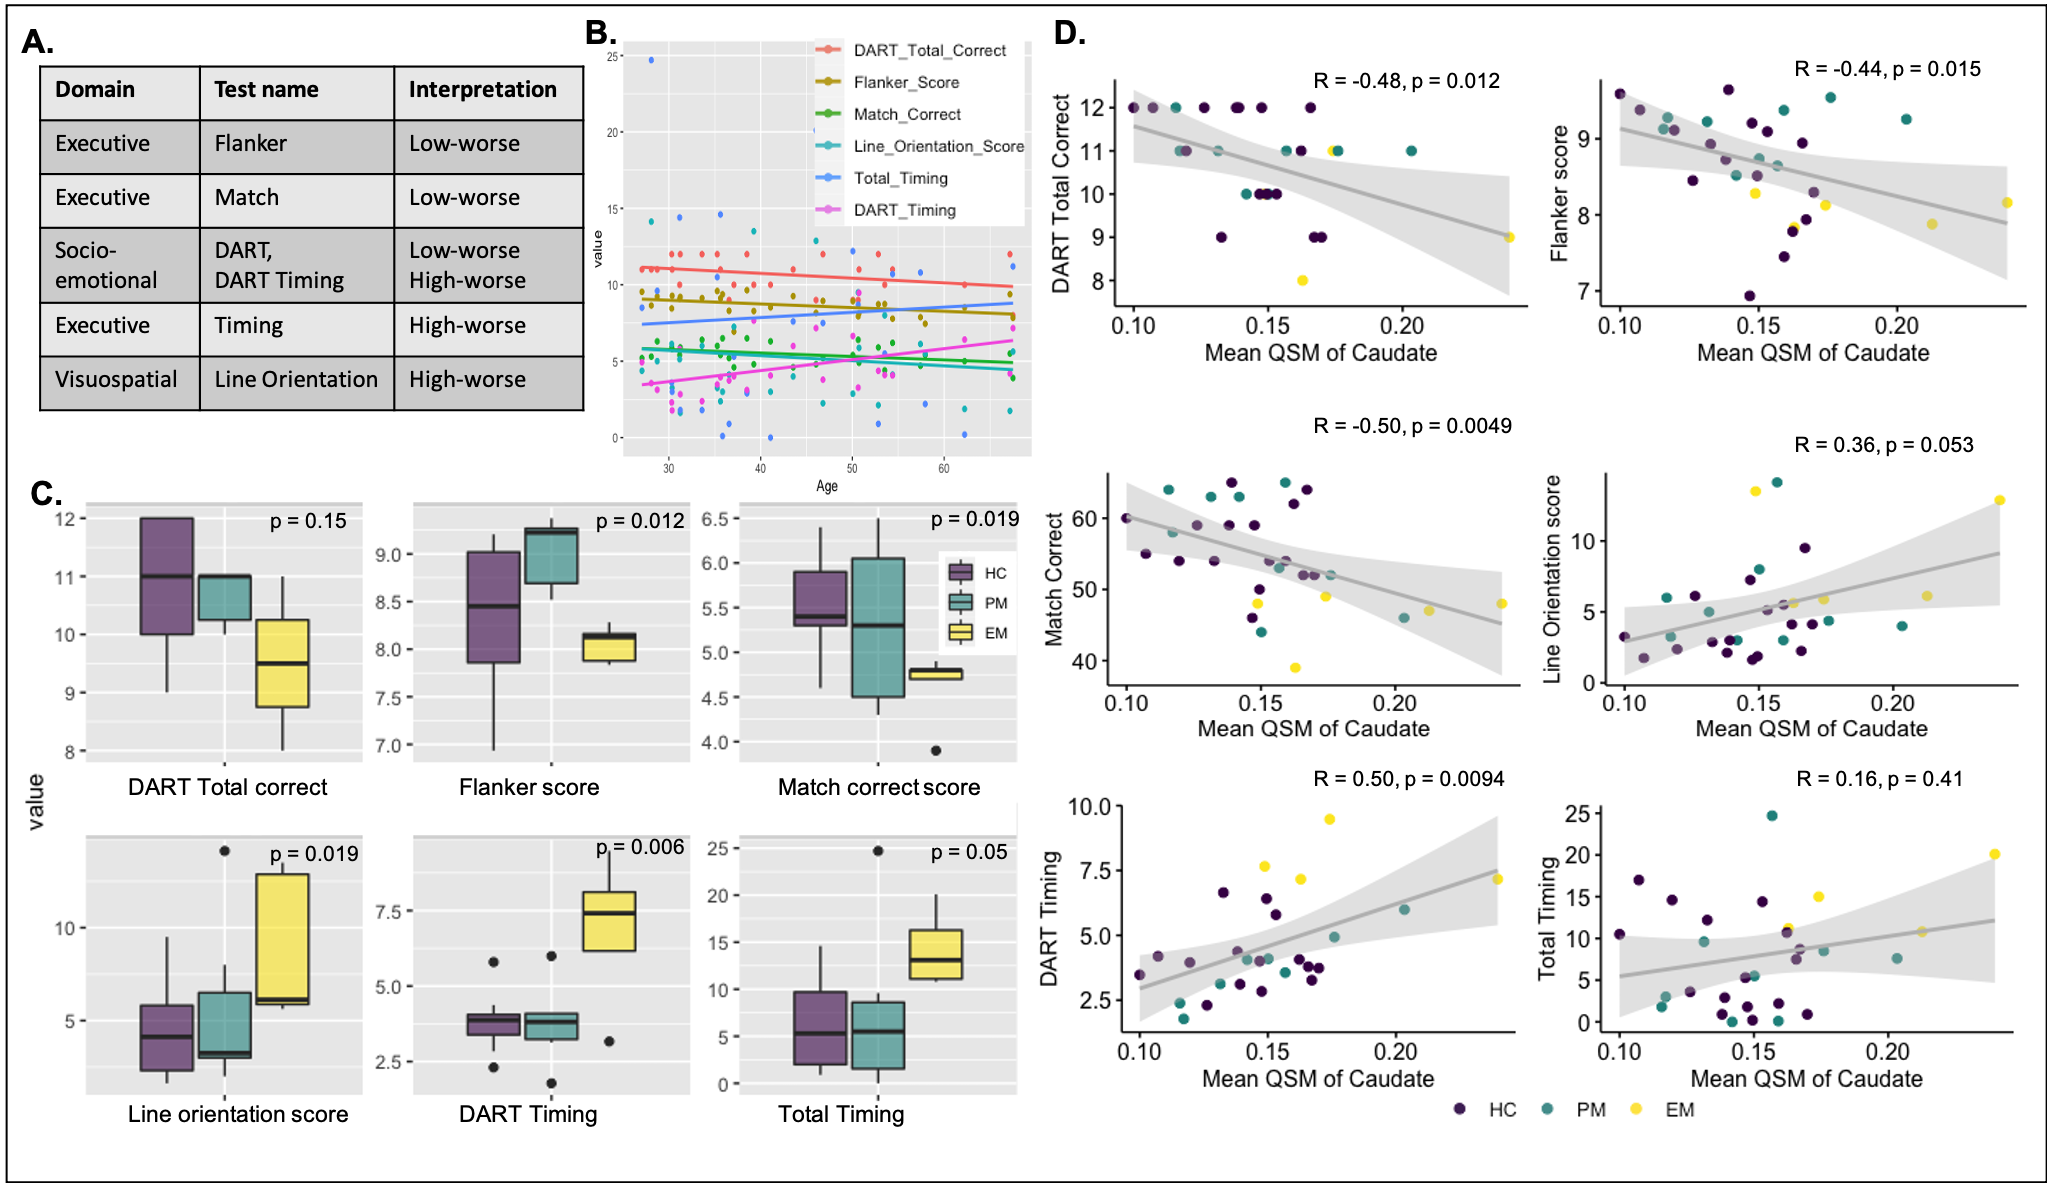
Subjects: Sixteen HTT mutation carriers (10 PM, age 35.1 ± 8.6 years; 6 EM, age 51.4 ± 9.9 years) and 20 age matched healthy controls (age 45.7 ± 12.0 years) have been recruited to this ongoing IRB-approved study. Eight carriers had follow-up MRI ~1-year following their baseline scan. All carriers had at least 40 CAG repeats. The Unified Huntington’s Disease Rating Scale (UHDRS) motor subscale was used to rate the severity of motor symptoms on a scale of 0-124, and a CAP score (CAG-Age-Product) of genetic burden was calculated using the formula CAPs = Age*(CAG-33.66)/432.33265. The Tablet-based Cognitive Assessment Tool (TabCAT)6 software platform was used to assess executive function, memory, visuospatial skills and socioemotional function (Figure 4A).MRI acquisition and QSM reconstruction: All subjects were scanned with a 3D multi-echo gradient recalled-sequence on a 7T MRI scanner (GE Healthcare) equipped with a 32-channel phase-array coil (voxel size = 0.8x0.8x1mm, 4 echoes, TE = 6/9.5/13/16.5ms, TR = 50ms, FA = 20°, bandwidth = 50kHz, FOV = 24x24x15cm, scan time=14 minutes). To generate QSM maps, raw phase images were unwrapped using 3D Laplacian-based method and V-SHARP and iLSQR algorithms were used to remove the background field and reconstruct the susceptibility maps7.
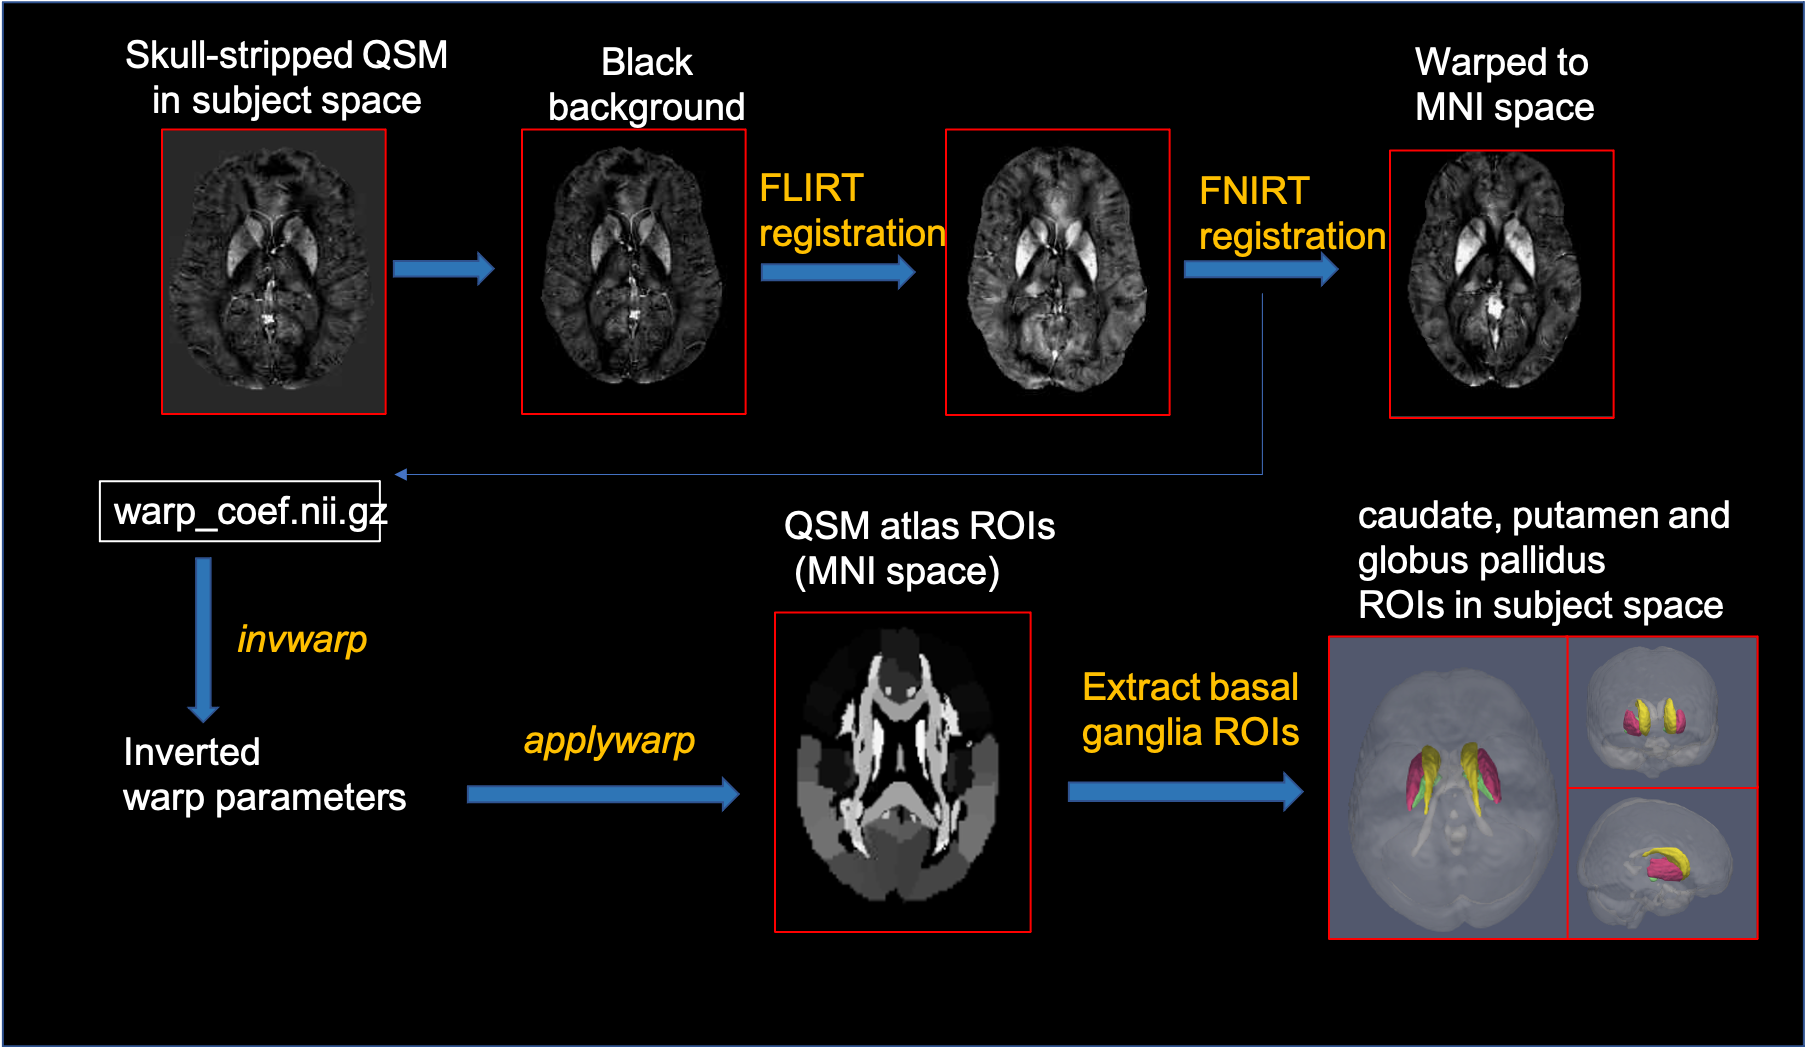
Segmentation and analysis of the basal ganglia: All QSM images were registered to a longitudinal QSM atlas8 in MNI space. The inverse transform was applied to bring the atlas ROIs back to subject space to generate individual ROIs of the bilateral caudate, putamen and globus pallidus (Figure 1). Mean susceptibility values in regions with QSM values >3 standard deviations above the mean were obtained for each ROI. The normalized volume of each ROI was calculated by multiplying by the average intracranial volume divided by the subject’s head volume. Group differences in volume and mean susceptibility were assessed for statistical significance using Wilcoxon rank sum tests, while correlations with CAP score, age, motor function, and measures of cognitive function utilized Spearman correlation.
Results
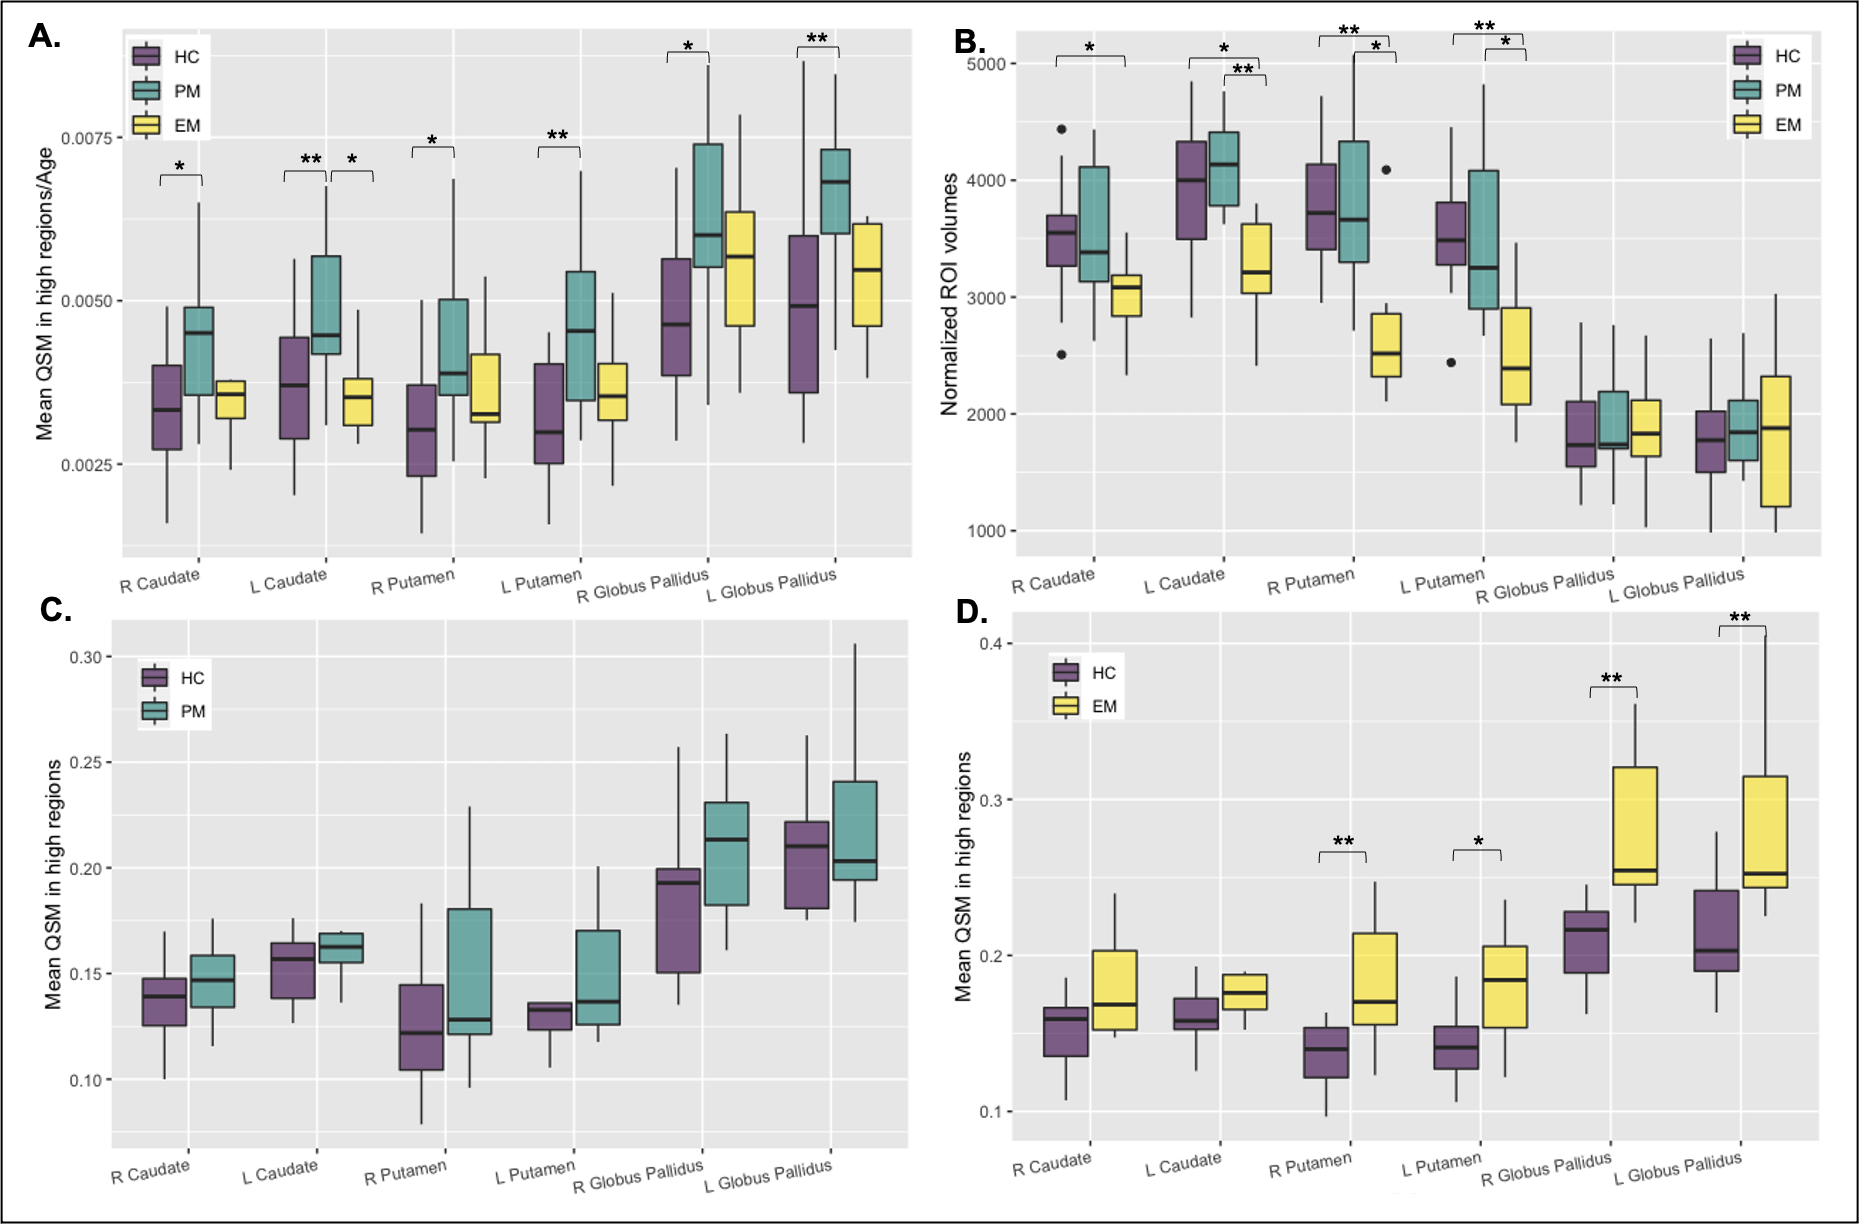
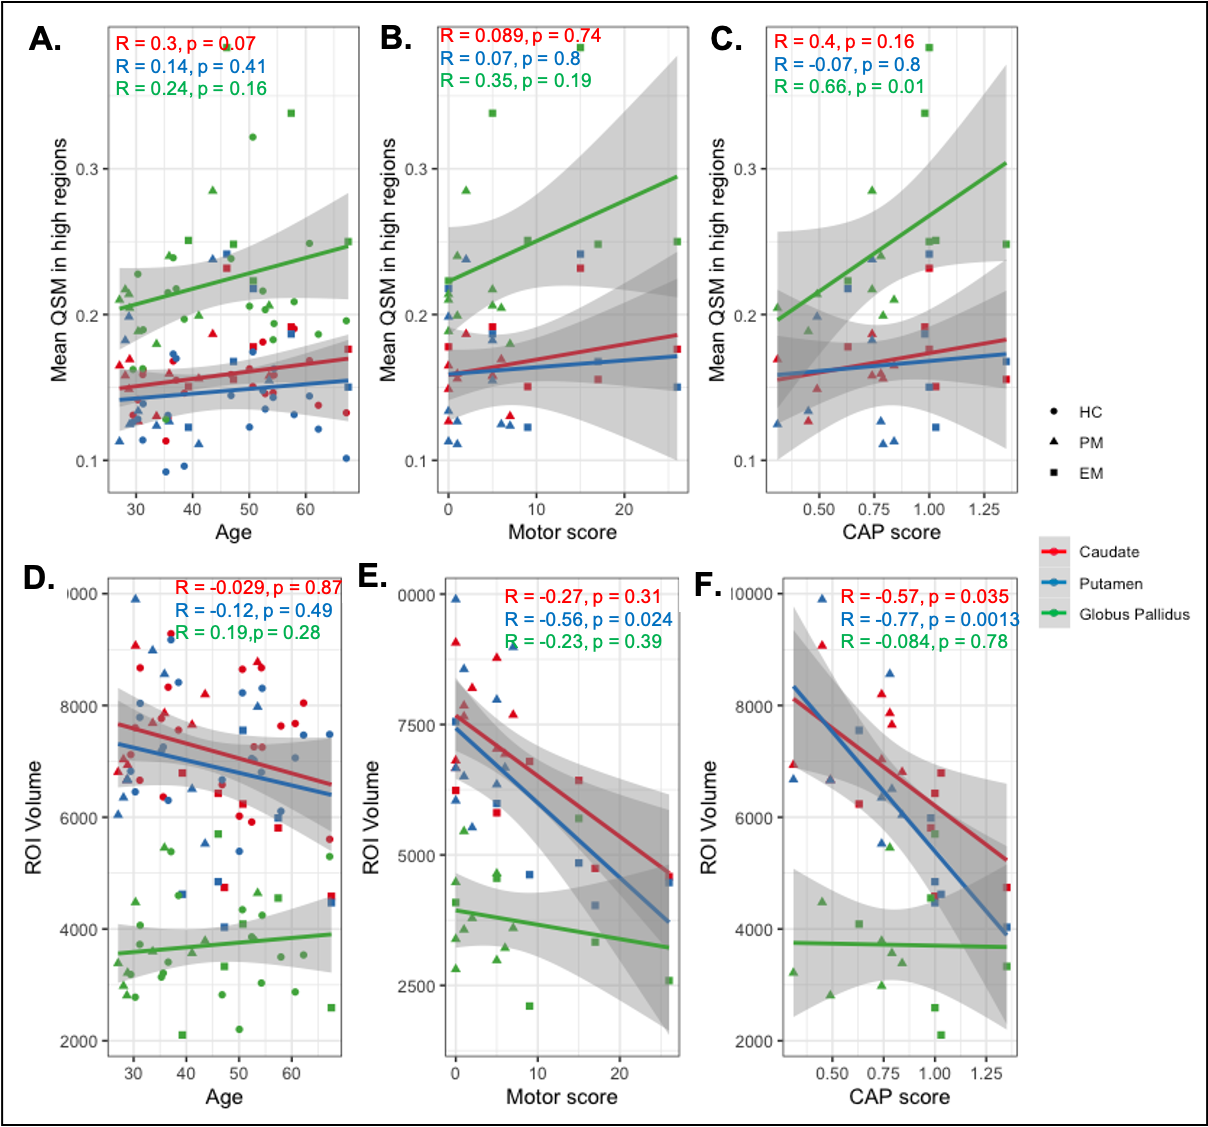
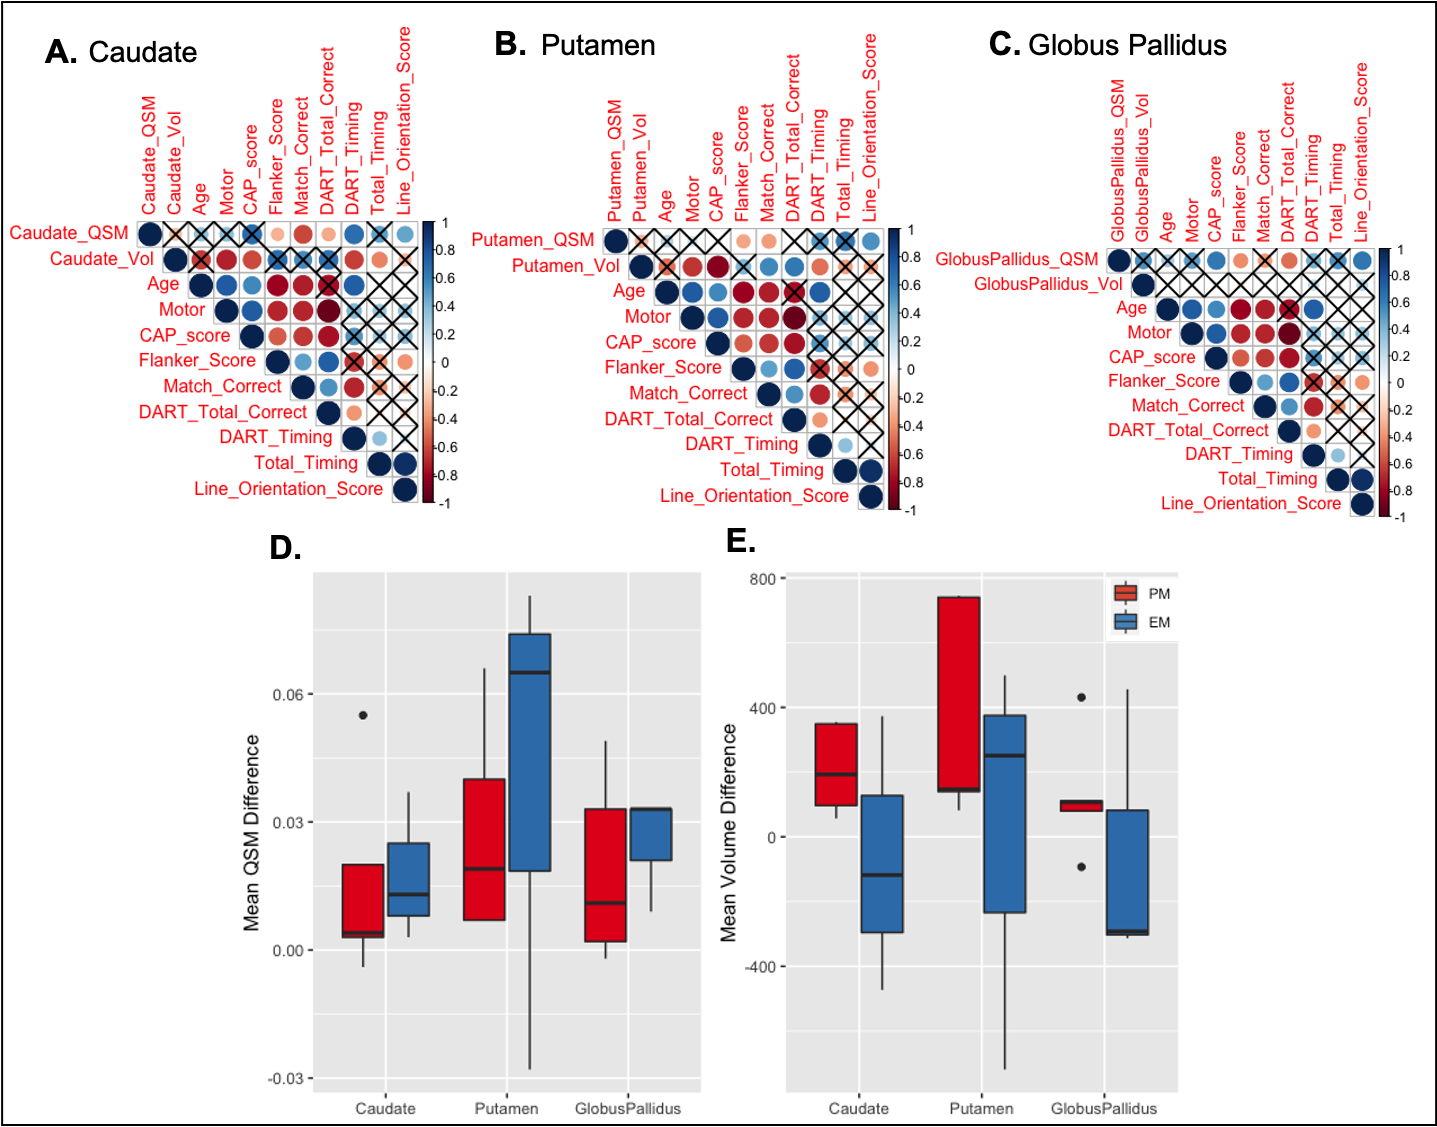
When adjusted for age, increased iron was observed for the PM group compared to both the EM and HC groups in all basal ganglia regions (Figure 2A; p<0.05 for PM vs HC). As EM patients are on average older than PM patients, healthy controls were also subdivided into two cohorts to directly pair with similarly aged individuals within each patient group. Trends of increasing iron were observed in all regions in the PM and EM groups compared with corresponding age-matched controls (Figures 2C, D). EM patients also exhibited significantly more iron in the globus pallidus than the caudate and putamen (Figure 2D). As expected, the caudate and putamen had lower volume in both the PM and EM groups compared to HCs (Figure 2B). Volumetric differences did not correlate with the heightened iron observed, suggesting different underlying pathologies. Lower caudate and putamen volume, however, were significantly associated with CAP score and motor function in the putamen (Figure 3D-F; p<0.05), whereas mean elevated QSM values in the globus pallidus only were significantly associated with CAP score (Figure 3A-C; p<0.01).Cognitive test scores representing executive, visuospatial, and socioemotional function were also significantly different among groups (Figure 4C) and correlated with iron deposition within the caudate (Figure 4D). Only DART timing and the Flanker score correlated with age (Figure 4B). Figure 5A-C summarizes the correlograms for all variables assessed. In the 8 patients with serial scans (Figure 5D, E), increases in iron deposition and atrophy over time were more pronounced in the EM group.
Conclusions
We found varying levels of atrophy and iron deposition in basal ganglia structures in patients with HD. Although atrophy was found primarily in the caudate and putamen and increased with disease severity, CAP score, and impaired motor function, iron deposition within the globus pallidus also increased with the onset of symptoms, CAP scores, and cognitive decline. These findings suggest that measures of brain atrophy and iron deposition in the basal ganglia could aid early detection of disease progression in HD. Our ongoing work will further explore the utility of these imaging biomarkers in a multiparametric fashion.Acknowledgements
This work was supported by NINDS grant R01NS099564.References
1. Paulsen JS. Cognitive impairment in Huntington disease: diagnosis and treatment. Curr Neurol Neurosci Rep. 2011;11(5):474-483.
2. Tabrizi SJ, Scahill RI, Durr A, et al. Biological and clinical changes in premanifest and early-stage Huntington's disease in the TRACK-HD study: the 12-month longitudinal analysis. Lancet Neurol. 2011; 10, 31–42.
3. Aylward EH, Li Q, Stine OC, et al. Longitudinal change in basal ganglia volume in patients with Huntington's disease. Neurology. 1997; 48:394–399.
4. Deistung A, Schäfer A, Schweser F, et al. Toward in vivo histology: a comparison of quantitative susceptibility mapping (QSM) with magnitude-, phase-, and R2*-imaging at ultra-high magnetic field strength. Neuroimage. 2013; 65:299–314.
5. Zhang Y, Long JD, Mills JA, et al. Indexing disease progression at study entry with individuals at-risk for Huntington disease. Am J Med Genet B Neuropsychiatr Genet. 2011; 156B(7):751-763.
6. Possin KL, Moskowitz T, Erlhoff SJ, et al. The Brain Health Assessment for detecting and diagnosing neurocognitive disorders. J Am Geriatr Soc. 2018; 66(1):150‐156.
7. Y. Chen, A. Jakary, S. Avadiappan, C. P. Hess, and J. M. Lupo, “QSMGAN: improved quantitative susceptibility mapping using 3d generative adversarial networks with increased receptive field,” NeuroImage, 2020; vol.207.
8. Zhang Y, Wei H, Cronin MJ, He N, Yan F, Liu C. Longitudinal atlas for normative human brain development and aging over the lifespan using quantitative susceptibility mapping, NeuroImage. 2018; 171:176–189.
Figures