0738
Validation and Application of a Novel Anisotropic MRE Reconstruction Method
Renee Miller1, Rob Lloyd2, Daniel Fovargue1, Behzad Babei2, Lauriane Juge2,3, Ralph Sinkus1, David Nordsletten1,4, and Lynne Bilston2,3
1Biomedical Engineering and Imaging Sciences, Kings College London, London, United Kingdom, 2Neuroscience Research Australia, Sydney, Australia, 3Faculty of Medicine, University of New South Wales, Sydney, Australia, 4University of Michigan, Ann Arbor, MI, United States
1Biomedical Engineering and Imaging Sciences, Kings College London, London, United Kingdom, 2Neuroscience Research Australia, Sydney, Australia, 3Faculty of Medicine, University of New South Wales, Sydney, Australia, 4University of Michigan, Ann Arbor, MI, United States
Synopsis
Due to their structure and composition, many biological tissues have been shown to be anisotropic. MRE, a non-invasive tool used to measure the stiffness of tissue, has previously been used to diagnose and track disease progression based on tissue stiffness changes. This work presents a robust and novel method for estimating anisotropic stiffness utilising harmonic displacements from MRE and material orientations from DTI. The method was verified using in silico experiments and applied to in vivo imaging data of the lower leg muscles in volunteers. In vivo stiffness estimates show changes in anisotropic stiffness with changes in passive muscle stretch.
Introduction
Magnetic resonance elastography (MRE) requires accurate reconstruction methods, which inherently assume the underlying material behaviour (e.g. linear, viscoelastic, isotropic). While most MRE applications treat tissue as isotropic, evidence for anisotropy has been observed in tissues such as skeletal muscle, myocardium and white matter in the brain. For example, skeletal muscle has been shown to have the greatest stiffness along the muscle fibre orientation1,2. Additionally, isotropic tissue, such as liver, may become anisotropic under compressive loads3. Some pathologies may affect the tissue composition and structure and, hence, only impact the tissue in a single direction. Therefore, anisotropic MRE reconstruction methods are necessary to better understand healthy and pathological properties.In one previous approach for estimating anisotropic properties from MRE, filters were used to extract waves propagating in the direction of fibres4. However, this method is prone to bias in complex wave fields. Another reconstruction method solved the transversely isotropic linear viscoelastic wave equation, using a finite difference scheme and material orientations defined by diffusion tensor imaging (DTI)5. While comprehensive, this method requires extremely high-quality data and assumes commutative properties of the microstructural variations. In this study, a novel and robust anisotropic MRE reconstruction method is presented which integrates DTI and MRE data, and allows for inclusion of multiple MRE acquisitions, to estimate anisotropic viscoelastic properties.
Methods
The finite element-based reconstruction method presented in Fovargue et al.6 has been extended to estimate transversely isotropic material properties. The method (a) parameterizes local rotations of the material axis to circumvent commutative assumptions about the local fibre orientations, (b) uses divergence-free test functions to isolate the shear component of waves, and (c) allows for the use of multiple wave fields, which may improve the estimation of anisotropic parameters. A systematic in silico analysis was performed on a phantom cube (Figure 1a) in which the sensitivity to different wave loads, noise in the wave data, noise in the fibre field, fibre complexity, varying viscosity values and number of wave fields used in the reconstruction was investigated. In each in silico phantom experiment, five parameters were estimated including three in the inner anisotropic region: G’║, G’Ʇ and G1", as well as two in the isotropic region: G’ and G2". For conciseness, only a representative subset of results is presented.The anisotropic reconstruction method was also applied to in vivo MRE data acquired in the lower leg for six healthy subjects. In order to provide consistent and robust fibre orientations across the muscle for the anisotropic reconstruction, image registration and tractography were used to assign muscle fibre directions in each image voxel. Anisotropic properties were estimated for the tibialis anterior (TA), soleus (SOL) and medial gastrocnemius (MG) muscles in three positions: (1) plantarflexion, (2) neutral and (3) dorsiflexion (Figure 2). Stiffness estimates for both the in silico and in vivo experiments were compared to a previous difference-based approach7 which utilised both the curl to isolate shear waves as well as rotation of the momentum equations.
Results
Stiffness estimates from the proposed method illustrate an improved robustness when compared to the previous curl-based approach (Figure 3). Variability in estimated parameters was noticeably smaller, particularly in the presence of noise in the displacement data. Additionally, viscosity estimates (G1" and G2") improved in accuracy with the current approach. With added noise, G’║ was somewhat underestimated whereas estimates of G’Ʇ (as well as viscosity estimates) were minimally impacted using the proposed method. With increasing noise in the fibre orientation (Figure 4), estimates of G’║ decreased whereas estimates of G’Ʇ increased, thus underestimating the degree of anisotropy. This test illustrates the importance of accurate fibre orientations when reconstructing anisotropic material parameters.Qualitatively, differences can be observed between G’║ and G’Ʇ in each muscle group in vivo, demonstrated in stiffness maps in Figure 5a. Figure 5b shows the changes in muscle stiffness (mean ± 95CI) when muscles are stretched by rotating the ankle in six healthy subjects. On average, the transverse shear modulus (G’Ʇ) was stiffer in the TA during plantarflexion than while in a neutral position (ANOVA, ΔG’Ʇ = 0.30 kPa, P = 0.002). Whereas, in the SOL (ANOVA, ΔG’Ʇ = 0.27kPa, P < 0.001) and MG (ANOVA, ΔG’Ʇ = 0.33kPa, P = 0.005), the transverse shear modulus (G’Ʇ) was stiffer during dorsiflexion than in plantarflexion. When comparing the two methods, the current reconstruction method resulted in higher estimates of G’║, which were likely underestimated in the curl-based approach.
Discussion and Conclusions
Using a combination of in silico phantom experiments, we have demonstrated that the proposed finite element-based approach accurately estimates the mechanical properties of transversely isotropic materials with minimal bias in the presence of typical levels of experimental noise in both displacement and fibre direction. Both the variance and bias in estimated parameters was shown to be smaller with this method than an existing curl-based approach.Applied to in vivo MRE and DTI data of the lower leg, the method was able to distinguish differences in stiffness between individual muscles in different states of passive tension, consistent with well-known properties of muscles. This study demonstrates the robustness of a novel anisotropic MRE reconstruction method and its applicability to in vivo MRE experiments.
Acknowledgements
This research was supported by a Discovery grant from the Australian Research Council (DP160100061). L.E.B. is supported by senior research fellowships from the National Health and Medical Research Council of Australia (APP1077934, APP1172988). D.N. would like to acknowledge funding from Engineering and Physical Sciences Research Council (EP/N011554/1 and EP/R003866/1).References
- Guo, J., Hirsch, S., Scheel, M., Braun, J., & Sack, I. (2015). Three-parameter shear wave inversion in MR elastography of incompressible transverse isotropic media: Application to in vivo lower leg muscles. Magnetic Resonance in Medicine, 75(4), 1537–1545.
- Green, M. A., Geng, G., Qin, E., Sinkus, R., Gandevia, S. C., & Bilston, L. E. (2013). Measuring Anisotropic Muscle Stiffness Properties Using Elastography. NMR in Biomedicine, 26(11), 1387–1394.
- Capilnasiu, A., Hadjicharalambous, M., Fovargue, D., Patel, D., Holub, O., Bilston, L., Nordsletten, D. (2019). Magnetic resonance elastography in nonlinear viscoelastic materials under load. Biomechanics and Modeling in Mechanobiology, 18(1), 111–135.
- Romano, A., Scheel, M., Hirsch, S., Braun, J., & Sack, I. (2012). In vivo waveguide elastography of white matter tracts in the human brain. Magnetic Resonance in Medicine, 68(5), 1410–1422.
- Qin, E. C., Sinkus, R., Geng, G., Cheng, S., Green, M., Rae, C. D., & Bilston, L. E. (2013). Combining MR elastography and diffusion tensor imaging for the assessment of anisotropic mechanical properties: a phantom study. Journal of Magnetic Resonance Imaging, 37(1), 217–226.
- Fovargue, D., Kozerke, S., Sinkus, R., & Nordsletten, D. (2018). Robust MR elastography stiffness quantification using a localized divergence free finite element reconstruction. Medical Image Analysis, 44, 126–142.
- Qin, E. C., Sinkus, R., Geng, G., Cheng, S., Green, M., Rae, C. D., & Bilston, L. E. (2013). Combining MR elastography and diffusion tensor imaging for the assessment of anisotropic mechanical properties: a phantom study. Journal of Magnetic Resonance Imaging, 37(1), 217–226.
Figures
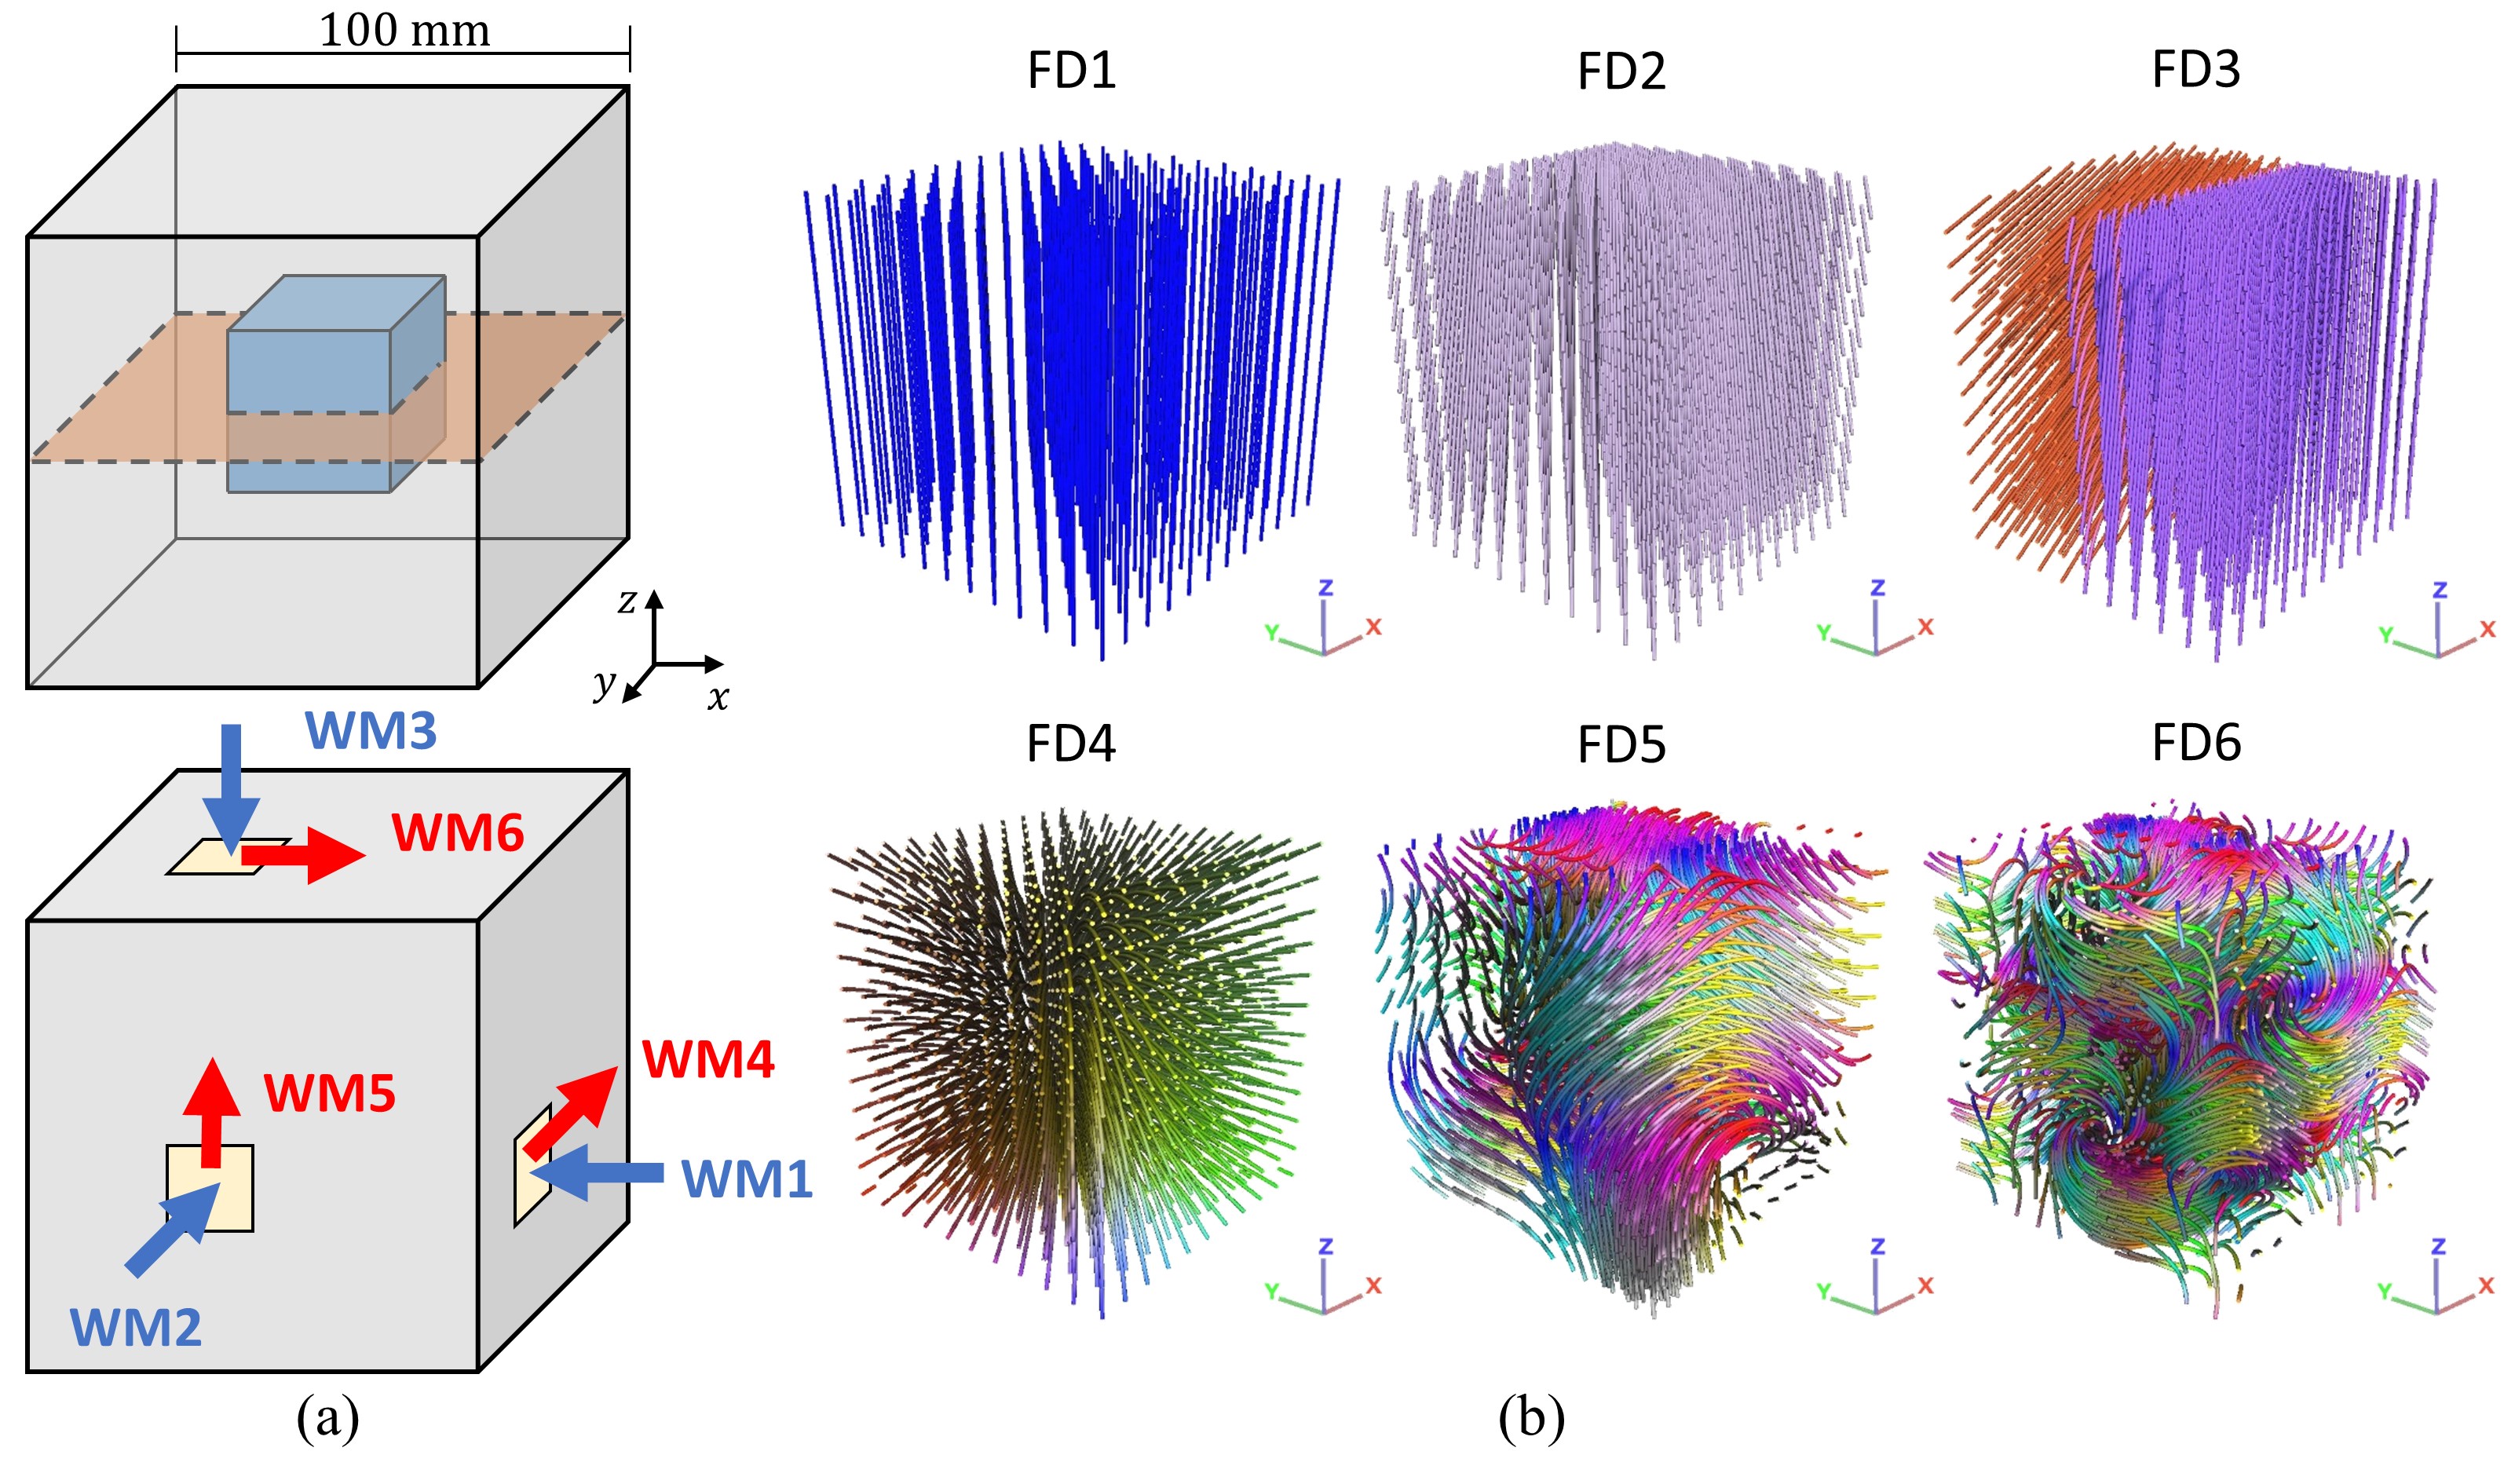
Diagrams of the computational domain used for the in silico phantom. (a) The smaller cube of transversely isotropic
material is centred within a larger cube made of an isotropic material. The
orange slice represents the in silico
imaging plane shown in the results shown in Figure 3. The location and types of
boundary conditions are shown. Wave motions 1-3 (blue) are applied compression,
whereas 4-6 (red) correspond to applied shear displacements. (b) Six fibre distributions
(FD1 – FD6) within the anisotropic inner cube with varying complexity were
tested.
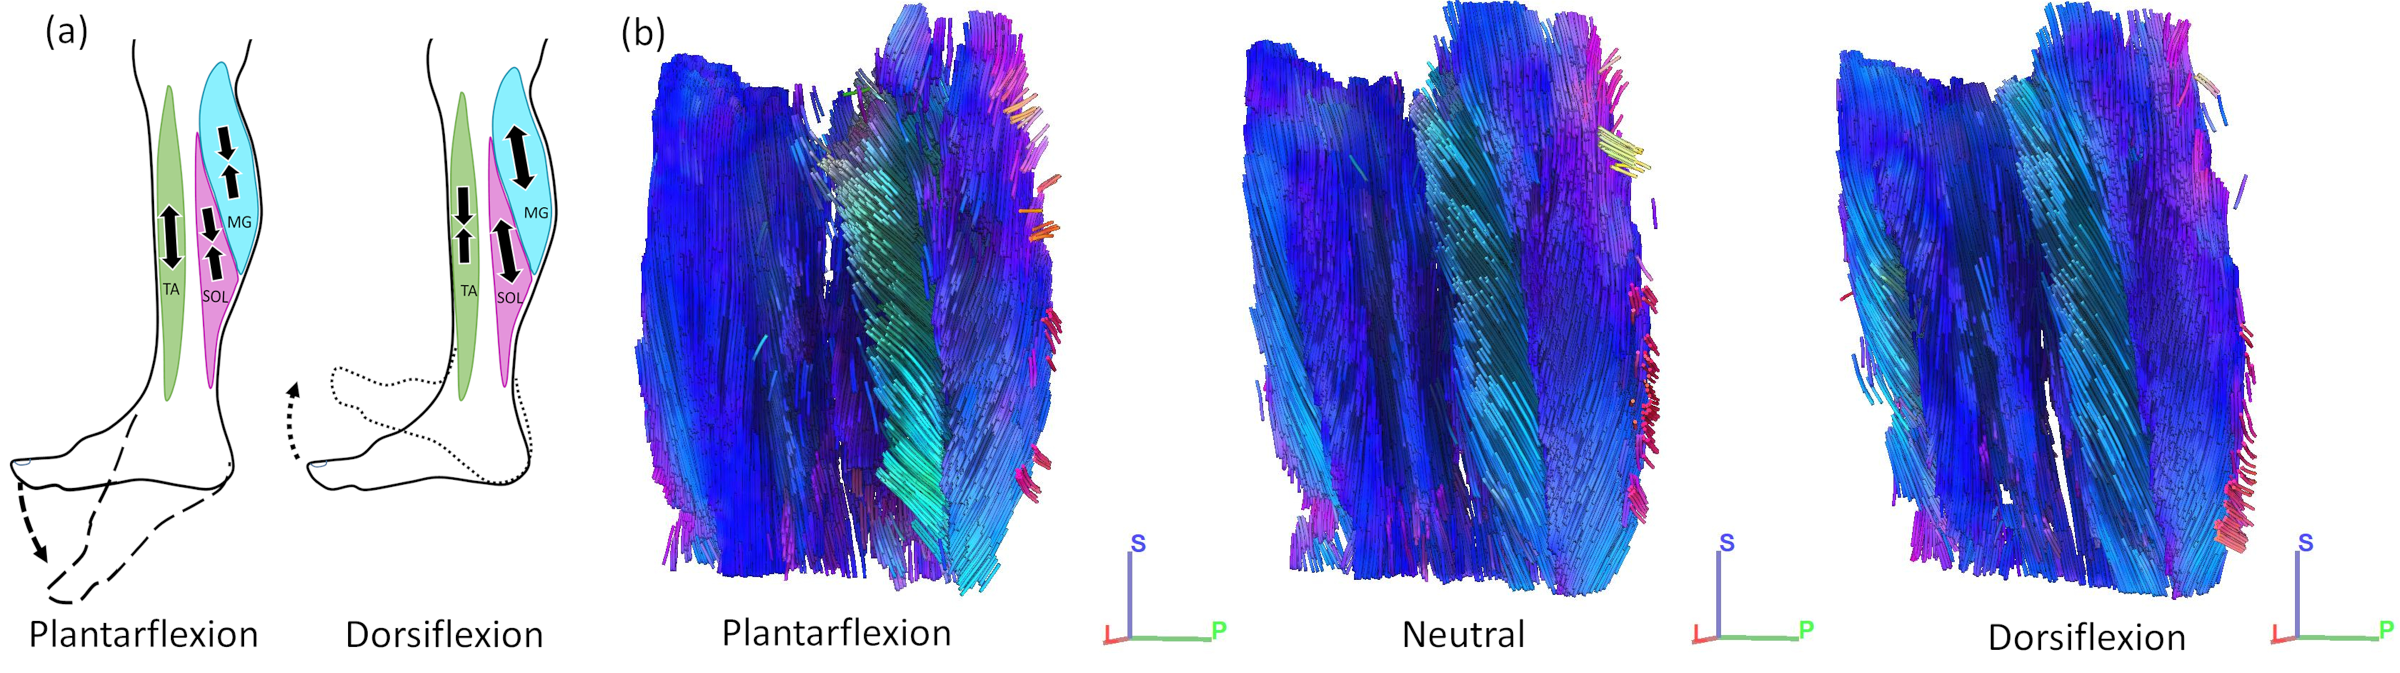
(a) A schematic demonstrating how ankle position stretches muscles. When
the foot is plantarflexed (pushed away from the body), the TA is put under
tension, whereas the SOL and MG are unloaded. With the foot in dorsiflexion,
the TA is unloaded, but the SOL and MG are in tension. (b) Images of the muscle
fibre directions when the ankle is in a plantarflexed, neutral and dorsiflexed
position. Note that the muscles are mostly oriented in the superior-inferior
(blue), and anterior-posterior (green) directions. When in tension, the fibres
elongate in the superior-inferior direction.
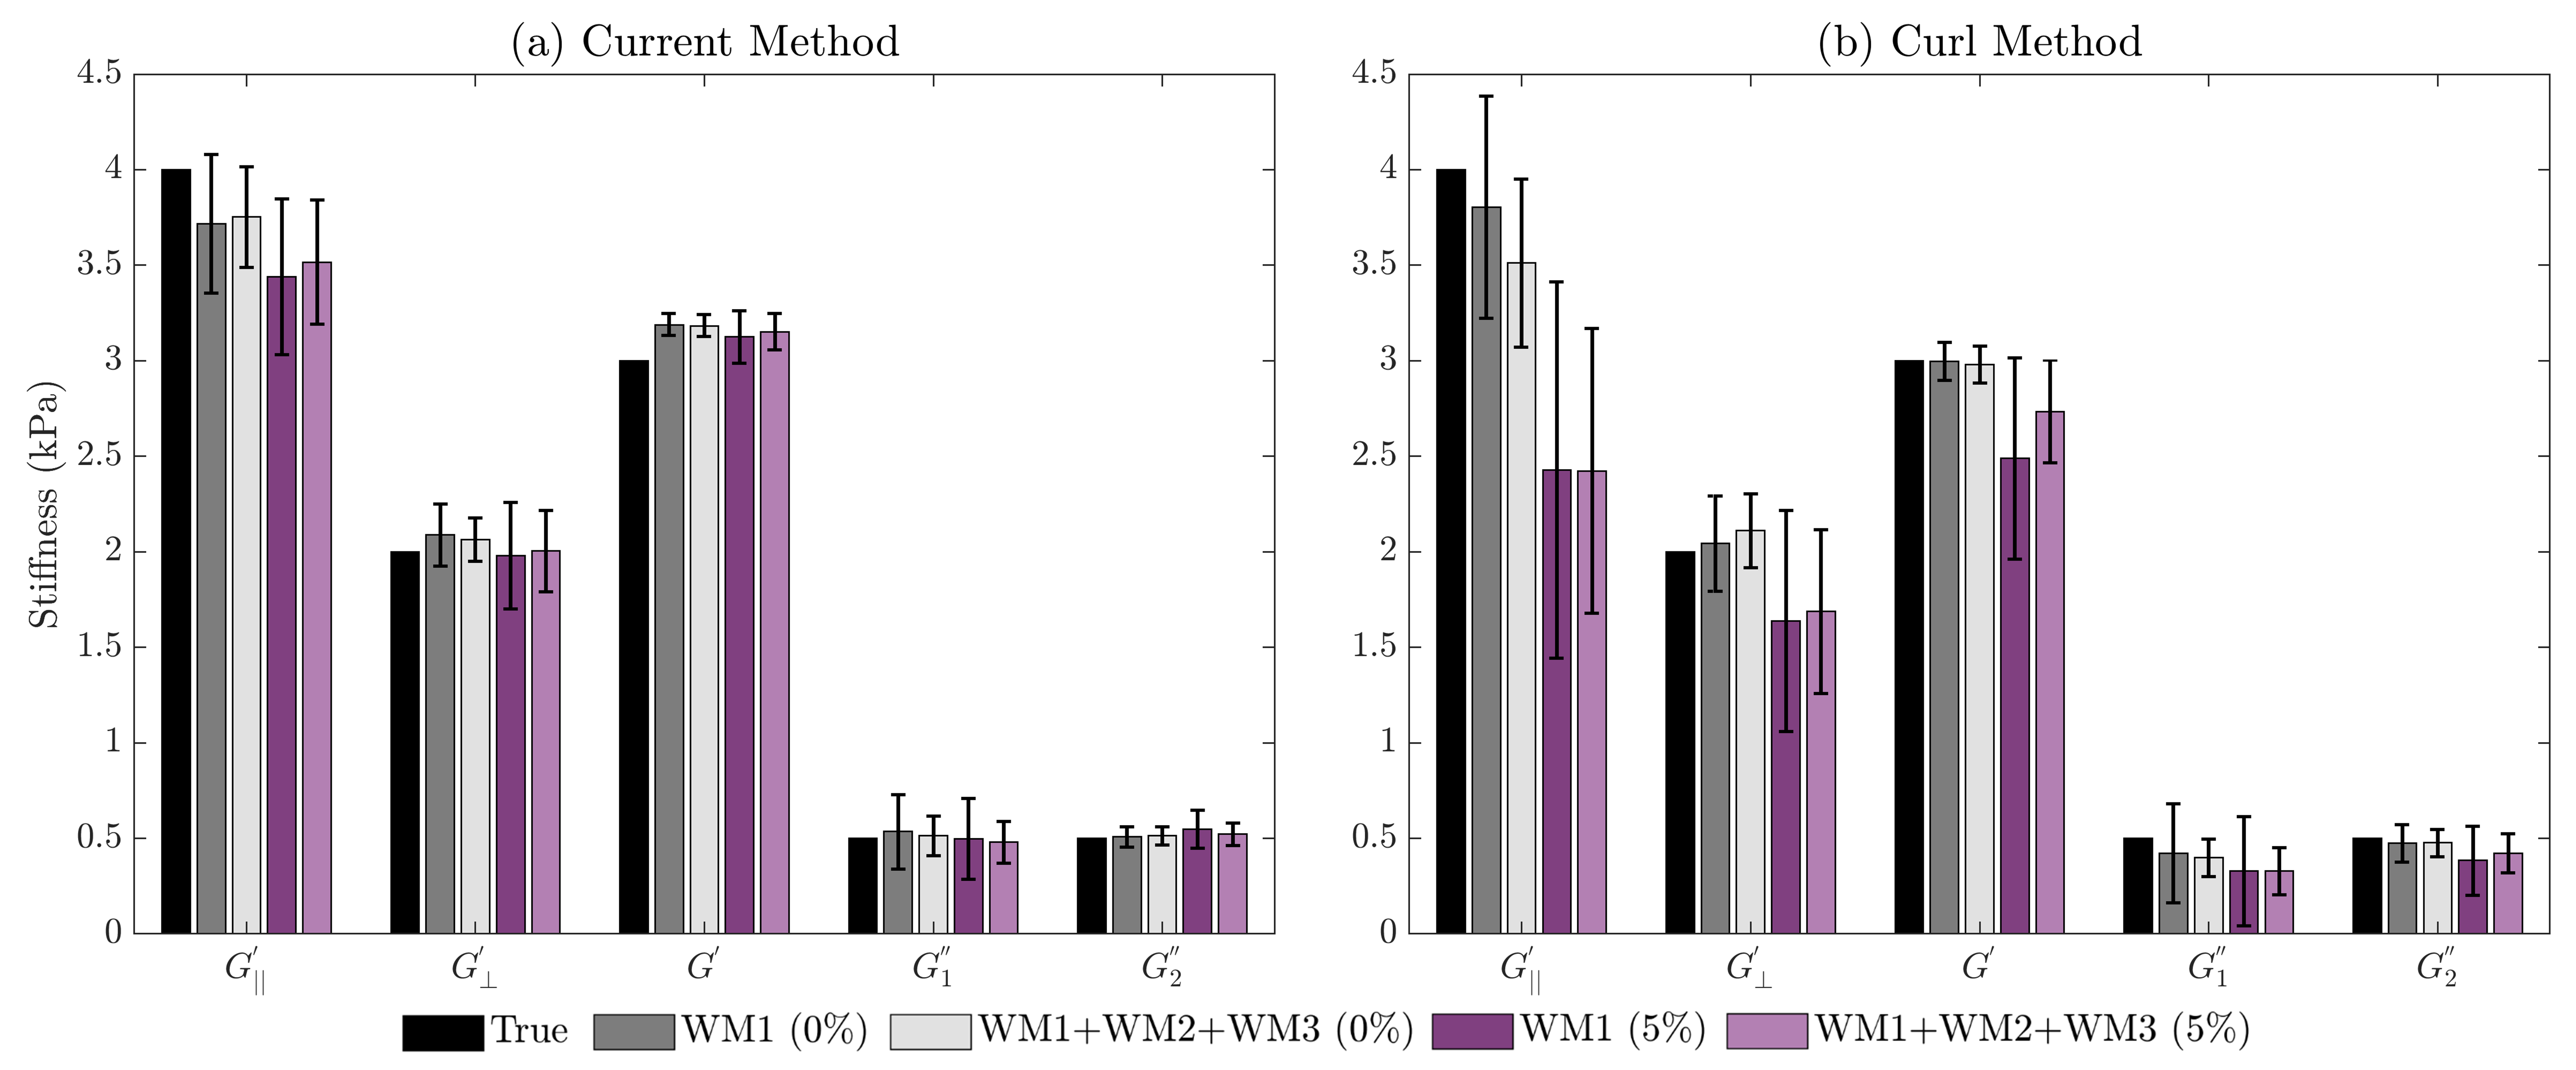
Bar chart illustrating the mean estimated parameters ± one standard
deviation using FD4 with both the (a) current and (b) previous curl-based
methods. Results are shown for WM1 with no noise (0%), WM1+WM2+WM3 with no
noise (0%), WM1 with 5% noise added to the wave data and WM1+WM2+WM3 with 5%
noise added to the wave data. Ground truth values as shown in black.
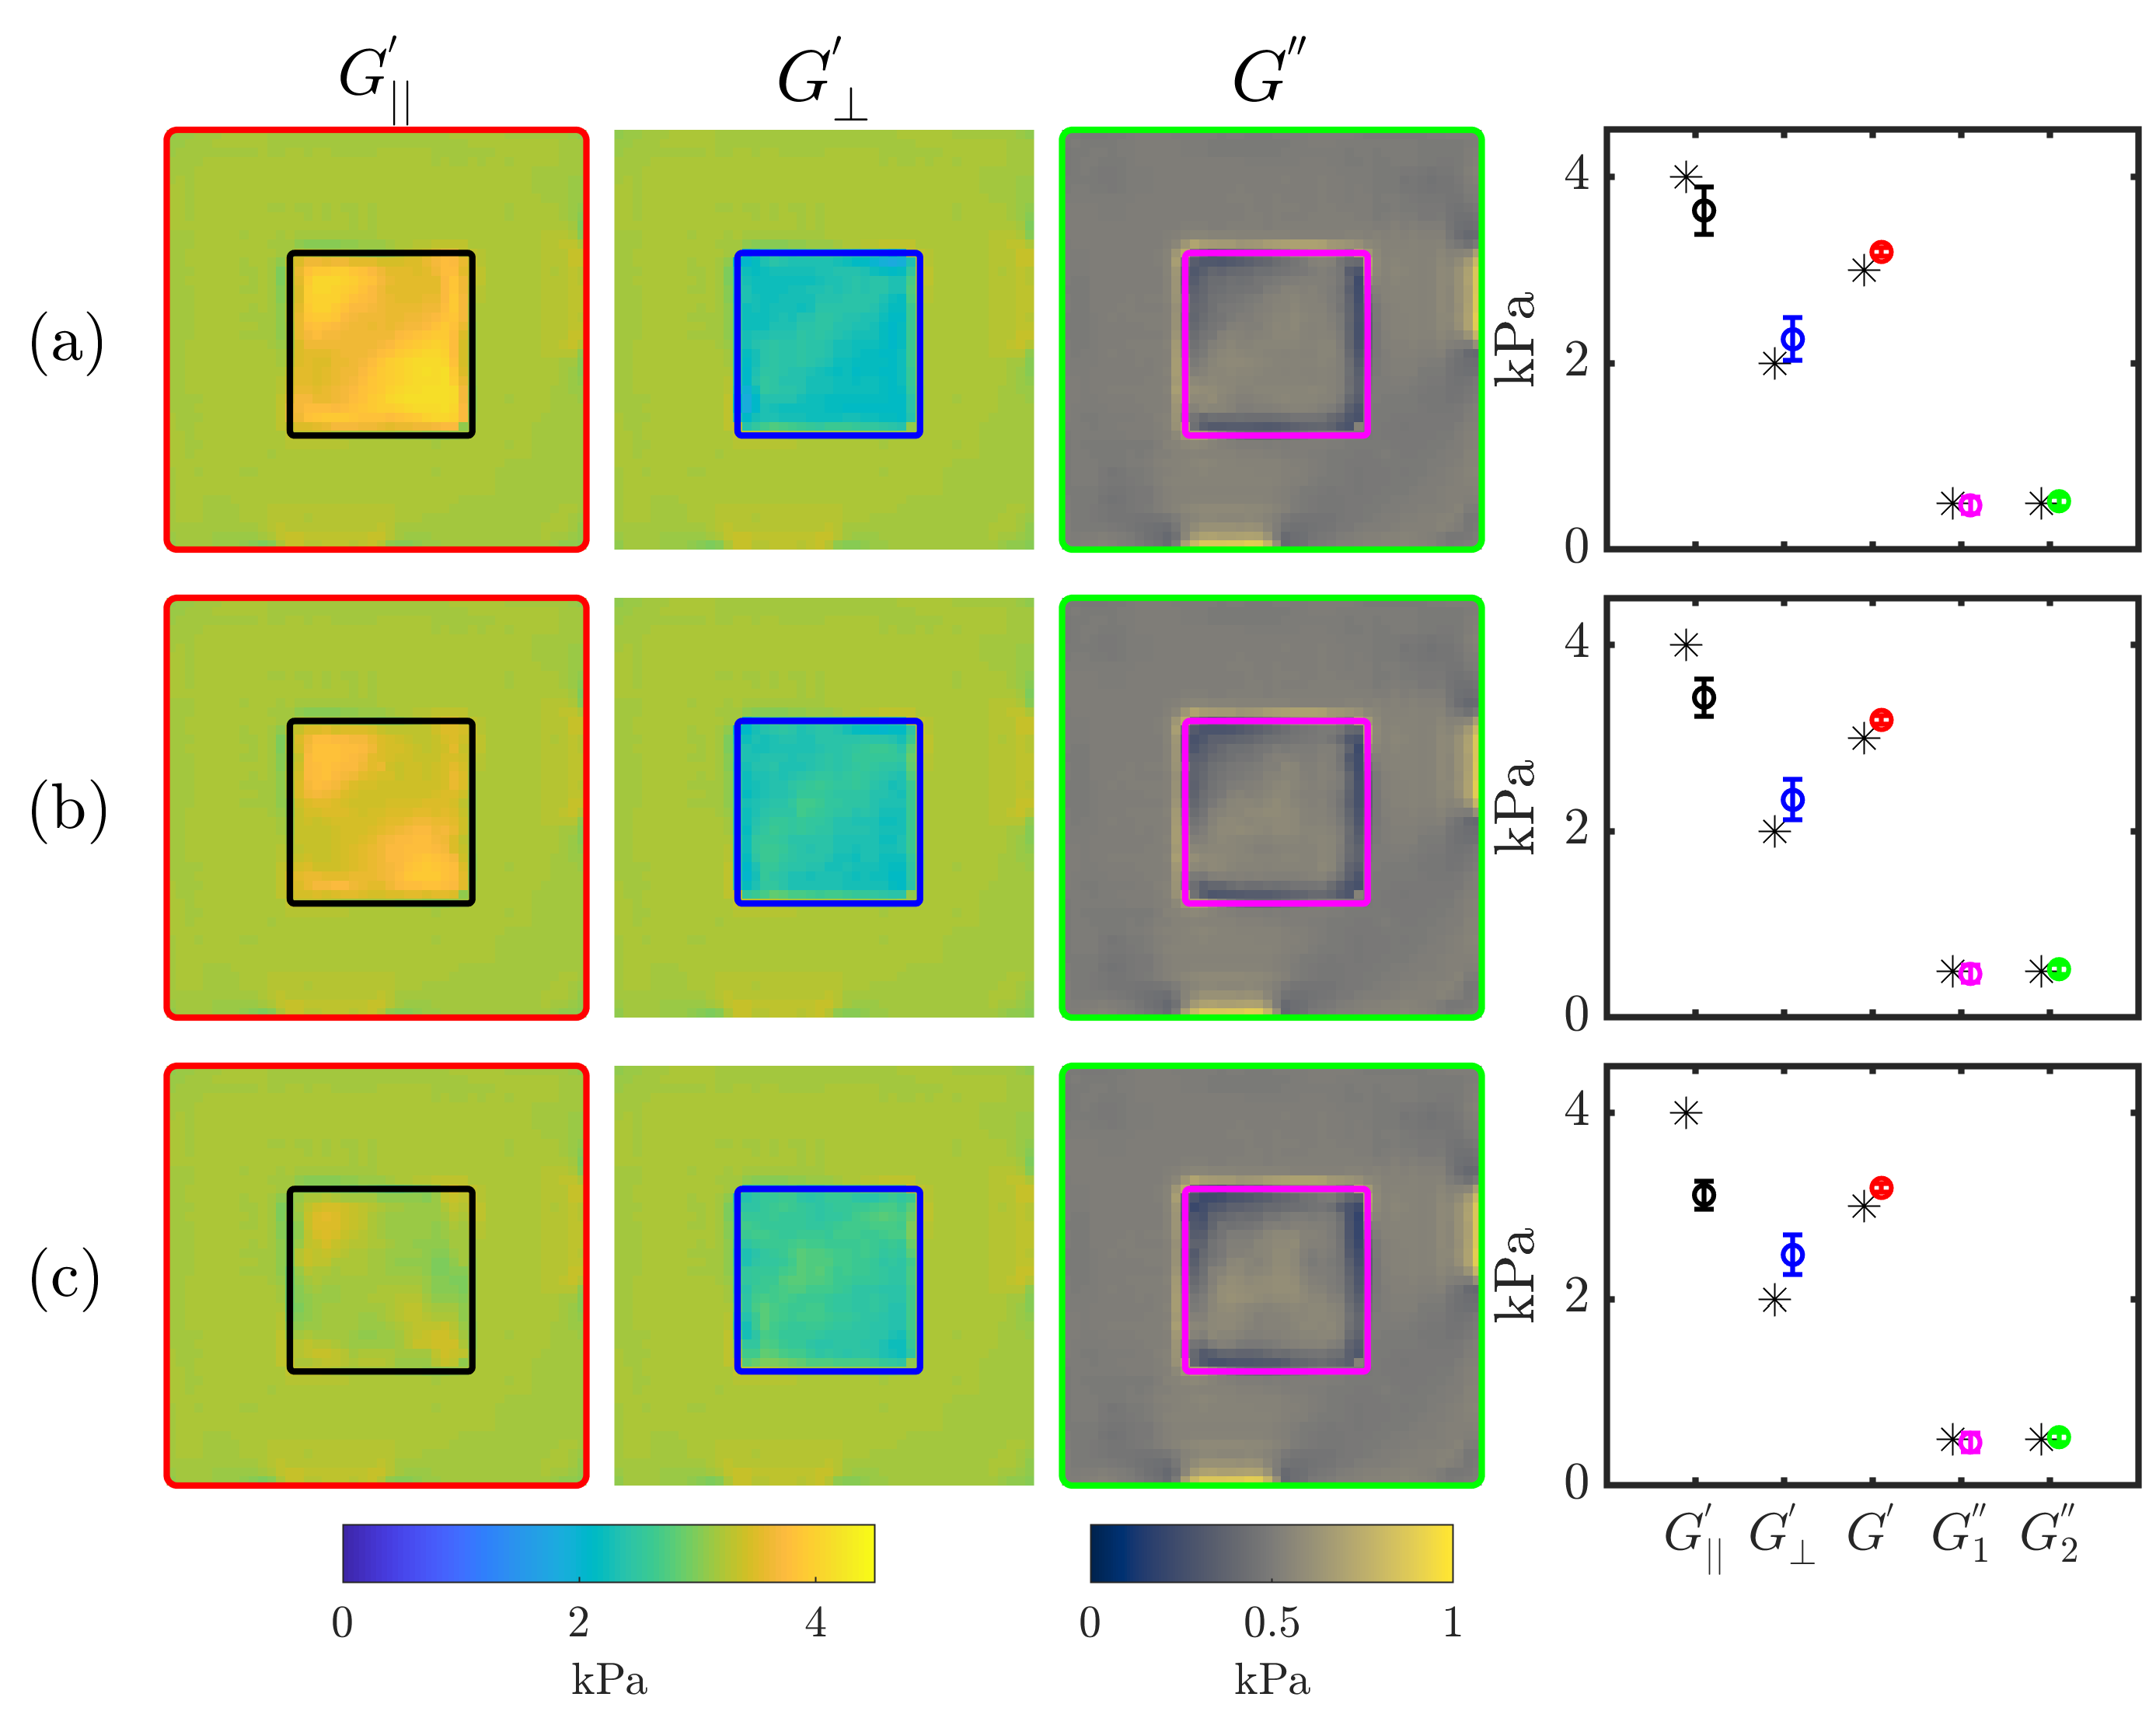
Stiffness maps with FD2 and three wave modes (WM1 + WM2 + WM3) where
uniform random noise was added to each component of the fibre vectors, σ = (a)
0.05, (b) 0.1 or (c) 0.2. Coloured error bars correspond to values enclosed in
the corresponding coloured box in the stiffness maps.
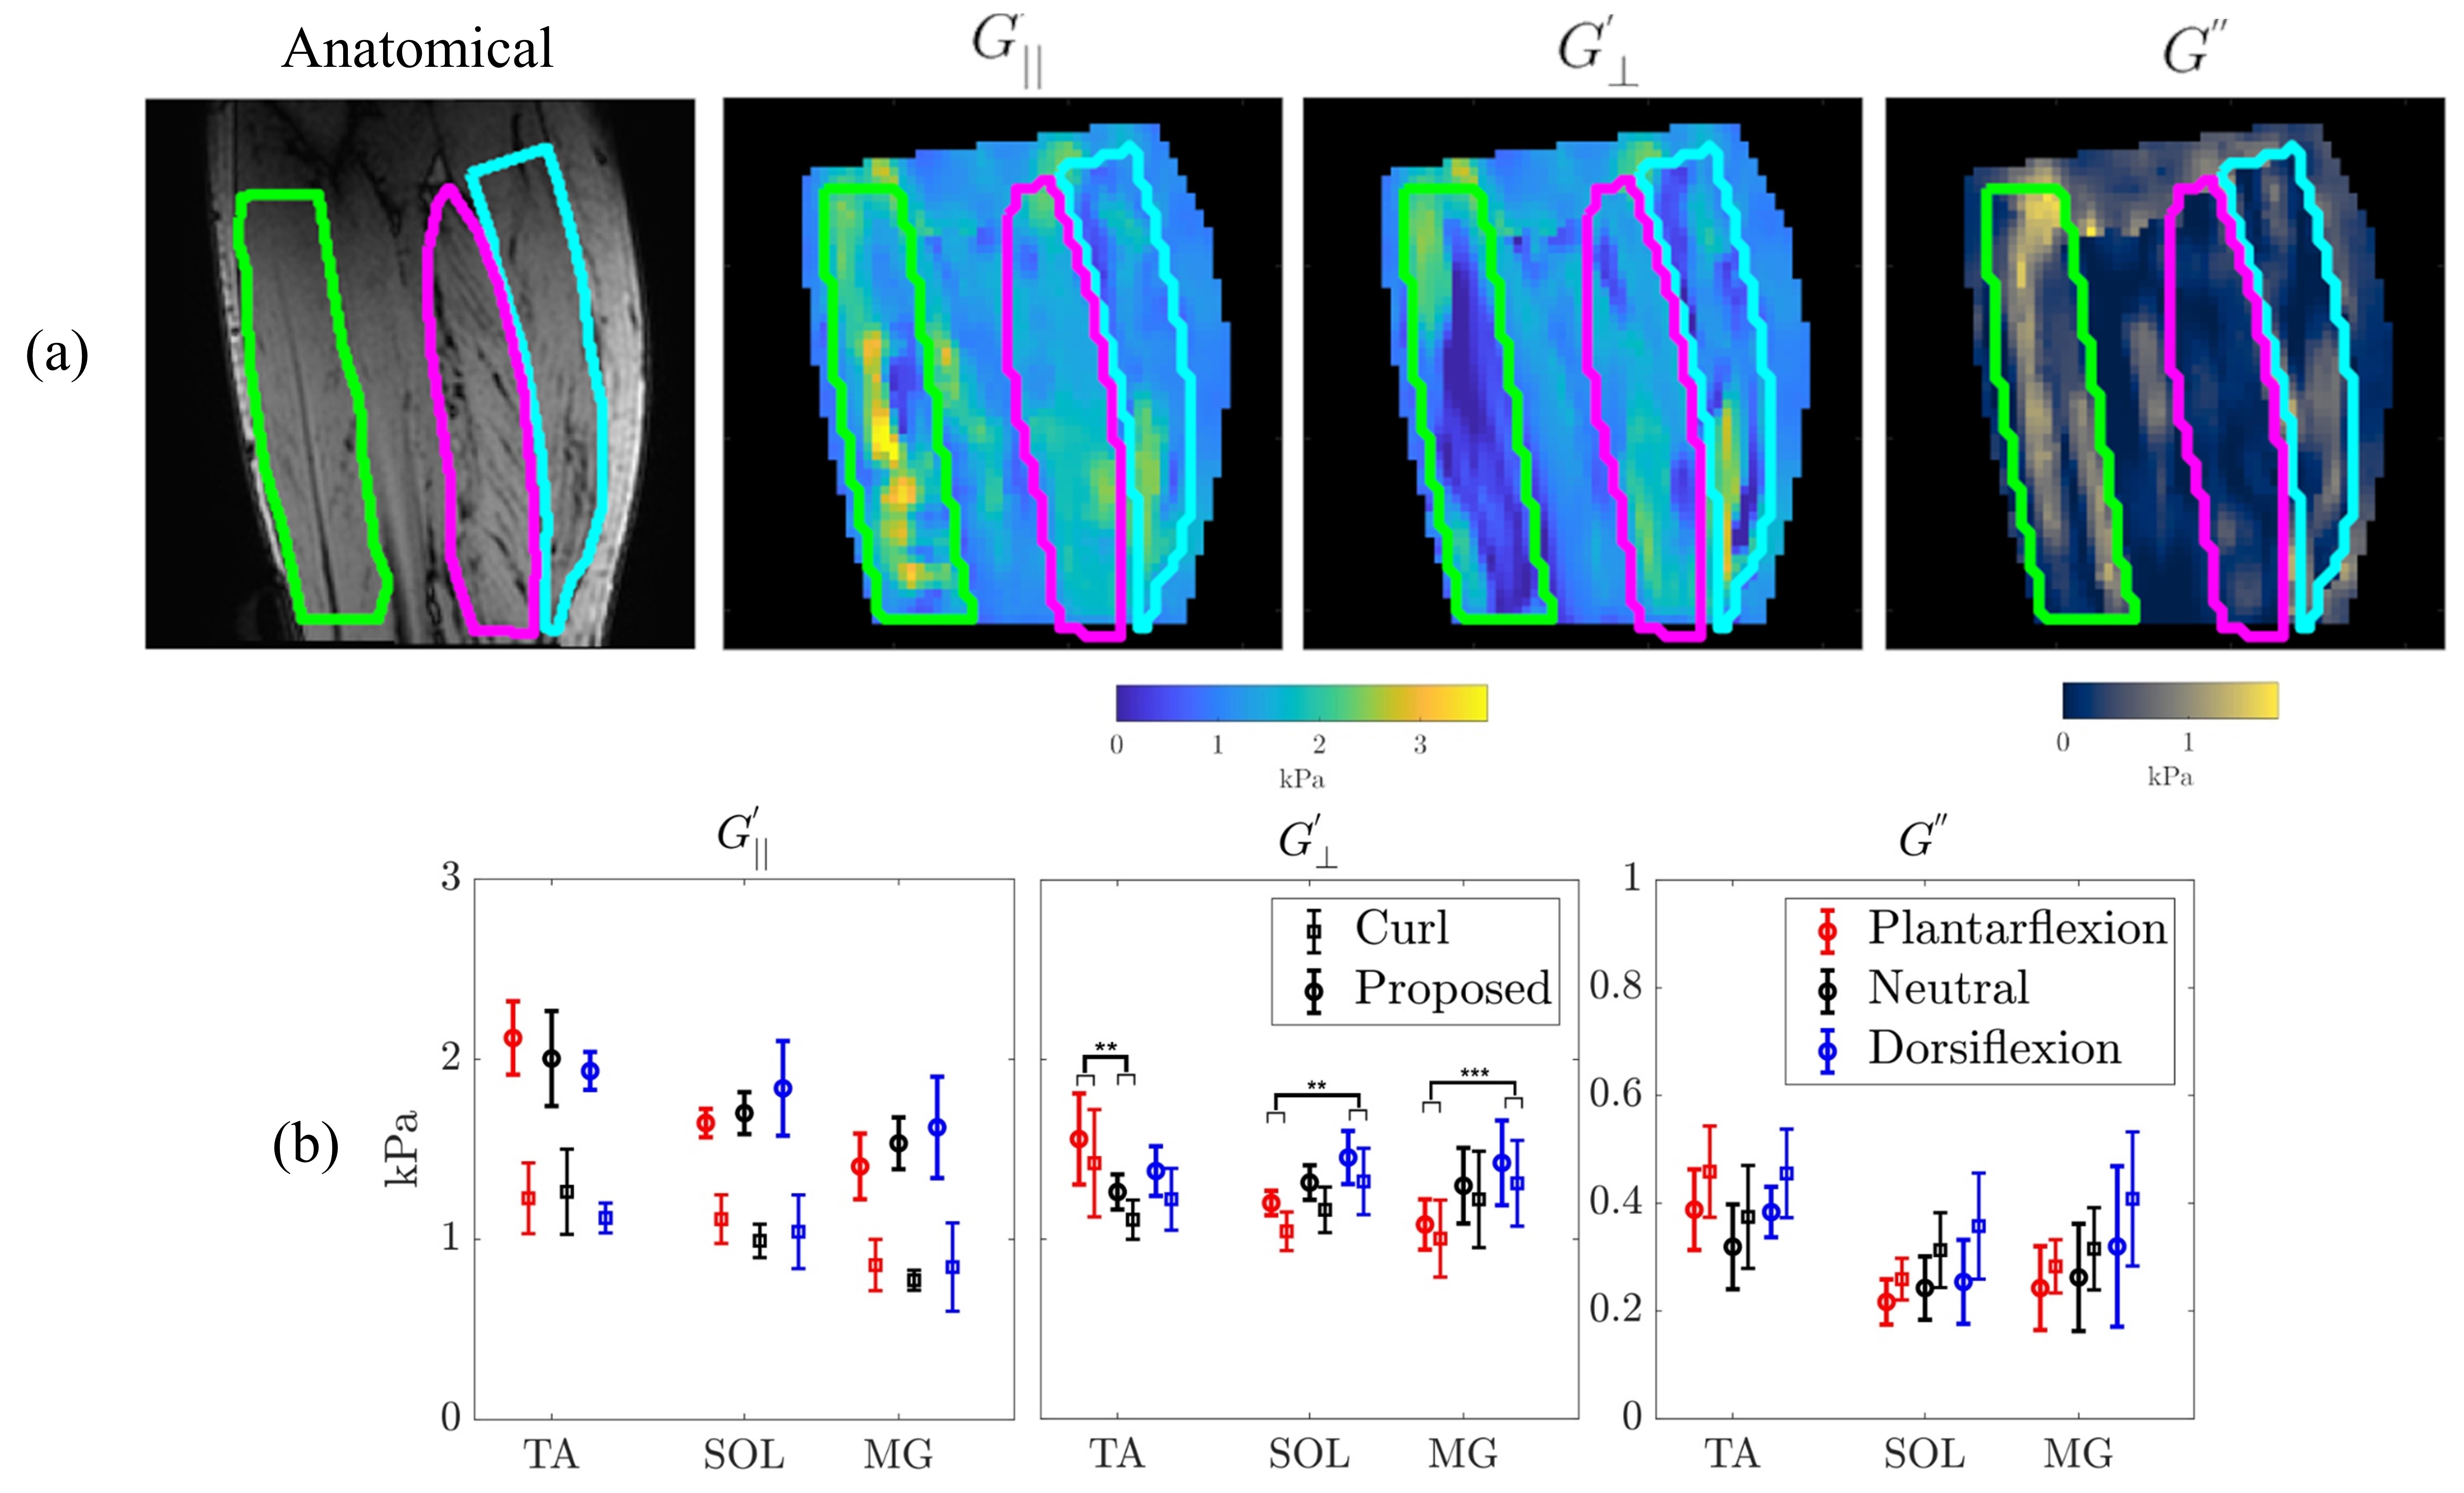
(a) Example anatomical image and stiffness maps for a single volunteer
in the neutral position outlining the TA (green), SOL (pink) and MG (blue). (b) Group (n = 6) mean
stiffness and 95% confidence intervals are shown for the three lower leg
muscles in plantarflexed, neutral and dorsiflexed positions. Significant
comparisons are marked with an asterisk (*P < 0.05; **P <0.01).