0737
Brain stiffness changes before disease onset and reflects remission and relapse in a mouse model of multiple sclerosis1Charité - Universitätsmedizin Berlin, Berlin, Germany
Synopsis
The disease progression in a mouse model of multiple sclerosis (EAE) was monitored based on regionally resolved brain viscoelasticity. Multifrequency MR elastography was applied prior to immunization and during subsequent phases of disease progression. Our results suggest that mechanical structures of the brain, particularly throughout the whole brain, in the cortex, and in the periventricular and hippocampal areas, are already significantly affected by neuroinflammation bevor clinical disability is manifested. Moreover, stiffness of the hippocampus and periventricular tissue transiently recovered during remission and became re-affected during relapse. This suggests that mechanical alterations are transient and recover during remission.
Introduction
MRE is a non-invasive method that quantifies tissue viscoelastic properties, such as stiffness and viscosity, by introducing shear waves into the tissue [1]. Inflammatory processes can influence the mechanical integrity of tissue by affecting, for instance, the cellular and molecular composition of brain tissue in a mouse model of multiple sclerosis (MS), the experimental autoimmune encephalomyelitis (EAE) [2-4]. Previous work has also demonstrated that brain stiffness is reduced in patients with neuroinflammatory conditions [5, 6] already at very early time points of the disease [7]. Recent developments of multifrequency MRE and tomoelastography of the mouse brain make it now possible to acquire multiple image slices at different excitation frequencies within less than ten minutes [8]. This method fosters longitudinal mapping of viscoelastic parameters of the mouse brain with rich anatomical detail. Therefore, the aim of this exploratory study was to investigate region-specific changes in cerebral viscoelastic properties over the course of a relapse-remitting MS-like pathology, using the EAE mouse model.Methods
EAE was induced in 8 weeks old female SJL/J mice (n=16) with 250ng PLP, 200µl Complete Freund’s Adjuvant and 800ng H37Ra, in addition to 250ng Pertussis toxin on days 0 and 2. Mice were daily scored for clinical signs of disease and determination of disease progression. As shown in figure 1A, baseline scans were conducted a week before immunization (n = 16) and longitudinally at the pre-onset (n = 15), onset (n = 16), peak (n = 15), remission (n = 12) and relapse phases (n = 7). MRE scans were performed at a 7-T small-animal scanner (Bruker BioSpec, Ettlingen, Germany). Waves images using multifrequency tomoelastography were acquired using 5 frequencies ranging from 1000Hz - 1400Hz (7slices, 0.8mm thickness, TE = 53ms, TR = 4000ms, FOV = 16.2x10.8mm², matrix size = 90 x 60). Vibrations were generated using a costume-made driver system using a nonmagnetic piezoceramic actuator (figure 1B) [8]. The data was processed using the k-MDEV inversion algorithm for shear wave speed (c in m/s) as a surrogate marker of stiffness and MDEV inversion for phase angle of the complex shear modulus (φ in rad, also named loss angle) as a measure of tissue fluidity (figure1C). The mean of c and φ were calculated in region of interests (ROI) manually drawn on the image slice which best depicted the investigated anatomical region. To reduce bias the data was blinded.Results
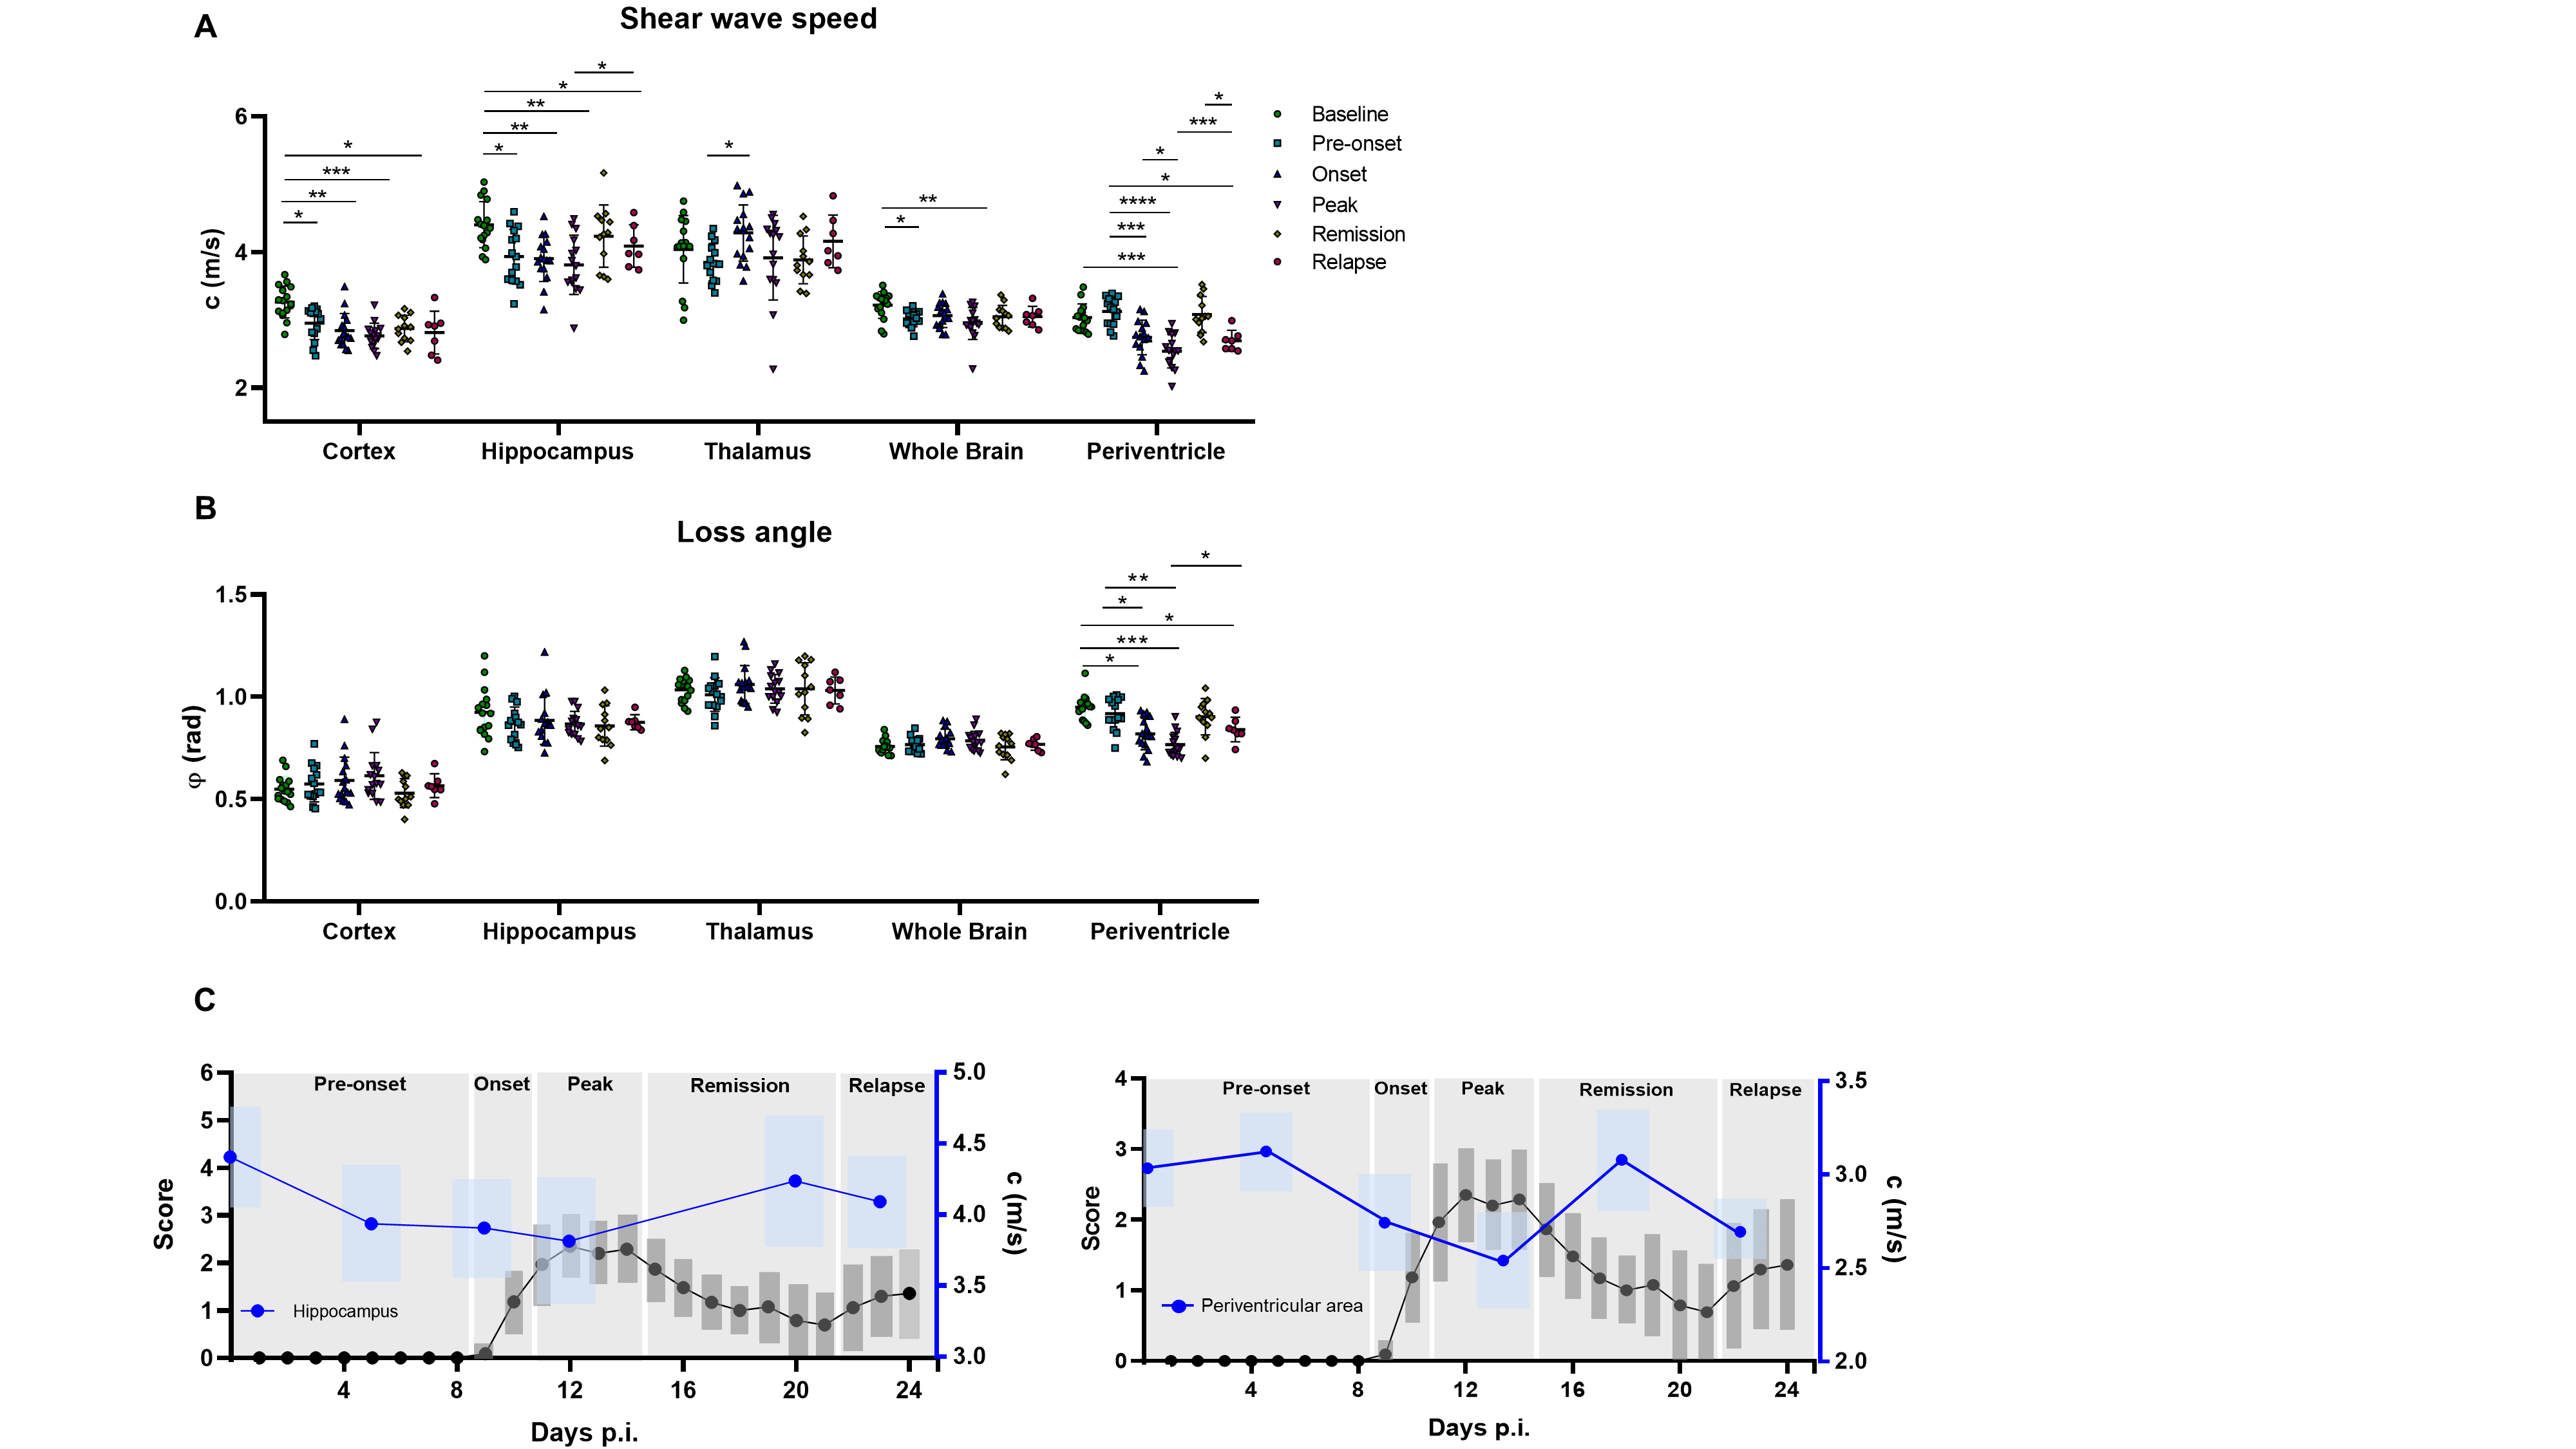
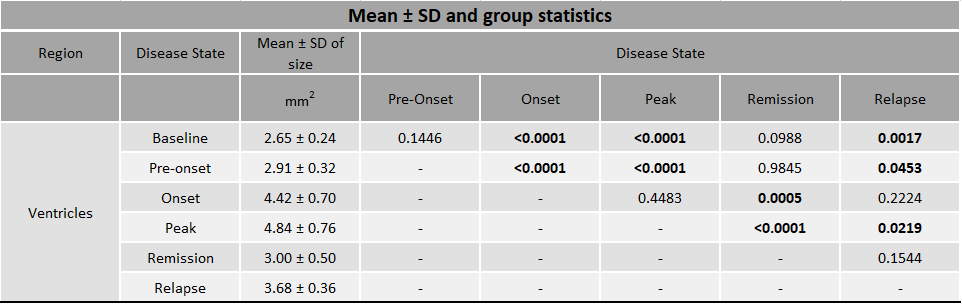
We found that MRE is sensitive to EAE phase-specific regional variations of viscoelasticity. As shown in figure 2A there was a significant irreversible decrease in c in the cortex and the whole brain during progression of the disease. The hippocampus and periventricular tissue also showed a decrease in c in the inflamed brain, which, however, was reversed during EAE remission (for mean ± SD and p-values see figure 3). The thalamus was not affected. The loss angle φ was only affected in the periventricular area (φ = 0.95 ± 0.06) where it was reduced at peak disease (φ = 0.77 ± 0.06 rad, p<0.0001) with temporary increase during remission phase (φ = 0.90 ± 0.09 rad, p = 0.002, repeated measures ANOVA) (figure 2B). Furthermore, ventricle size significantly increased during the onset and at peak of the disease, was reduced again during remission, while enlarged during relapse (figure 4A-B left, for mean ± SD and p-values see figure 5). Ventricle size significantly positive correlated with clinical scores (p<0.0001, r=0.7589, figure 4B right) while c and φ were inversely correlated with clinical score (c p<0.0001, r = -0.6725 (Pearson correlation coefficient) and φ p<0.0001, r = -0.59944).Discussion
Multifrequency MRE revealed region-specific changes in the viscoelastic properties of the brain during the course of EAE. Reversible softening of the hippocampus and periventricular areas indicates that the underlying pathology is transient and probably does not involve degenerative and long-lasting processes such as myelin degradation and neuronal degeneration [9-11]. On the other hand, irreversible softening of the cortex and whole brain tissue suggest that neuroinflammation is also associated with long-term pathological alterations that appear early on. Ventricular enlargement as a potential marker of MS [12-13] was not responsive to the pre-onset phase of EAE. We will perform histological analyses to better understand the correlation of ventricular enlargement and reduction of viscoelastic properties in the periventricular areas and other affected brain areas due to EAE disease progression.Conclusion
MRE showed high sensitivity to regional alterations of brain tissue due to neuroinflammation at different stages of the EAE. The observed MRE parameter changes in the hippocampus and periventricular tissue suggest reversible tissue alterations in these areas that correlated with the disease state. Thus, mechanical tissue properties could be of potential value as imaging markers to monitor disease progression in MS.Acknowledgements
Funding from the German Research Foundation (GRK 2260 BIOQIC, SFB1340 Matrix in Vision) is gratefully acknowledged. Funding to SPK, SM and PBS was provided by the BMBF under the ERA-NET NEURON scheme (01EW1811), and the German Research Foundation (DFG, Project BO 4484/2-1 and EXC NeuroCure).References
1. Hiscox, L.V., et al., Magnetic resonance elastography (MRE) of the human brain: technique, findings and clinical applications. Phys Med Biol, 2016. 61(24): p. R401-R437.
2. Millward, J.M., et al., Tissue structure and inflammatory processes shape viscoelastic properties of the mouse brain. NMR Biomed, 2015. 28(7): p. 831-9.
3. Riek, K., et al. MR elastography of mice in experimental autoimmune encephalitis. in Proceedings 19th Scientific Meeting, International Society for Magnetic Resonance in Medicine. 2011. Montreal.
4. Wang, S., et al., MR Elastography-Based Assessment of Matrix Remodeling at Lesion Sites Associated With Clinical Severity in a Model of Multiple Sclerosis. Front Neurol, 2019. 10: p. 1382.
5. Streitberger, K.J., et al., Brain viscoelasticity alteration in chronic-progressive multiple sclerosis. PLoS One, 2012. 7(1): p. e29888.
6. Wuerfel, J., et al., MR-elastography reveals degradation of tissue integrity in multiple sclerosis. Neuroimage, 2010. 49(3): p. 2520-5.
7. Fehlner, A., et al., Higher-resolution MR elastography reveals early mechanical signatures of neuroinflammation in patients with clinically isolated syndrome. J Magn Reson Imaging, 2016. 44(1): p. 51-8.
8. Bertalan, G., et al., Fast tomoelastography of the mouse brain by multifrequency single-shot MR elastography. Magnetic Resonance in Medicine, 2019. 81(4): p. 2676-2687.
9. Riek, K., et al., Magnetic resonance elastography reveals altered brain viscoelasticity in experimental autoimmune encephalomyelitis. Neuroimage Clin, 2012. 1(1): p. 81-90.
10. Freimann, F.B., et al., MR elastography in a murine stroke model reveals correlation of macroscopic viscoelastic properties of the brain with neuronal density. NMR Biomed, 2013. 26(11): p. 1534-9.
11. Schregel, K., et al., Demyelination reduces brain parenchymal stiffness quantified in vivo by magnetic resonance elastography. Proc Natl Acad Sci U S A, 2012. 109(17): p. 6650-5.
12. Brex, P. A., Jenkins, R., Fox, N. C., Crum, W. R., O’Riordan, J. I., Plant, G. T., & Miller, D. H. (2000). Detection of ventricular enlargement in patients at the earliest clinical stage of MS. Neurology, 54(8), 1689-1691.
13. Dalton, C. M., Brex, P. A., Jenkins, R., Fox, N. C., Miszkiel, K. A., Crum, W. R., ... & Miller, D. H. (2002). Progressive ventricular enlargement in patients with clinically isolated syndromes is associated with the early development of multiple sclerosis. Journal of Neurology, Neurosurgery & Psychiatry, 73(2), 141-147.
Figures