0727
Across-vendor, inline standardized spectral analysis for single voxel MRS data acquisition at 3T
Brian J Soher1, Dinesh K Deelchand2, Sandeep Ganji3, Ralph Noeske4, Adam Berrington5, James Joers2, and Gulin Oz2
1Radiology, Duke University Medical Center, Durham, NC, United States, 2University of Minnesota, Minneapolis, MN, United States, 3Philips Healthcare, Rochester, MN, United States, 4GE Healthcare, Berlin, Germany, 5University of Nottingham, Nottingham, United Kingdom
1Radiology, Duke University Medical Center, Durham, NC, United States, 2University of Minnesota, Minneapolis, MN, United States, 3Philips Healthcare, Rochester, MN, United States, 4GE Healthcare, Berlin, Germany, 5University of Nottingham, Nottingham, United Kingdom
Synopsis
The minimal spectral analysis methods described by MRS community consensus are not available in manufacturers’ MRS software. MRS data is still transferred off the scanner for advanced analysis leading to more variability in MRS results and impediments for adoption within a clinical DICOM workflow. We describe the Vespa Inline Engine (VIE), a flexible add-in module for the open-source Vespa spectral analysis package. VIE provides equivalent, inline MRS processing on GE, Siemens and Philips platforms. Raw MRS data sent to the VIE analysis returns results to the DICOM workflow as graphical and tabular DICOM images.
Introduction
Recent consensus papers1,2 list requirements for robust, accessible single voxel MRS processing, most of which are not typically available in MR manufacturers’ software. MRS data is still transferred offline for processing, fitting and quantitation, which causes variability in reported results and serious impediments to adoption of MRS into the clinical DICOM workflow. There is an unmet need for cross-vendor standardized, inline and equivalent spectral analysis workflows for producing robust MRS results.We describe an add-in module for the open-source, Python-based Vespa (Versatile Simulation, Pulses and Analysis) spectral analysis package3, called the Vespa Inline Engine (VIE). VIE provides equivalent, inline MRS processing on GE, Siemens and Philips platforms. Raw MRS data sent inline to the VIE module is analyzed and results returned to the DICOM workflow as graphical and tabular images.
Architecture and Methods
Fig 1 describes the basic VIE software architecture. Platform specific modules parse the data and determine corresponding processing settings based on pulse sequence. This information is sent to the VIE standard API. Analysis results are returned to the DICOM workflow as one or more ‘screenshot’ images of spectral plots of MRS data and fitted model overlay, and tabular metabolite fits. Details by manufacturer platform are shown in Fig 2.Note, examples below show data acquired with a cross-platform equivalent semi-LASER (sLASER) SVS sequence4. The VIE spectral analysis included: coil combination, individual FID frequency correction, eddy current correction, apodization, HLSVD water removal, metabolite fitting via a linear combination modelling and water signal quantitation. ‘Screenshot’ plot and table image results were created for all platforms at a minimum of 1024x1024 resolution.
The Siemens VIE implementation (Fig 2, top) runs in the IDEA/ICE environment. A custom functor runs in parallel to the standard ICE SVS pipeline. It sends raw MRS data and header information automatically to a VIE processing node via an XML-RPC connection allowing the node to be on either the Siemens MRIR or a workstation on the intranet. Multiple arrays of ‘screenshot’ results are returned to the custom ICE functor by the XML-RPC call for submission to the Siemens image database.
The GE VIE implementation (Fig 2, middle), uses a batch triggered script in the GE Python Orchestra environment to parse MRS raw data and header information from a P-file for the VIE module. The VIE is run on the GE console computer. Multiple arrays of ‘screenshot’ spectral processing results are written back to the GE DICOM database via Python Orchestra ‘dicom.write()’ functionality.
The Philips VIE implementation (Fig 2, bottom), runs in the PRIDE 2.0 environment. The user triggers a preset batch process that copies MRS data files to a local/external processing node and then runs a custom Python module to parse raw data and header information for VIE processing. Multiple arrays of ‘screenshot’ results are written to the Philips DICOM database via PRIDE 2.0. The Philips scanner also has the ability to write DICOM Encapsulated PDF objects to its database allowing higher resolution and more varied VIE results to be stored in the DICOM workflow.
Results
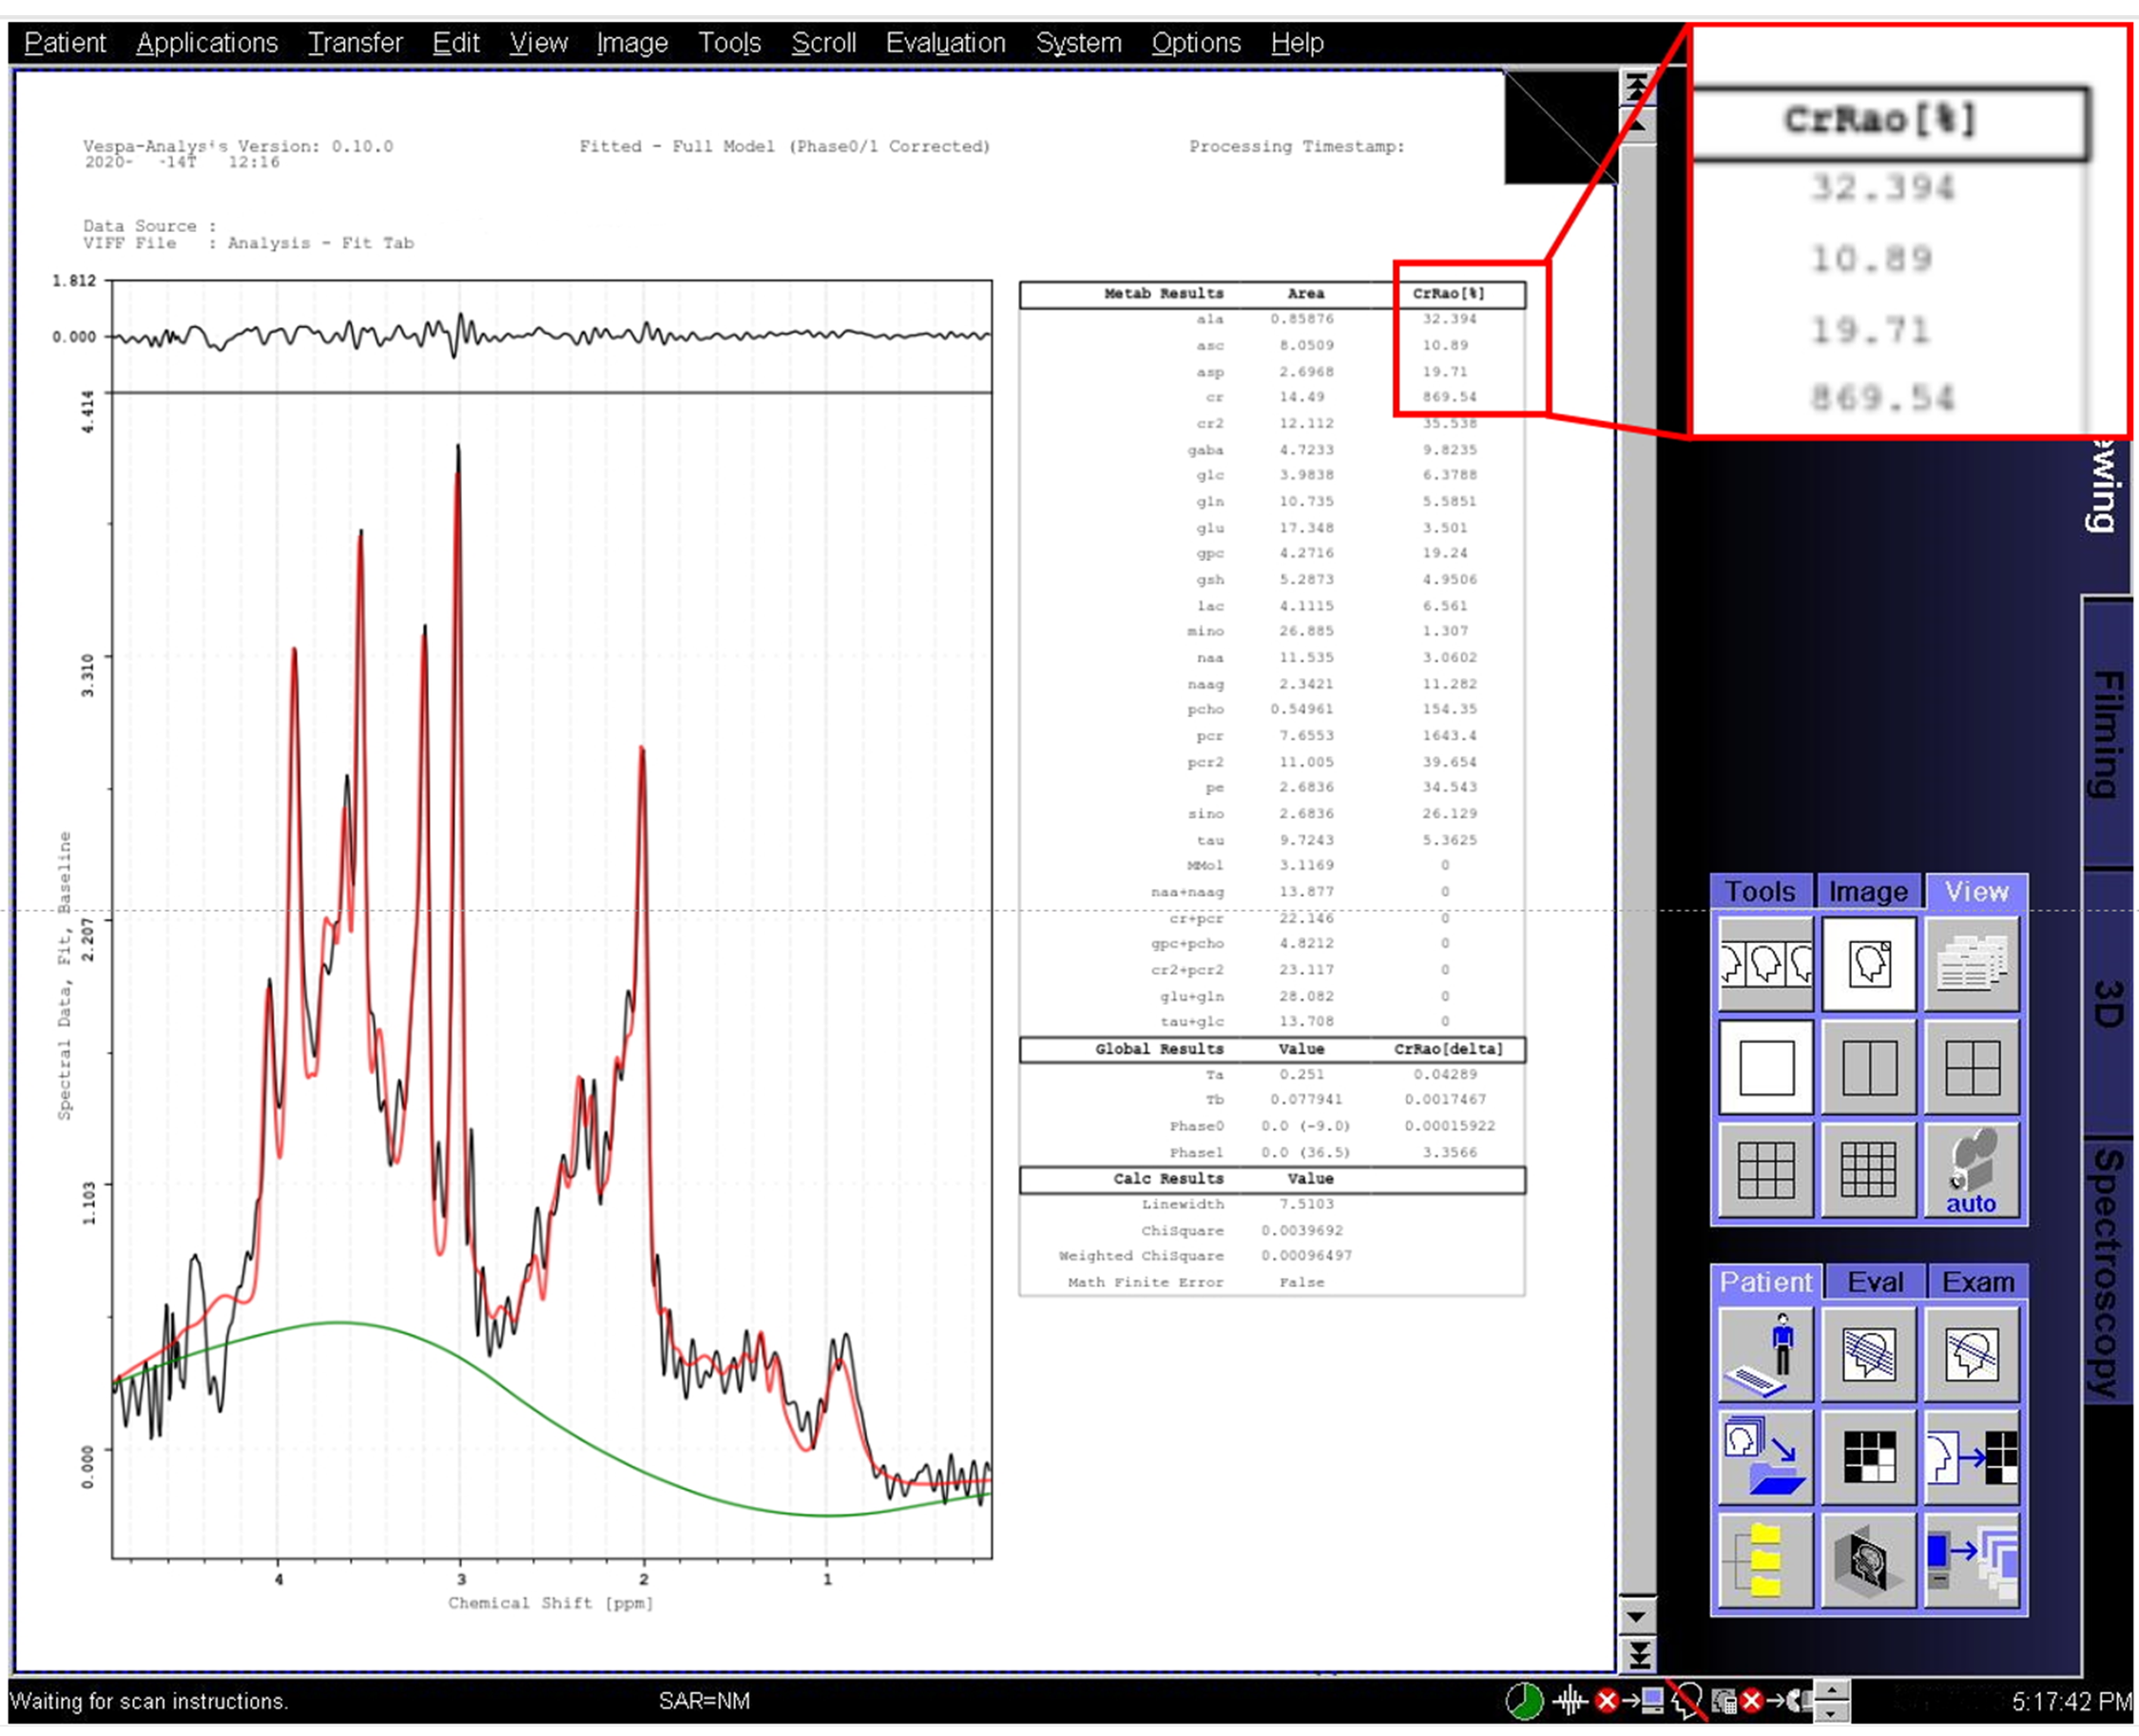
‘Screenshot’ spectral analysis results are shown for a subject from data taken on a Siemens Trio in Fig 3. Raw data (black), baseline estimate (green) and metabolite+macromolecule+baseline total fit (red) are plotted, metabolite values are in the table. DICOM ‘screenshot’ result images on both GE and Philips platforms are identical to those shown in Fig 3 (other than the subject scanned). Fig 4 shows sLASER results from data taken on a Philips scanner. The DICOM ‘screenshot’ result (top, similar to Fig 3) is shown displayed in a 3rd party DICOM reader. A DICOM Encapsulated PDF formatted result is displayed (Fig 2, middle) for the same reader. When the ‘PDF’ symbol is clicked, the system PDF Reader is used to display the high resolution, multipage result (Fig 3, bottom, first page only).Discussion
GE and Philips VIE implementations are written in pure Python, simplifying installation and maintenance. The custom ICE functor for the Siemens implementation may be simplified by the upcoming release of Siemens FIRE WIP. However, it currently is generalizable to multiple SVS sequences, and provides for selecting an external processing node, similar to the Philips PRIDE 2.0 environment functionality. VIE processing is controlled by Vespa ‘preset’ files created/optimized in Vespa-Analysis application for given SVS data. VIE functionality is easily extended by providing addition text-based XML ‘preset’ files in the VIE directory. The current 1024x1024 ‘screenshot’ DICOM image results are sub-optimal in terms of pixilation, readability and the inability to export tabular data. We are experimenting with 2048x2048 resolution image creation to address the former, and export of results in DICOM encapsulated PDF formats for the latter. Both solutions have been implemented in the Philips VIE platform.Conclusion
The Vespa Inline Engine add-in module provides a platform from which SVS MRS data can be processed inline on GE, Siemens and Philips scanners. The Vespa environment provides a flexible open-source platform from which various spectral analysis libraries and applications can be embedded in existing DICOM workflows.Acknowledgements
NIH funding from grants R01NS080816 and 1R01EB008387References
- Wilson M, et al. Methodological consensus on clinical proton MRS of the brain: Review and recommendations. Magn Reson Med. 2019;82(2): 527‐550.
- Near J, et al. Preprocessing, analysis and quantification in single‐voxel magnetic resonance spectroscopy: experts' consensus recommendations. NMR Biomed. Epub. Dec 22, 2019.
- Vespa – Versatile Simulation Pulses and Analysis - 2011. Available from: https://scion.duhs.duke.edu/vespa/project
- Deelchand DK, Berrington A, et.al. Across-vendor standardization of semi-LASER for single-voxel MRS at 3T. NMR Biomed. Epub. Dec 18, 2019.
Figures
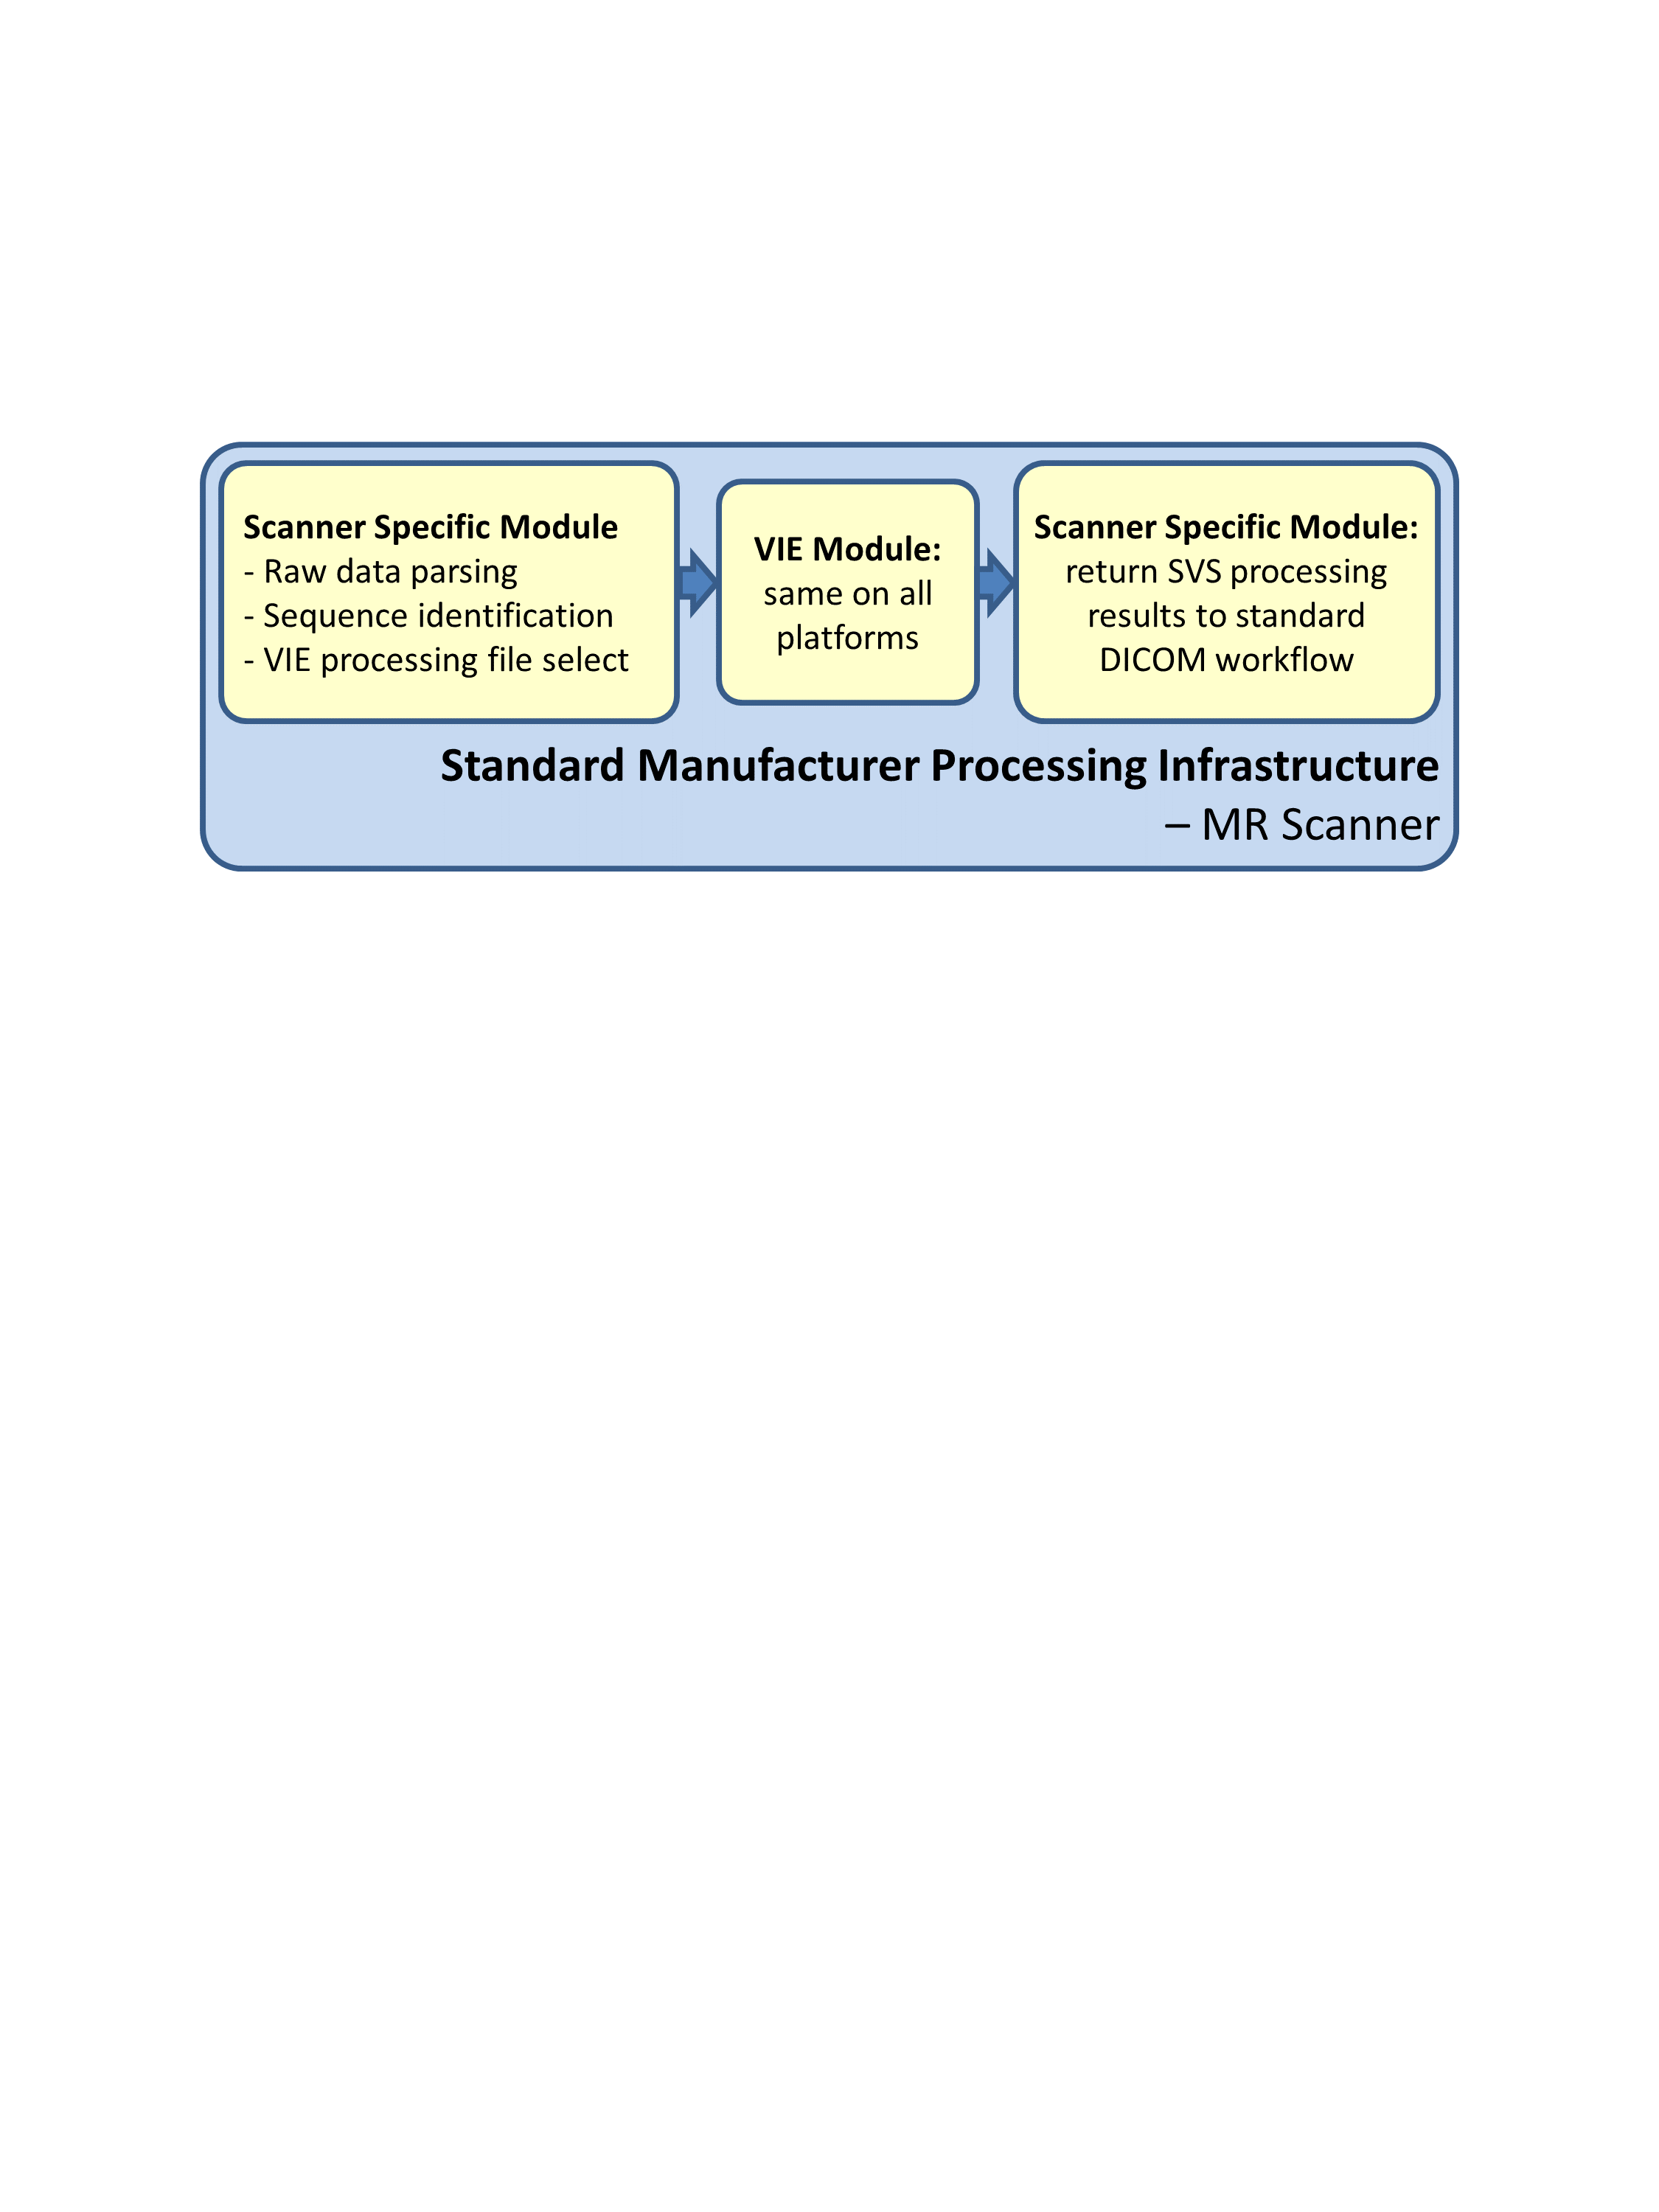
Figure 1. Overview
of Vespa Inline Engine software architecture for inline MRS data processing.
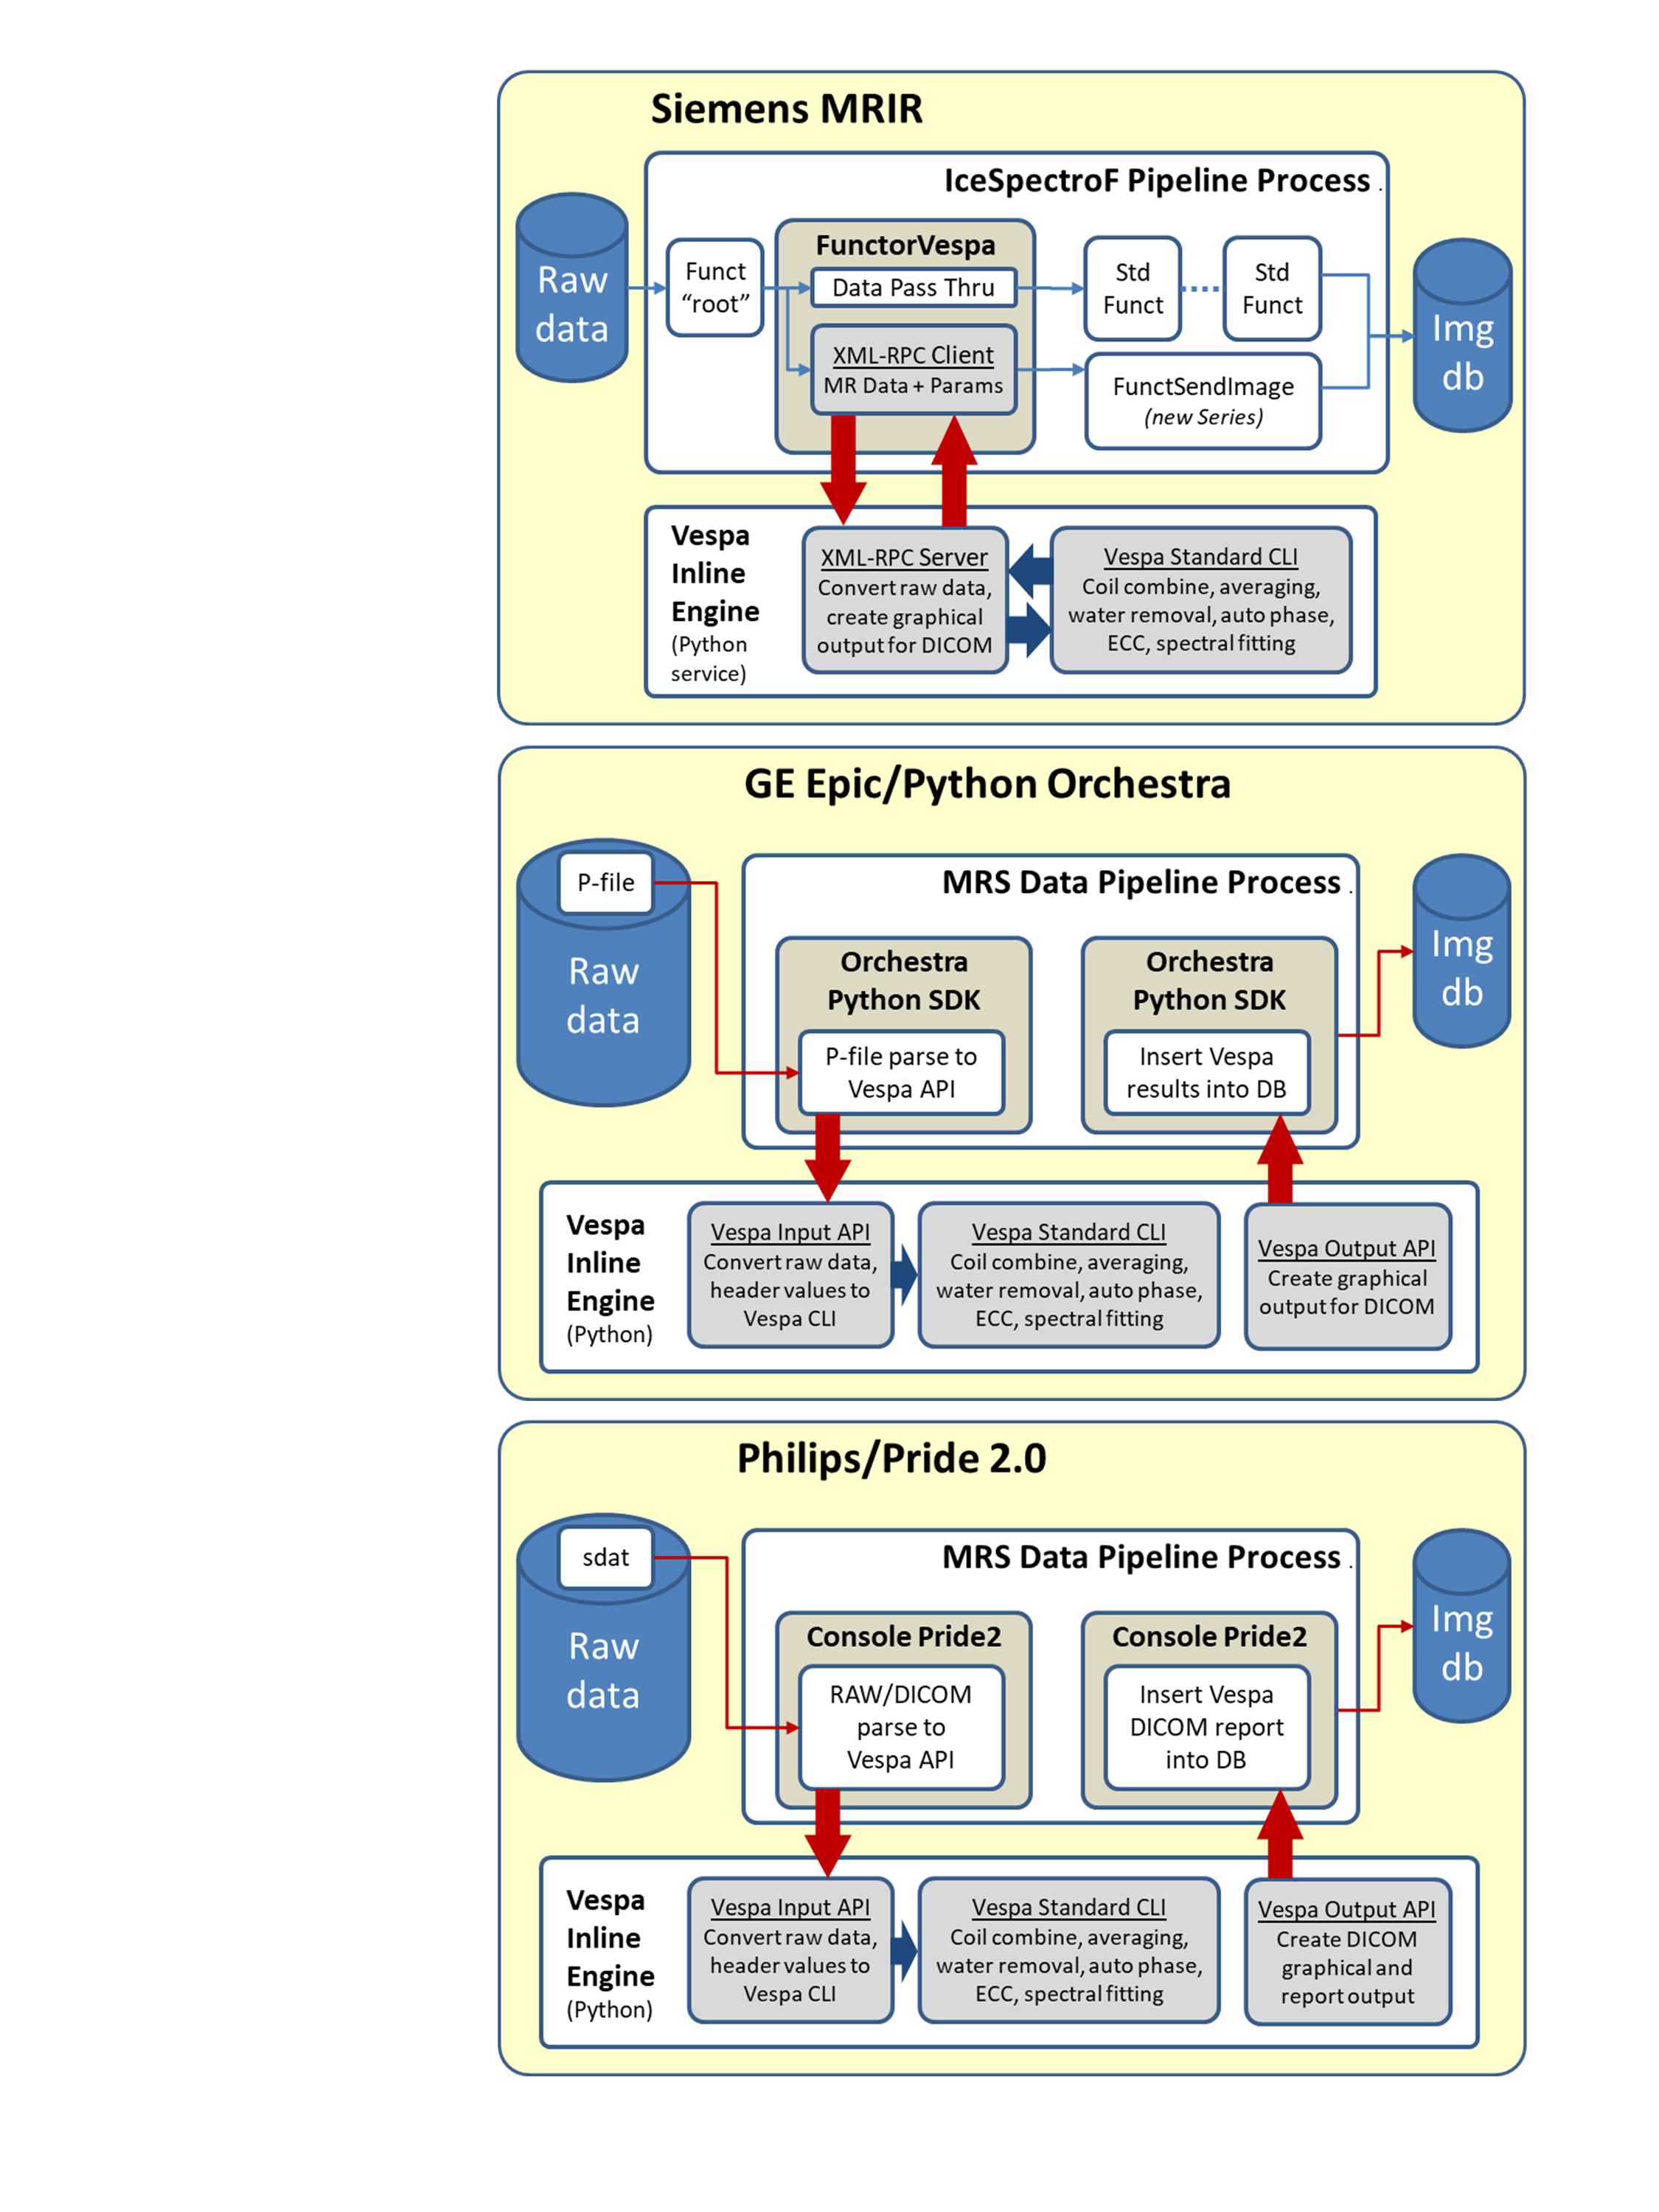
Figure 2. Manufacturer-specific
software implementations for Siemens (top), GE (middle) and Philips (bottom)
platforms. Standard manufacturer infrastructures (Siemens IDEA/ICE, GE Python
Orchestra and Philips PRIDE 2.0) are used to call the VIE module, which is a
pure Python implementation installed by copying a simple standard directory
structure onto a workstation. VIE results are sent to MR image databases as
DICOM ‘screenshot’ images of spectral plots and tabular metabolite fit results.
Figure
3. Fitting results for a test subject data taken on a Siemens Trio MR scanner.
Image resolution is 1024x1024 pixels. Spectral plots include raw data (black),
baseline estimate (green) and metabolite+macromolecule+baseline total fit (red),
metabolite fit values are in the table. Fitting time was approximately 90
seconds on the Siemens MRIR computer. An example of pixilation is shown in the
blown-up box, top right.
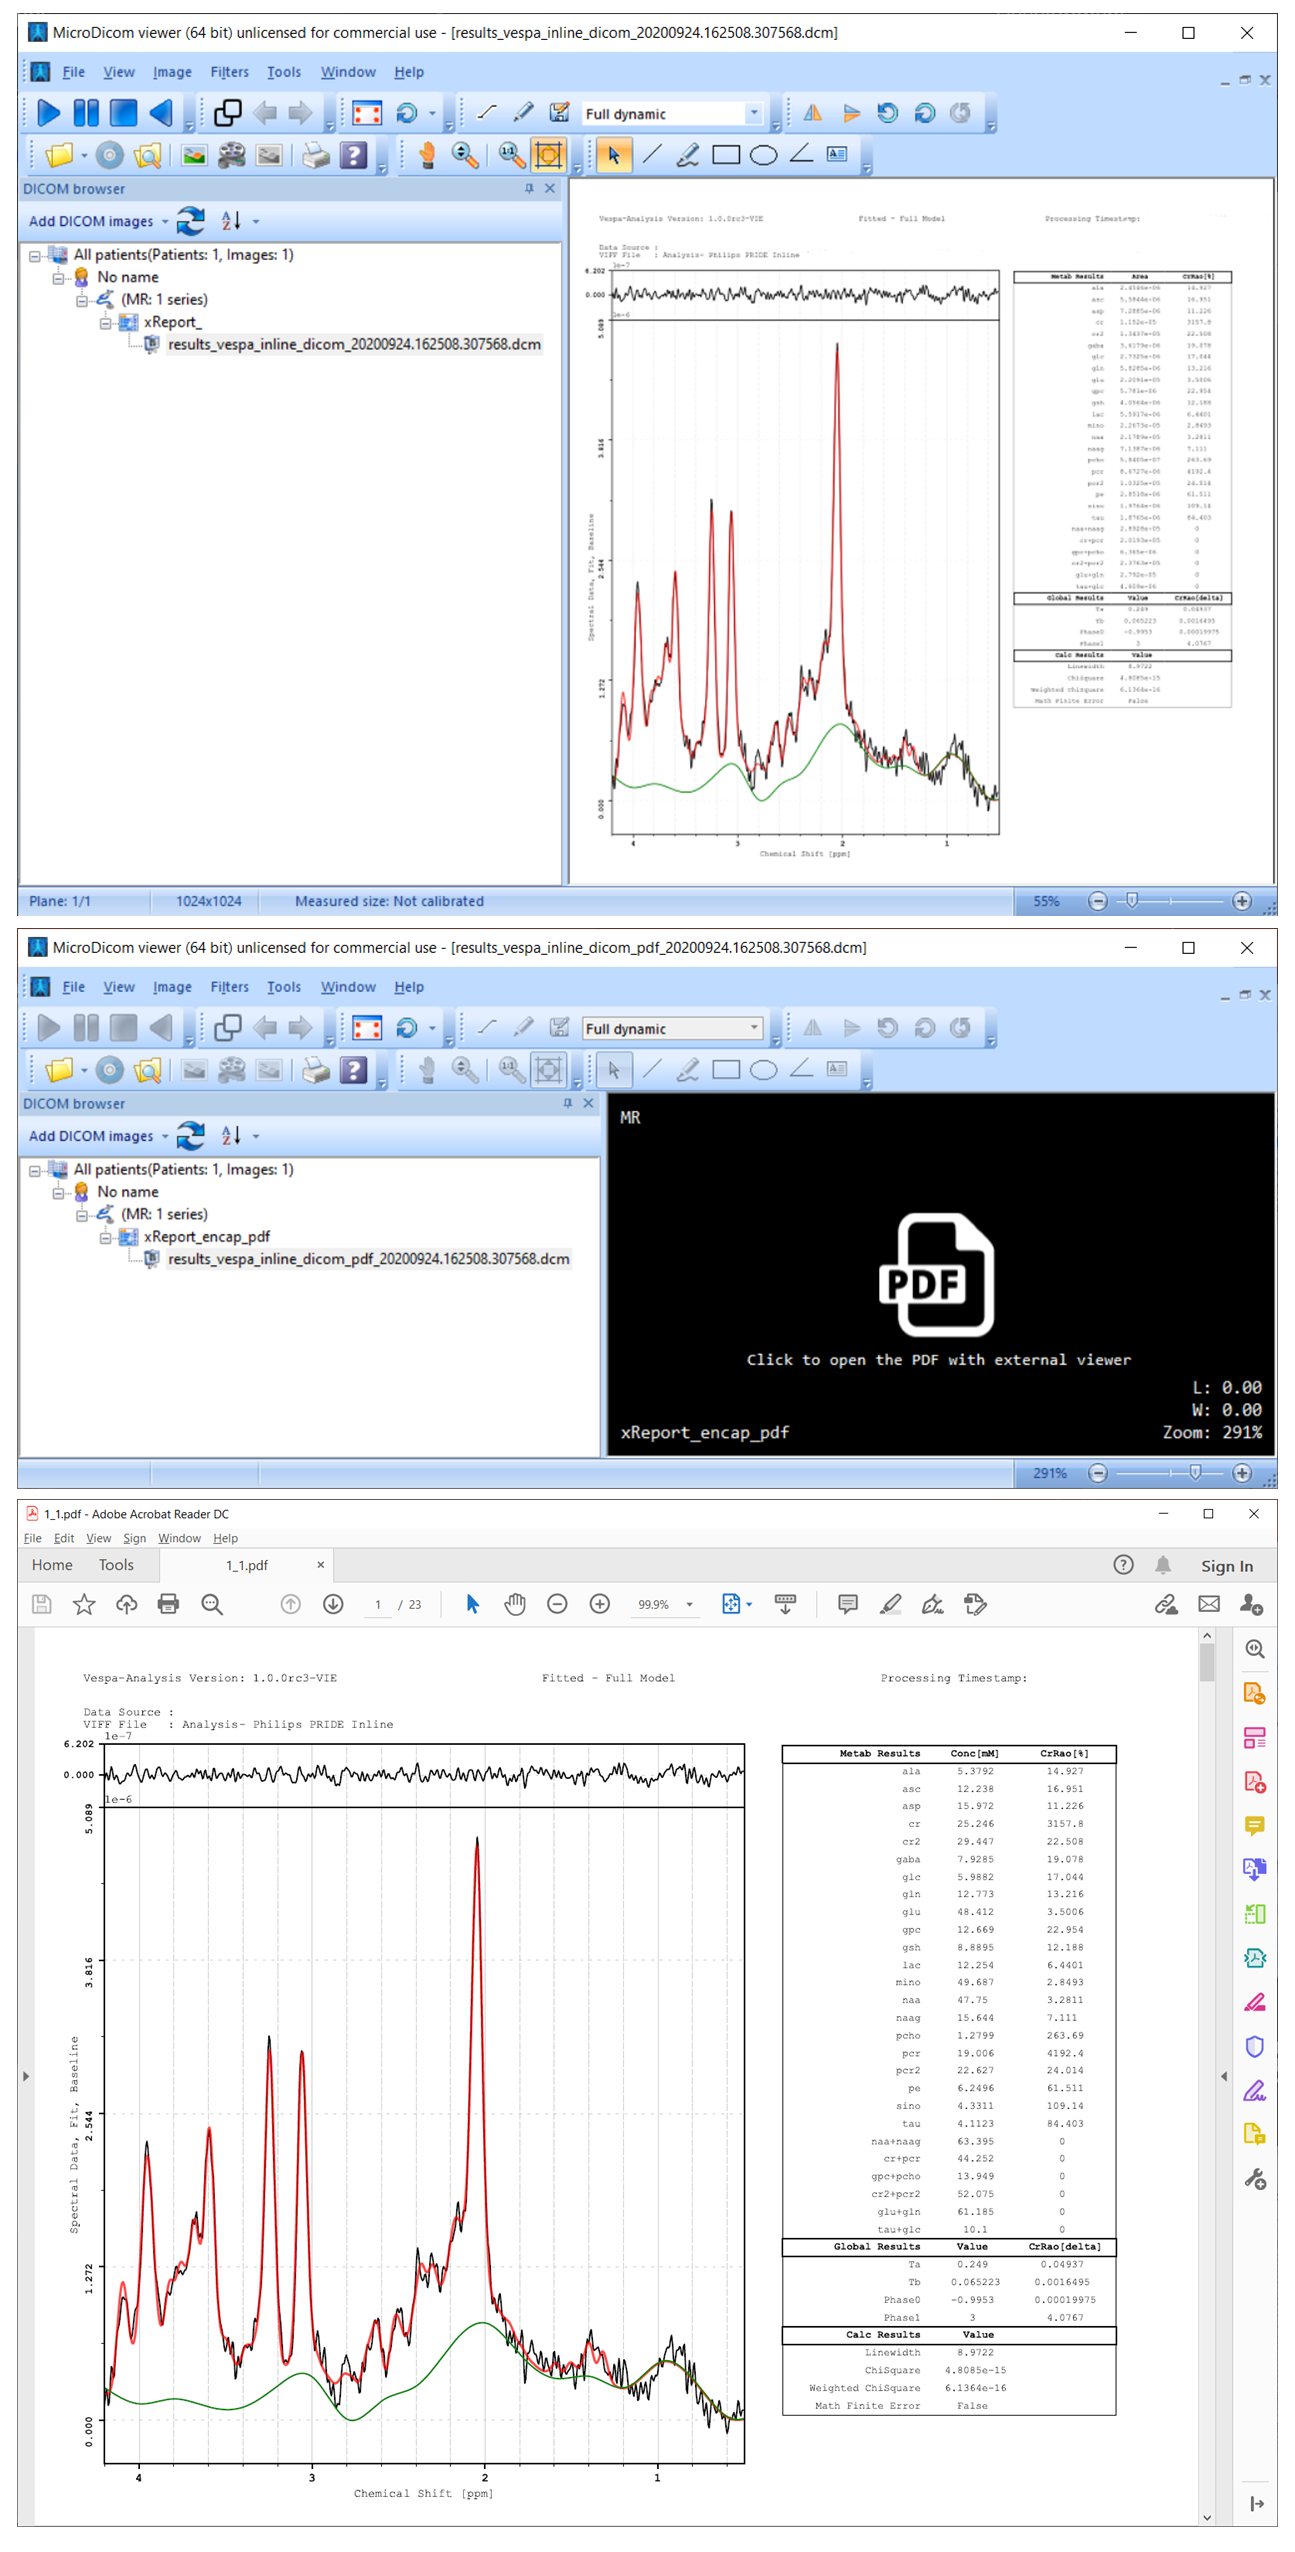
Figure 4. DICOM VIE fitting results for
test subject data taken on a Philips scanner, shown using a 3rd party DICOM viewer
(MicroDicom). Top: standard DICOM ‘screenshot’ VIE result at 2048x2048
resolution. Middle: the same result that has been stored as a DICOM
Encapsulated PDF format file opened in DICOM viewer. Bottom: clicking on the
‘PDF’ symbol opens the system PDF Reader to display high resolution, multipage
result (first PDF page only).