0724
In vivo GABA increase as a biomarker of the epileptogenic zone: an unbiased metabolomics approach1Grenoble Institut Neurosciences, University Grenoble Alpes, La Tronche, France, 2IRMaGE, University Grenoble Alpes, La Tronche, France, 3Departement of Psychiatry, Columbia University, New York, NY, United States
Synopsis
New non invasive methods are required to better delimit the epileptogenic zone (EZ) during the pre-surgical exam of epileptic patients. By combining ex vivo NMR spectroscopy-based (MRS) untargeted metabolomics and in vivo MRS-based targeted metabolomics, we found that GABA was the most discriminant metabolite of the epileptogenic zone vs adjacent brain regions in a mouse model of mesio-temporal lobe epilepsy (MTLE). GABA appears therefore as a specific in vivo biomarker of EZ in MTLE.
INTRODUCTION
For the 30 % of drug-resistant epileptic patients who mainly suffer from focal epilepsy, a surgical resection of the epileptogenic zone (EZ) can be proposed with a mean efficiency of 50-801. A precise identification of the EZ is mandatory for an effective resection. Despite a large panel of noninvasive preoperative explorations, intracranial EEG (IEEG) is often required2, but the low spatial sampling of each electrode and/or misguided implantation may result in the resection of an insufficient brain area. Therefore, the development of non-invasive methods to better identify the EZ and to guide electrode implantation remains a challenge. In our study, we hypothesized that MRS-based metabolomics could address this issue in mesio-temporal lobe epilepsy (MTLE), the prototype of surgical epilepsy. We used KA-MTLE (kainate) mice, that leads to hippocampal sclerosis similar to human ones3. Using pattern recognition methods applied to ex vivo MRS data, we determined the metabolic profile of the EZ relative to (i) Sham and (ii) adjacent structures, and identified the metabolite that best discriminate EZ. We then performed in vivo MRS of this metabolite to evaluate its reliability as a biomarker for the non-invasive detection of the EZ4.MATERIALS AND METHODS
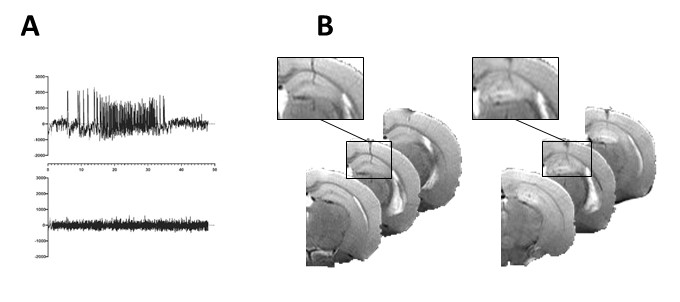
AnimalsKA-MTLE mice were obtained by injection into the right dorsal hippocampus of 50 nL of KA while Sham received NaCl3. We performed 7 experimental series. For one series, a half KA dose was used instead of regular dose. Thirty days after injection, we recorded hippocampal EEG activity to check for typical hippocampal paroxysmal discharge (Fig 1A).
In vivo MRI experiments
In vivo MRI and MRS were performed on a 9.4 Tesla scanner (BioSpec 94/20 Avance III HD, Bruker Biospin) with ParaVision (6.0.1) software three weeks after KA injection. We first acquired T2-weighted images to check for hippocampal sclerosis in KA-MTLE mice (Fig 1B). Then we used a customized MEGA-PRESS5 method for GABA level measurements into the injected hippocampus (2x1x2 mm3 voxel, 68 ms echo time, 512 averages for On and OFF spectra each using interleaved mode, 34-min acquisition). We pre-processed and quantified the data using the JET algorithm6, which requires no manual adjustment. Creatine+phosphocreatine (CR), GABA+ (GABA + macromolecule), and glutamate+glutamine (GLX) were quantified. To limit the effect of possible acquisition bias, we calculated the ratios GABA+/GLX.
Ex vivo HRMAS MRS
One week after in vivo MRS, we collected 5 samples/animal: ipsilateral and contralateral hippocampus (IH and CH), divided each in posterior (P) and anterior (A), and adjacent cortex for 1H HRMAS MRS. This latter was performed on a Bruker Avance III spectrometer (IRMaGe, CEA, Grenoble, France) at 500 MHz using a CPMG pulse sequence (echo time 30 ms). Quantification was performed using the QUEST procedure of jMRUI7.
Statistical analysis
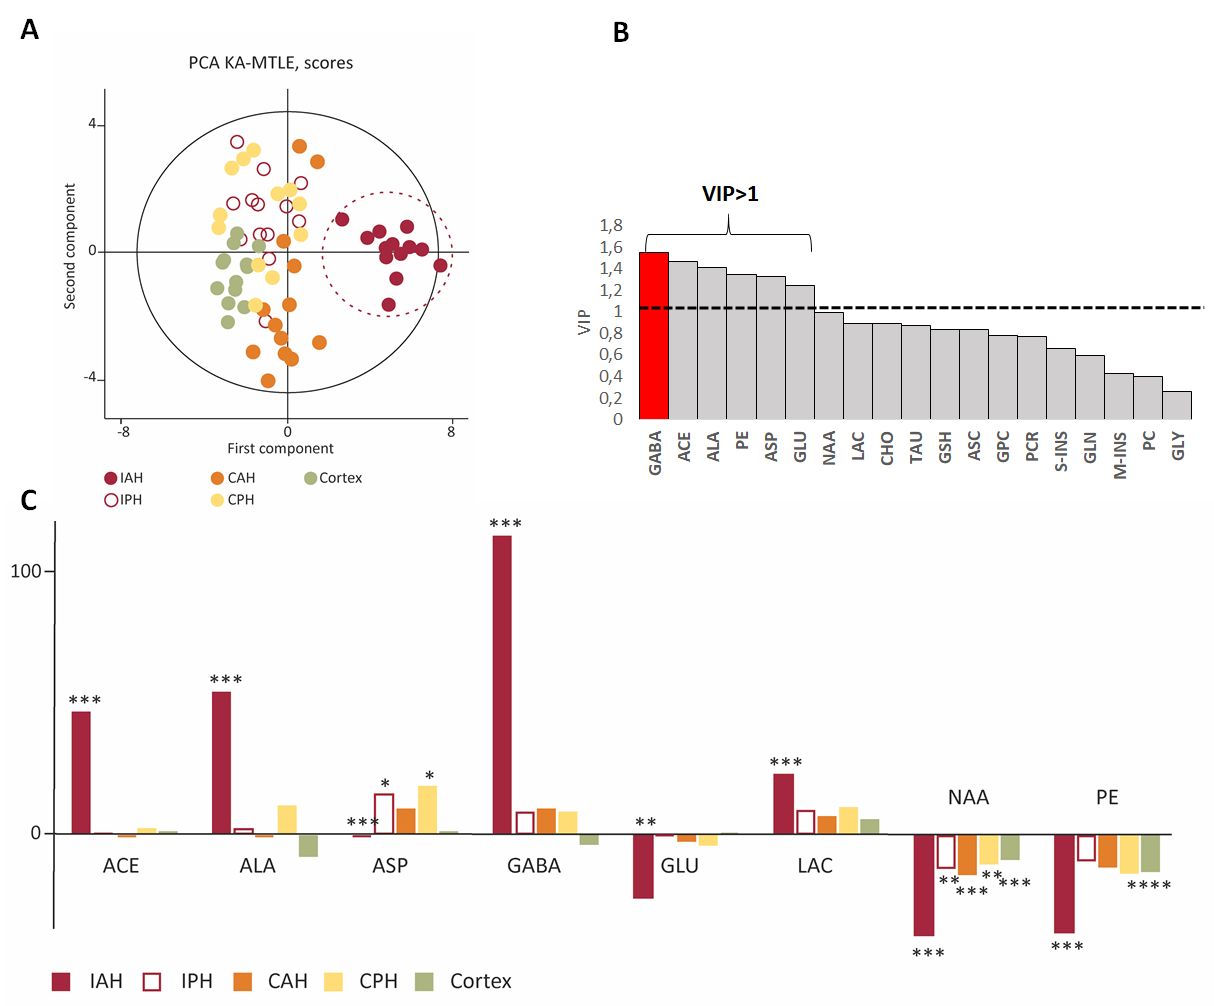
We applied multivariate statistics using the SIMCA-P software v14 (Umetrics, Umea, Sweden), to find the metabolites most involved in EZ discrimination, based on their VIP (variable importance in the projection) values8. We considered metabolites with VIP ≥ 1 as the most relevant.
RESULTS
For KA-MTLE mice with typical paroxysmal discharges (Fig 1A) and associated hippocampal sclerosis (Fig 1B), the principal component analysis (PCA) built with 1H HRMAS MRS data of tissue showed that EZ had a specific metabolic profile, compared to sham animals and, more importantly, compared to adjacent regions (Fig 2A). 14 metabolites were stronly dysregulated in EZ compared to Sham.Classification of the metabolites according to their discriminating power showed that GABA was the most discriminant metabolite of EZ (Fig 2B), with a more than 100% increase compared to sham homologous brain area (Fig 2C). Alanine and acetate were also increased by around 50%.
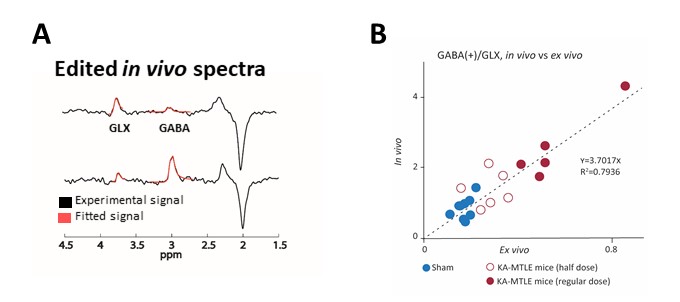
The MEGA-PRESS analysis of EZ confirmed this large GABA increase, and the decrease of GLX (Fig 3A). The in vivo and ex vivo data were largely consistent, as indicated by the correlation curve (Fig 3B).
DISCUSSION/CONCLUSION
By using an unbiased methodological strategy, we have demonstrated that a drastic increase of GABA and the associated GABA/GLX ratio are EZ-specific in a validated model of MTLE with focal seizure4.While this result appears somewhat paradoxical with the “GABA-deficiency theory” of epilepsy9, it is consistent with several studies in animal model10 and in patients11, suggesting that GABA could contribute to epileptogenesis and ictogenesis.
Our projects are now i) to develop chemical shift imaging of GABA for animal and ii) to measure in vivo GABA levels in EZ of patients with a suspicion of MTLE. For this latter, in vivo GABA edition could be performed before surgery, followed by ex vivo MRS of resected tissue.
Acknowledgements
This study was supported by INSERM funding and a grant from the French Foundation for Research on Epilepsy (FFRE). The authors are grateful to Sylvain Andrieu and Laure Mehr for their advice and their help in animal experimentation, to Pierre-Alain Bayle and Michel Bardet for the use of HRMAS probehead in CEA, and to Pr Philippe Kahane for helpful discussions. Grenoble MRI facility IRMaGe was partly funded by the Agence Nationale de la Recherche: grant Infrastructure d'avenir en Biologie Santé ANR-11-INBS-0006.References
1. Picot MC, Baldy-Moulinier M, Daures JP, et al. The prevalence of epilepsy and pharmacoresistant epilepsy in adults: a population-based study in a Western European country. Epilepsia. 2008 Jul;49(7):1230-8.
2. Jayakar P, Gotman J, Harvey AS, et al. Diagnostic utility of invasive EEG for epilepsy surgery: Indications, modalities, and techniques. Epilepsia. 2016 Nov;57(11):1735-47.
3. Riban V, Bouilleret V, Pham-Le BT, et al. Evolution of hippocampal epileptic activity during the development of hippocampal sclerosis in a mouse model of temporal lobe epilepsy. Neuroscience. 2002;112(1):101-11.
4. Hamelin S, Stupar V, Maziere L, et al. In vivo gamma-aminobutyric acid increase as a biomarker of the epileptogenic zone: An unbiased metabolomics approach. Epilepsia. 2020 Dec 1.
5. Mescher M, Merkle H, Kirsch J, et al. Simultaneous in vivo spectral editing and water suppression. NMR Biomed. 1998 Oct;11(6):266-72.
6. Guo J, Gang Z, Sun Y, et al. In vivo detection and automatic analysis of GABA in the mouse brain with MEGA-PRESS at 9.4 T. NMR Biomed. 2018 ;31(1).
7. Ratiney H, Sdika M, Coenradie Y, et al. Time-domain semi-parametric estimation based on a metabolite basis set. NMR Biomed. 2005 ;18(1):1-13.
8. Galindo-Prieto B, Eriksson K, Trygg J. Variable influence on projection (VIP) for orthogonal projections to latent structures (OPLS). J Chemometrics. 2014 ;28(8):623-32.
9. Meldrum BS. GABAergic mechanisms in the pathogenesis and treatment of epilepsy. Br J Clin Pharmacol. 1989;27 Suppl 1:3S-11S.
10. Stamboulian-Platel S, Legendre A, Chabrol T, et al. Activation of GABAA receptors controls mesiotemporal lobe epilepsy despite changes in chloride transporters expression: In vivo and in silico approach. Exp Neurol. 2016 ;284(Pt A):11-28.
11. Cohen I, Navarro V, Clemenceau S, et al. On the origin of interictal activity in human temporal lobe epilepsy in vitro. Science. 2002 15;298(5597):1418-21.
Figures