0723
CRT-FID-MRSI at 7T for the high-resolution metabolic imaging of epilepsy: Preliminary results1Department of Neurosurgery, Medical University of Vienna, Vienna, Austria, 2High Field MR Centre, Department of Biomedical Imaging and Image-guided Therapy, Medical University of Vienna, Vienna, Austria, 3Division of Neuroradiology and Musculoskeletal Radiology, Department of Biomedical Imaging and Image-guided Therapy, Medical University of Vienna, Vienna, Austria, 4Department of Neurology, Clinic Hietzing, Vienna, Austria, 5Department of Paediatrics and Adolescent Medicine, Medical University of Vienna, Vienna, Austria, 6Department of Neurology, Medical University of Vienna, Vienna, Austria, 7Christian Doppler Laboratory for Clinical Molecular MR Imaging, Vienna, Austria
Synopsis
We successfully implemented a fast high-resolution 3D-MRSI protocol covering the whole brain at 7T in a preliminary study of 14 patients with pharmacoresistant epilepsy. With an isotropic resolution of 3.4 mm acquired in 15:30 min, we detected focal metabolic alterations in thirteen patients. From all metabolites, tCr, Glu, mIns and NAA and especially tCho appear as the most relevant markers for detection of focal metabolic alterations in epilepsy. Especially concerning cortical developmental alterations as a cause of epilepsy, our findings may have the potential to differentiate metabolic fingerprints for FCD subclasses.
Purpose
Recently, we introduced CRT-FID-MRSI (concentric ring trajectory free induction decay magnetic resonance spectroscopic imaging) at 7T [1] as a sequence for fast and high-resolution metabolic imaging and applied it to resolve metabolic heterogeneities in high grade gliomas [2]. In the present study, we applied this technique to the imaging of metabolic alterations in patients with epilepsy. Refractory epilepsy, caused by a wide spectrum of pathological entities such as focal cortical dysplasia, but resistant to pharmacological treatment, can be treated by surgery, but this approach requires precise localisation of the epileptogenic zone to allow complete resection [3].Patients without morphological abnormalities at lower fields despite an epilepsy-specific protocol (MR-negative, MRN) can benefit from 7T MRI [4]. So far, MRSI has not been able to provide the resolution and coverage to contribute to presurgical planning but has identified metabolic changes such as decreases in N-acetylaspartate (NAA) and increases in total choline (tCho) and total Creatine (tCr) [5] and remains untested at 7T with few exceptions [6,7].
We therefore investigated the potential of our 7T MRSI approach to identify and determine the extent of the epileptogenic zone, utilising increased signal-to-noise-ratio and spectral dispersion to acquire images with high spatial and spectral resolution. With this work, we present our initial results of the application of 7T-CRT-FID-MRSI to fourteen patients suffering from medically refractory epilepsy.
Methods
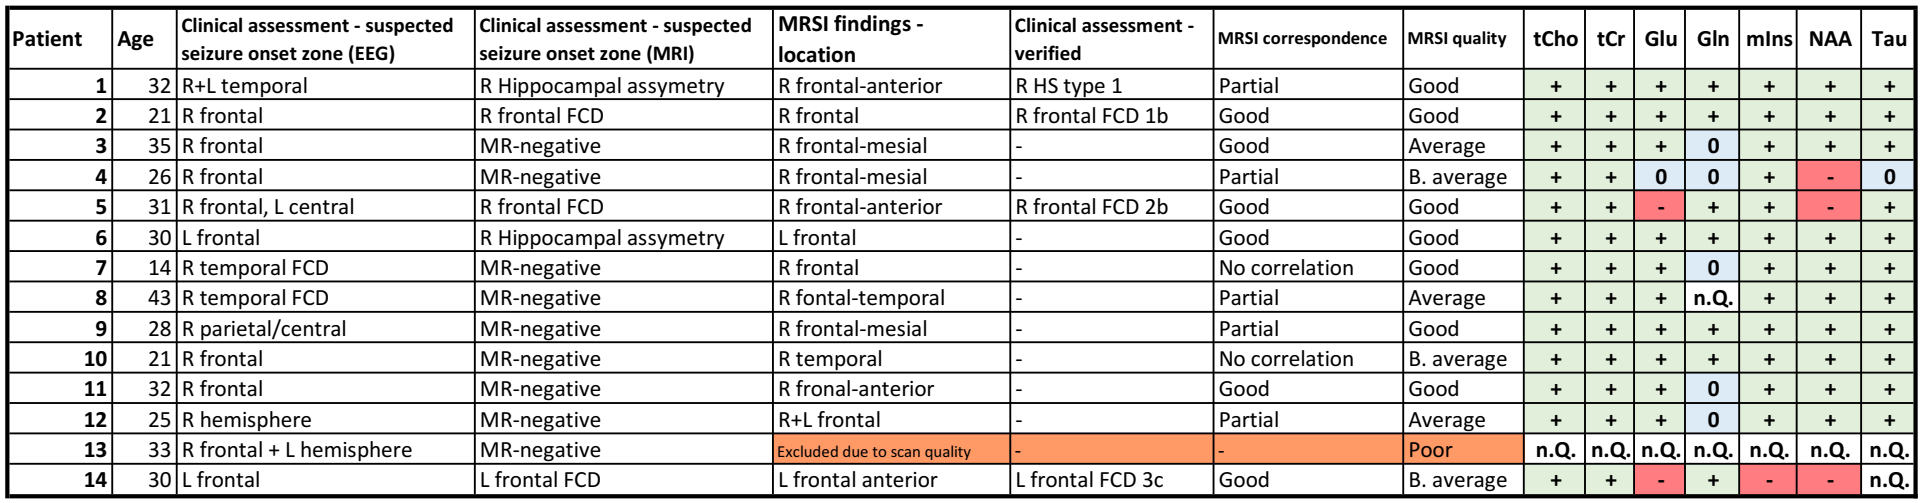
Fourteen patients with refractory focal epilepsy defined by the local epilepsy board (28±7 y, 10f/4m, Fig.1.) were enrolled in the study. They were measured with a 3D-MRSI protocol at a Siemens Magnetom 7T with a 32-channel coil (Nova Medical) after informed consent and approval of the institutional review board were obtained. We acquired MRSI with 3.4 mm isotropic resolution in 15:30 minutes measurement time. The MRSI parameters included: 64×64×39 matrix, 220×220×133 mm³ FOV, acquisition delay of 1.3 ms, TR 450 ms, 39° flip angle, WET water suppression. In addition to the standard MR epilepsy protocol at 3 Tesla, morphological imaging at 7T included T1w (MP2RAGE), T2w, FLAIR, white matter suppressed T2w, and SWI sequences.Postprocessing employed a Hamming filter and L2-regularisation [8] to remove lipid artefacts. The resulting voxel spectra were quantified using LCModel with a basis set including NAA, N-acetylaspartyl glutamate, tCr, tCho, myo-inositol (mIns), γ-aminobutyric acid, glutathione, glutamate (Glu), glutamine (Gln), glycine, taurine (Tau), cysteine, and serine in a spectral range of 1.8-4.1 ppm. The results were evaluated based on the resulting metabolite and ratio maps compared to clinical neurological assessment based on MRI and electroencephalography (Fig.1) and, if available, histology.
Results
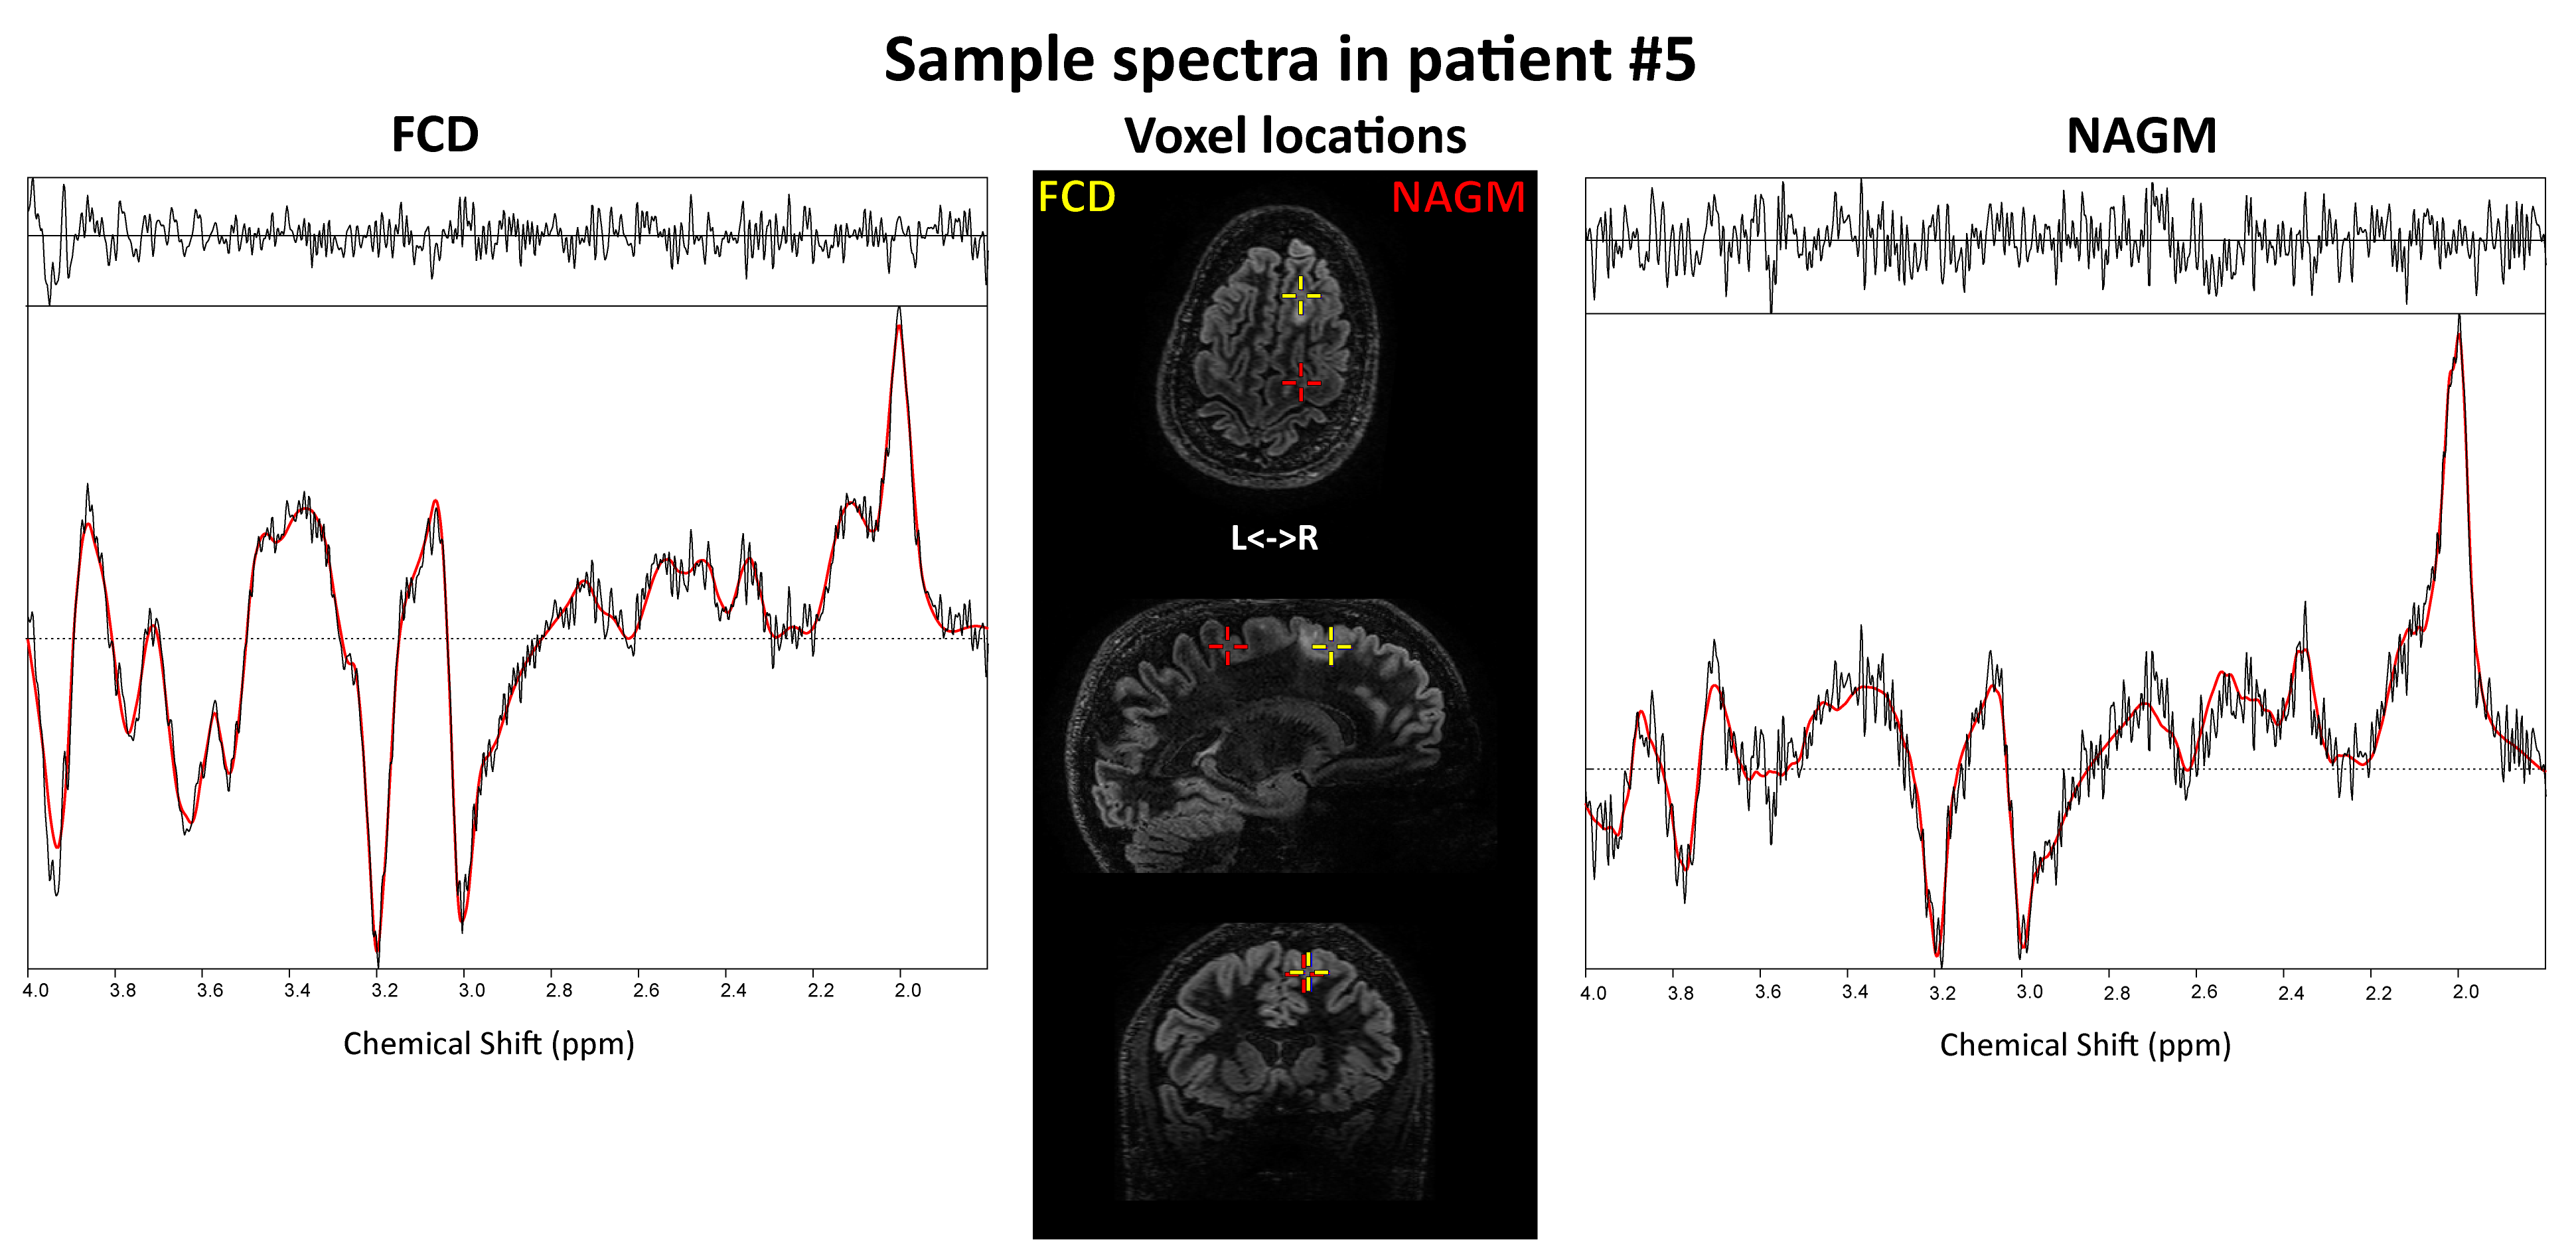
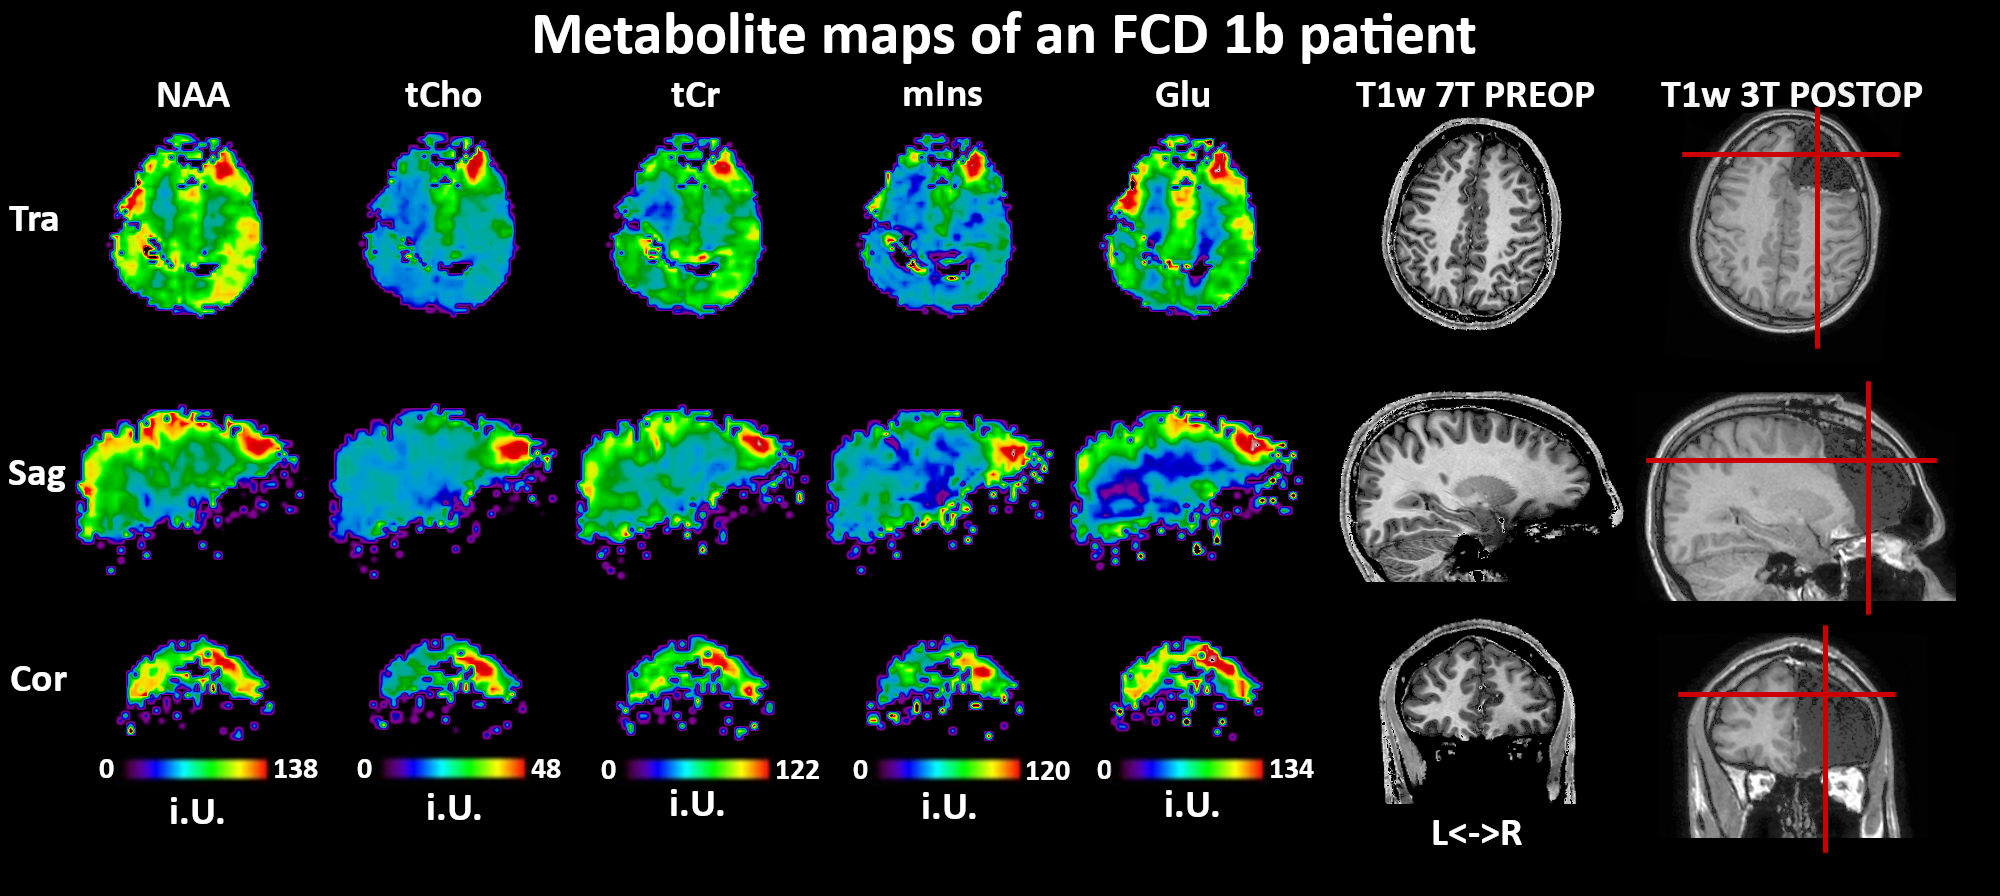
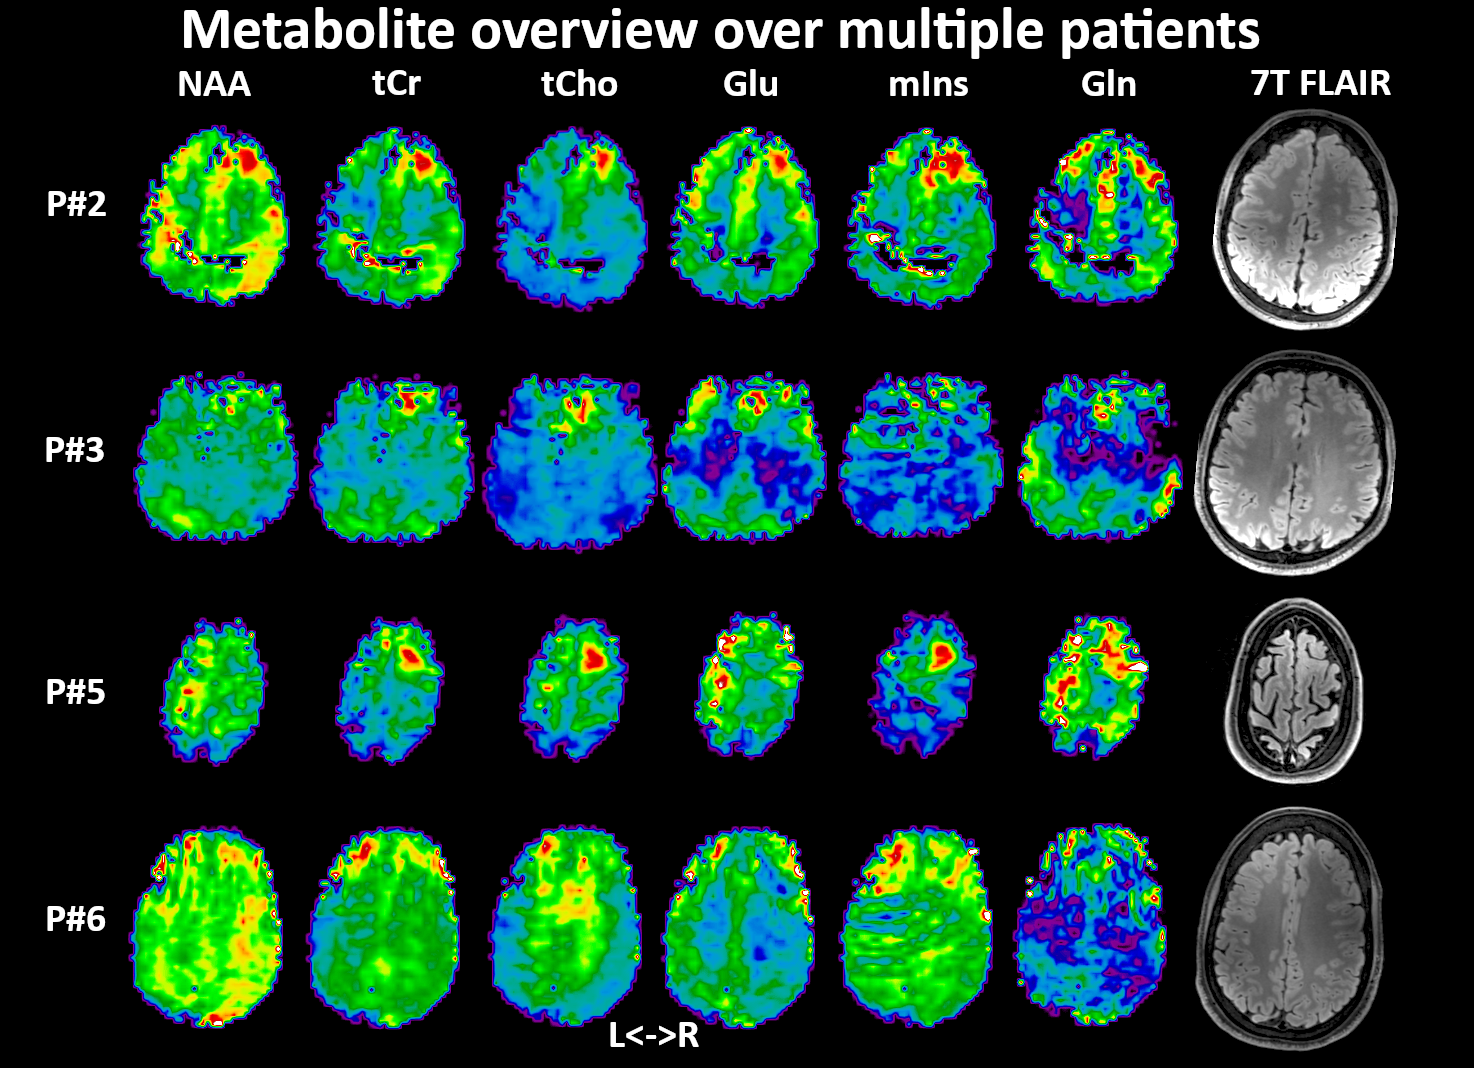
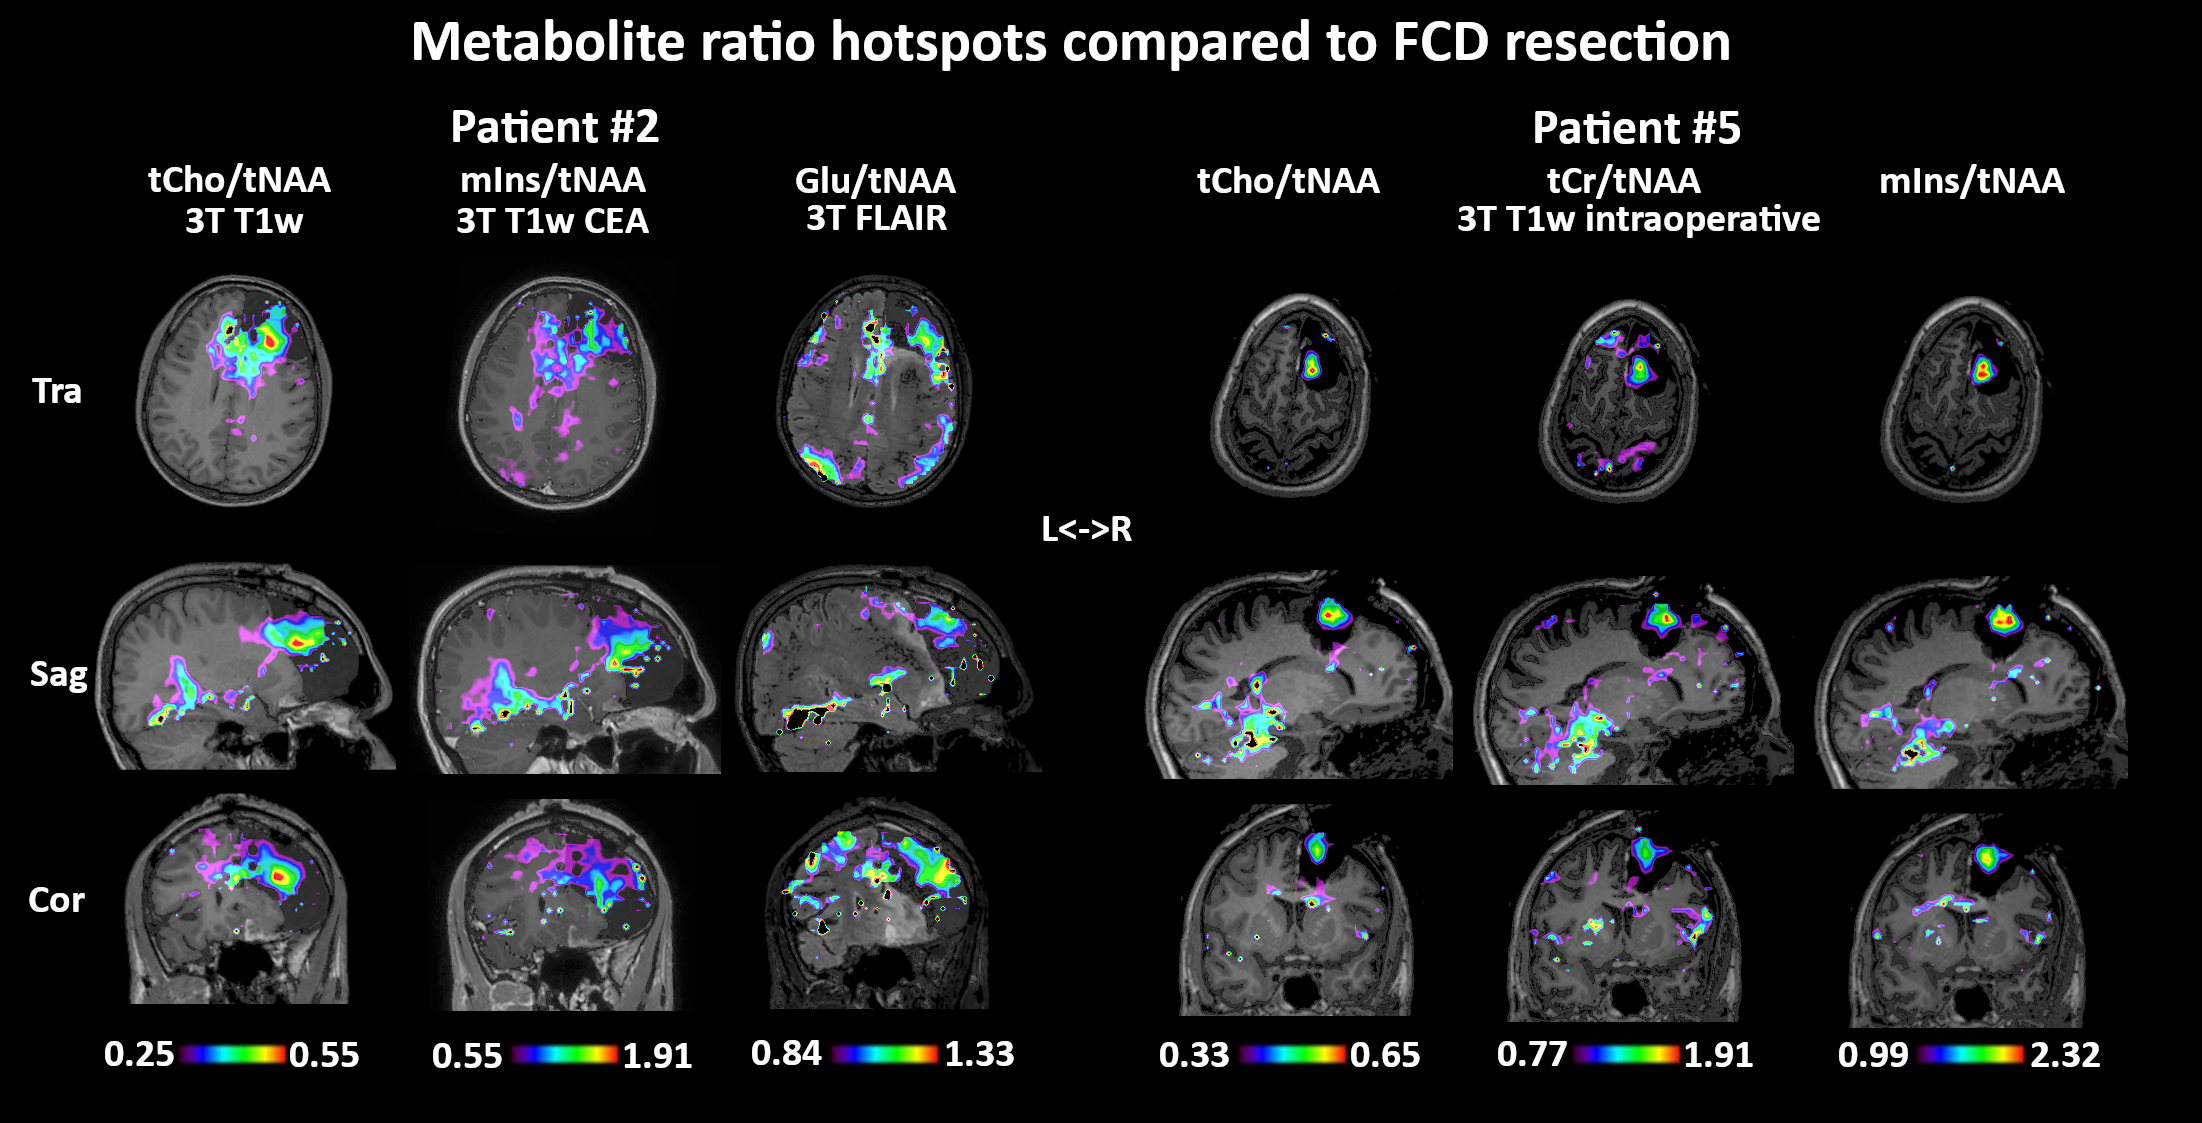
Acceptable MRSI data quality was achieved in thirteen of fourteen patients. Metabolic hotspots were identified in the remaining thirteen patients, corresponding at least partially to clinical preoperative assessment in 11/13 cases (Fig.1). tCr/tCho were increased in all of these hotspots, while variable changes with varying intensities were found for Glu/Gln/mIns/NAA/Tau. Sample spectra (Fig.2) display these changes, like tCho/tCr increases and an NAA decrease. Surprisingly, an increase of NAA was found in most patients, contrasting to the literature. Fig.3 shows an example of a clearly delineated hotspot in an FCD 1b patient. An overview of different MRSI hotspots is given in Fig.4. tCho, tCr, Glu, mIns and NAA appear as the most interesting candidates for metabolic profiling to identify a putative epileptic zone. In three verified FCD cases, metabolic findings aligned well to later lesion resection in a patient becoming seizure free till now. (Fig.5). Despite our findings of NAA increases, ratio maps as seen in Fig.5. show that the NAA increases are eclipsed by stronger changes such as in tCho.Discussion
We successfully established an exploratory dataset of unprecedented high-resolution metabolic images in thirteen patients suffering from refractory epilepsy. Our original findings point to tCr/tCho/mIns/NAA as promising metabolic markers in epileptogenic zones. Detected NAA increases contradict previous literature, but a lack of comparison data at 7T, disadvantages of single voxel spectroscopy or selection-box MRSI in regions difficult to assess and resolution differences make a comparison difficult. Our increased tCho/tNAA indicates that studies only reporting ratios could miss moderate NAA increases. Further explanations could be effects of previous antiepileptic pharmacological treatment or microstructural FCD associated changes on a cellular level. The three verified FCD cases agree with MRS literature on FCDs [9], with tCho as most distinct marker, and hint at the possibility of different metabolic profiles for FCD subclassifications.This study was limited by the small number of patients enrolled so far as well as limited histological verification. Our patient cohort is made up mostly from MRN cases that limit clinical comparability on the one hand but would most benefit from new diagnostic possibilities on the other hand. B0- and B1-field inhomogeneities limit the usable brain region, especially in the temporal lobe. Motion artefacts are clearly visible and require motion correction techniques to improve stability. Future research in a larger cohort of verified pathologies is necessary to confirm our findings over the whole metabolic panel.
In summary, preoperative metabolic imaging of epilepsy with high-resolution 7T MRSI has the potential to uncover epileptogenic zones in structurally normal MRI cases. Our results represent a new generation of metabolic imaging that may go beyond current MRSI and MRI in epilepsy.
Acknowledgements
This study was supported by the Austrian Science Fund (FWF): KLI-646, P 30701 and P 34198.References
[1] Hingerl et al., Invest. Rad. 2020, https://doi.org/10.1097/RLI.0000000000000626
[2] Hangel et al., NeuroImage:Clinical 2020, https://doi.org/10.1016/j.nicl.2020.102433
[3] Scheffer et al., Epilepsia 2017, https://doi.org/10.1111/epi.13709
[4] Wang et al., Epilepsia 2020, https://doi.org/10.1111/epi.16682
[5] Mueller et al., Epilepsia 2004, https://doi.org/10.1111/j.0013-9580.2004.27603.x
[6] Pan et al., Epilepsia 2013, https://dx.doi.org/10.1111%2Fepi.12322
[7] Van Veenendal et al., NeuroImage:Clinical 2018, https://doi.org/10.1016/j.nicl.2018.04.006
[8] Bilgic et al., MRM 2013, https://doi.org/10.1002/mrm.24399
[9] Tschampa et al., Seizure 2015, https://doi.org/10.1016/j.seizure.2015.08.008
Figures