0722
Deuterium metabolic imaging of tumor burden and response to therapy in mutant IDH gliomas in vivo1Radiology and Biomedical Imaging, University of California San Francisco, San Francisco, CA, United States, 2Cell Biology and Anatomy, University of Calgary and Hotchkiss Brain Institute, Calgary, AB, Canada, 3Neurological Surgery, University of California San Francisco, San Francisco, CA, United States
Synopsis
2H-magnetic resonance spectroscopy (MRS) recently emerged as a novel, non-invasive method of monitoring metabolic fluxes in high-grade glioblastomas in vivo. However, its utility for imaging low-grade gliomas and for assessing treatment response has not been examined. Here, we show that [6,6’-2H]-glucose metabolism to lactate serves to delineate tumor from contralateral normal brain in mice bearing orthotopic patient-derived low-grade glioma xenografts. Importantly, reduced lactate production from [6,6’-2H]-glucose informs on early response to therapy, at timepoints when volumetric alterations cannot be detected by anatomical imaging, pointing to the ability of [6,6’-2H]-glucose to assess pseudoprogression, which is a major challenge in glioma imaging.
INTRODUCTION
The Warburg effect, which is characterized by elevated glucose uptake and flux to lactate, is a metabolic hallmark of cancer.1 The Warburg effect has been leveraged for positron emission tomography imaging using the radioactive glucose analog 2-18F-fluoro-2-deoxy-D-glucose (FDG-PET). However, FDG-PET does not inform on downstream glucose metabolism and fails in tissues with high glucose uptake including the brain.2 Recent studies have identified deuterium (2H)-magnetic resonance spectroscopy (MRS) using [6,6’-2H]-glucose as a novel method of imaging the Warburg effect in high-grade primary glioblastomas (GBMs).2 However, its utility for imaging low-grade gliomas and for assessing treatment response has not been tested. The goal of this study was to determine whether [6,6’-2H]-glucose can be used for imaging tumor burden and treatment response in mutant isocitrate dehydrogenase (IDHmut) low-grade gliomas in vivo.METHODS
Cell studies: Immortalized normal human astrocytes were maintained in Dulbecco’s modified Eagles medium.3 BT257 cells were maintained as neurospheres in serum-free medium4 and the effect of 1mM niraparib assessed by counting cell number at 72h. For 13C-MRS studies, neurospheres were cultured in medium containing 35mM [1-13C]-glucose for 72h5 and [1-13C]-lactate and [1-13C]-glucose levels in media calculated. Glucose uptake was calculated as the difference in normalized fmol (Δfmol/cell) between 0 and 72h.Orthotopic tumor implantation and treatment: We examined mice bearing orthotopic tumors of the BT257 model, which was derived from a patient carrying an IDHmut low-grade astrocytoma.4 Eight 6-to-8-week-old female SCID mice were intracranially injected with ~3×10⁵ BT257 cells. Once tumors reached a volume of ~20-25mm3 (day zero, D0), mice were randomized into treatment (100 mg/kg niraparib oral daily) or control (saline) groups.
Anatomic MR imaging: MR studies were performed using a 14.1T vertical system (Agilent) equipped with a single-channel volume 1H coil. A spin echo multi-slice sequence was used for axial T2-weighted MRI (TE=20ms, TR=1200ms, field of view=30×30 mm2, matrix=256×256, slice thickness=1mm, number of averages=4). Tumor volume was evaluated as the sum of manually contoured tumor areas in each slice multiplied by slice thickness.
2H-MRS studies: Animals were positioned prone under a 16mm 2H surface coil (DOTY Scientific). Following injection of a bolus of [6,6’-2H]-glucose (1g/kg) via a tail-vein catheter over 25-35s, non-localized 2H-MR spectra were acquired over 66 minutes with a pulse-acquire sequence (TR=500ms, averages=500, complex points=512, flip angle=64, spectral width=2kHz, temporal resolution = 4min 10s). 2H spectra were referenced to semi-heavy water (HDO; 4.75 ppm, MestReNova). The area under the curve (AUC) for [3,3’-2H]-lactate was normalized to [6,6’-2H]-glucose and HDO for the sum of all spectra. For spatial localization, a 2D chemical shift imaging (CSI) sequence with TE/TR=1.35/250ms, FOV=30x30mm2, 7x7, 128 points, 2.5kHz spectral width, NA=20 was used and data analyzed using in-house Matlab codes.
Statistical analysis: All results are expressed as mean±standard deviation. Statistical significance was assessed using an unpaired two-tailed Student’s t-test with p<0.05 considered significant.
RESULTS
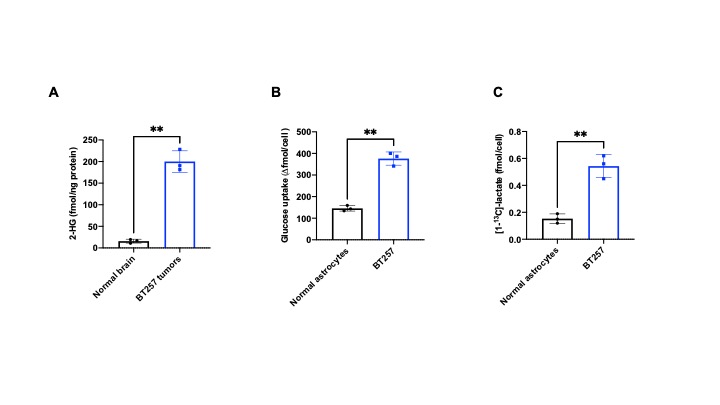
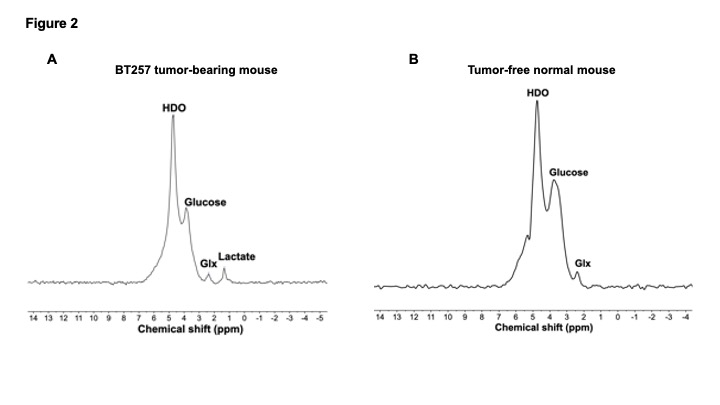
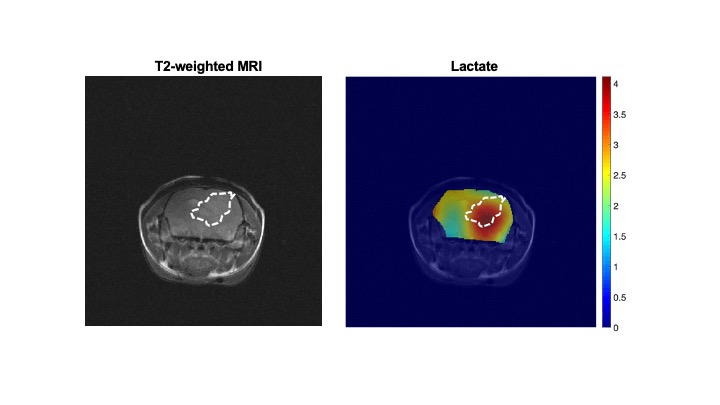
IDHmut gliomas display the Warburg effect: Low-grade gliomas are defined by the presence of IDHmut, which converts α-ketoglutarate to the oncometabolite 2-hydroxyglutarate and drives tumorigenesis via epigenetic alterations.6 Using 1H-MRS, which informs on steady-state metabolite levels, we confirmed the presence of 2-hydroxyglutarate in BT257 tumor tissue but not normal brain (Fig.1A). Previous studies comparing low-grade IDHmut gliomas with high-grade GBMs suggest that IDHmut gliomas undergo lactate dehydrogenase A silencing, potentially leading to a non-glycolytic phenotype.7 Nevertheless, using thermally polarized 13C-MRS, we established that [1-13C]-glucose uptake and flux to [1-13C]-lactate were significantly higher in BT257 neurospheres relative to normal human astrocytes (Fig.1B-1C). These results indicate that, similar to most cancers,1 the Warburg effect is a metabolic phenotype of IDHmut gliomas.2H-MRS monitors tumor burden in IDHmut gliomas in vivo: In line with higher glucose uptake and lactate production in BT257 neurospheres relative to normal human astrocytes, [6,6’-2H]-glucose metabolism to lactate was observed in BT257 tumor-bearing mice (Fig.2A). In contrast, tumor-free mice showed production of glutamate/glutamine, but not lactate (Fig.2B). Importantly, 2D CSI confirmed spatial localization of lactate to the tumor vs. contralateral normal brain in mice bearing orthotopic BT257 tumors (Fig.3).
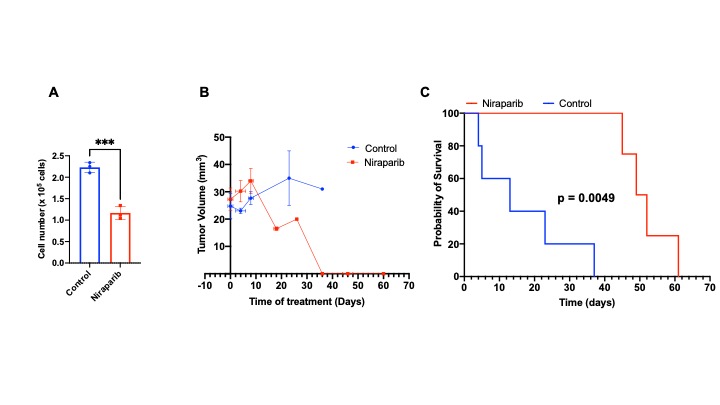
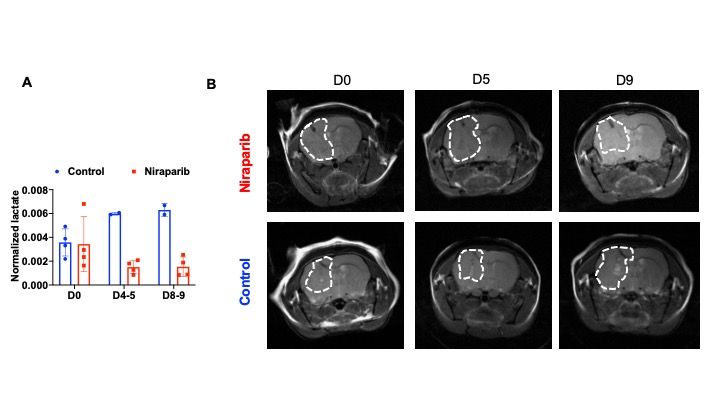
2H-MRS monitors early response to therapy in IDHmut gliomas in vivo: Poly-(adenosine 5′-diphosphate-ribose) polymerase inhibitors (PARPi) inhibit IDHmut glioma growth and are in clinical trials for IDHmut glioma patients.8,9 We confirmed that the PARPi niraparib significantly inhibits growth of BT257 neurospheres (Fig.4A). Treatment of mice bearing orthotopic BT257 tumors with niraparib induced tumor shrinkage as assessed by T2-weighted MRI, an effect that was apparent by D18 (Fig.4B) and resulted in significantly enhanced survival (Fig.4C). Importantly, [6,6’-2H]-glucose flux to lactate was reduced in BT257 tumor-bearing mice treated with niraparib relative to controls (Fig.5A). Furthermore, this reduction was observed at early time-points (D4-5 and D8-9) when no difference in tumor volume could be detected by MRI (Fig.5B) pointing to the potential ability of [6,6’-2H]-glucose to assess pseudoprogression.
CONCLUSION
We show that IDHmut gliomas display the Warburg effect, which can be leveraged for non-invasive, non-radioactive 2H-MRS-based imaging of tumor burden in vivo. Importantly, [6,6’-2H]-glucose flux to lactate can be used for non-invasive visualization of IDHmut glioma response to therapy at early time-points when volumetric alterations cannot be detected by MRI, suggesting that [6,6’-2H]-glucose has the potential to assess pseudoprogression, which is a major challenge in glioma imaging.10Acknowledgements
This study was supported by NIH R01CA239288 and Department of Defense W81XWH201055315.References
1. Vander Heiden M et al. Understanding the Warburg Effect: The Metabolic Requirements of Cell Proliferation. Science, 324: 1029, 2009.
2. De Feyter H et al. Deuterium metabolic imaging (DMI) for MRI-based 3D mapping of metabolism in vivo. Sci. Adv. 2018; 4: eaat7314 22 August 2018.
3. Sonoda Y et al. Formation of Intracranial Tumors by Genetically Modified Human Astrocytes Defines Four Pathways Critical in the Development of Human Anaplastic Astrocytoma. Cancer Res, 61:4956-4960, 2001.
4. Mazor T et al. Clonal expansion and epigenetic reprogramming following deletion or amplification of mutant IDH1. PNAS, 114(40): 10743–10748, 2017.
5. Izquierdo-Garcia J, Viswanath P et al. IDH1 Mutation Induces Reprogramming of Pyruvate Metabolism Cancer Res. 75(15): 2999-3009, 2015.
6. Cairns R and Mak T et al. Oncogenic Isocitrate Dehydrogenase Mutations: Mechanisms, Models, and Clinical Opportunities. Cancer Discov, 3(7); 1-12, 2013.
7. Chesnelong C et al. Lactate dehydrogenase A silencing in IDH mutant gliomas. Neuro-Oncology16(5), 686–695, 2014.
8. Sulkowski P et al. 2-Hydroxyglutarate produced by neomorphic IDH mutations suppresses homologous recombination and induces PARP inhibitor sensitivity. Sci Transl Med, 9(375):eaal2463, 2017.
9. Lu Y et al. Chemosensitivity of IDH1-Mutated Gliomas Due to an Impairment in PARP1-Mediated DNA Repair. Cancer Res, 77(7):1709-1718, 2017.
10. Villanueva-Meyer J et al. Current
Clinical Brain Tumor Imaging. Neurosurgery 81:397-415, 2017.
Figures