0721
Peritumoral radiomics features from amide proton transfer-weighted MRI unveil the progressive pattern in early recurrent malignant gliomas1Department of Radiology, Johns Hopkins University, Baltimore, MD, United States, 2Whiting School of Engineering, Johns Hopkins University, Baltimore, MD, United States, 3F.M. Kirby Research Center for Functional Brain Imaging, Kennedy Krieger Institute, Baltimore, MD, United States
Synopsis
Assessing post-treatment malignant gliomas early has remained one of the most critical dilemmas in neuro-oncology for three decades. Amide protein transfer weighted (APTw) MRI has been validated to accurately detect recurrent malignant gliomas in more and more studies. The peritumoral area, as the one of the most aggressive regions, has been seldom studied. Here, we explore radiomics features extracted from peritumoral areas on APTw images to unveil the progressive pattern in early recurrent malignant gliomas. Our results suggest that the use of APTw radiomic features can add important value to structural MRI to assess the treatment response.
Purpose
Malignant gliomas, such as grade-IV glioblastoma and grade-III anaplastic astrocytoma, are the most common and deadly primary brain cancers in adults1. Because of the basement membrane barrier effect, diffuse infiltration of glioma cells into surrounding brain tissue has been proved significant for migration/invasion of malignant gliomas2. However, the peritumoral areas, the most aggressive regions for post-treatment malignant gliomas, have been seldom studied. Amide proton transfer-weighted (APTw) MRI, a method generating the MRI contrast dominated by endogenous cellular proteins or tumor cellularity, is showing an encouraging diagnostic performance for gliomas3-6. Here, we extract APTw MRI radiomic features from peritumoral areas and quantify the accuracy of an interpretable machine learning model for identifying the progressive radiographic patterns in recurrent malignant glioma. The goal was to evaluate the power of APTw-based peritumoral radiomics for classification of treatment effects and tumor recurrence in post treatment malignant gliomas.Methods
PatientsA total of 90 patients (26 grade III and 64 grade IV) with suspect treatment effects and tumor recurrence were re-assessed. For this study, part of the patients came from previous studies3,6. Each patient had all study-related MRI data within 6 months after their standard chemoradiation regimen completion. Patients were diagnosed as tumor recurrence vs. treatment effects based on histopathologic diagnosis or the longitudinal MRI analysis according to the updated RANO criteria7.
MRI protocol
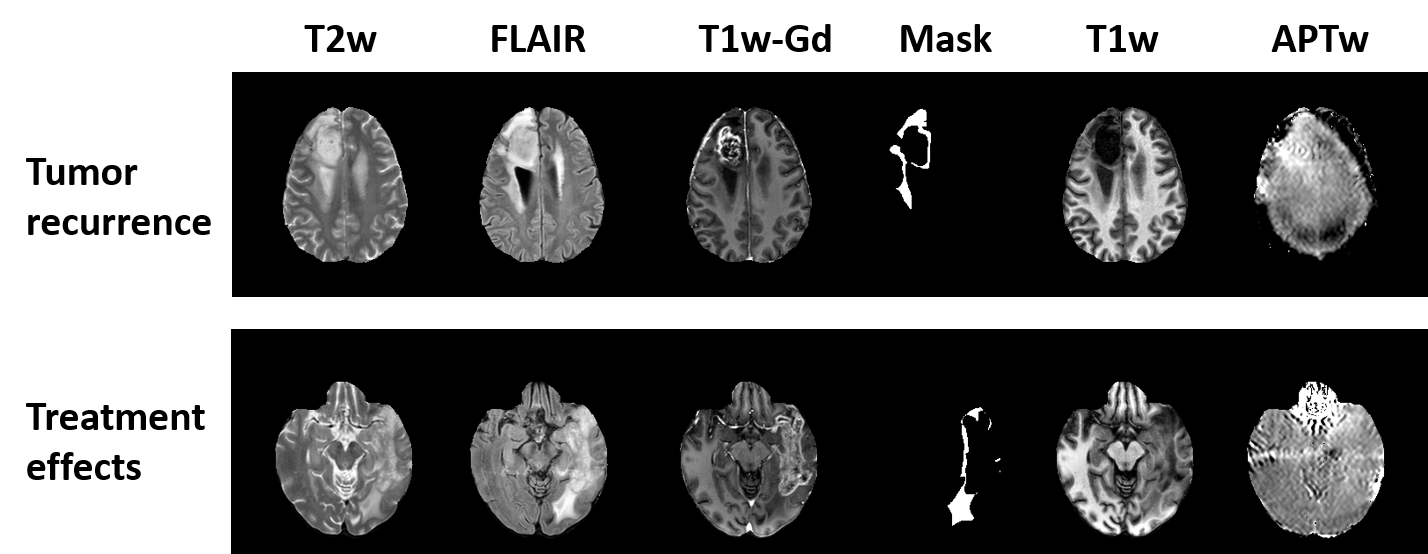
All patients were scanned on a Philips 3T Achieva MRI system. The sequences performed for each patient included T1w, T2w, FLAIR, APTw, and gadolinium contrast-enhanced T1w (T1w-Gd). A 3D imaging acquisition scheme was used for volumetric APTw imaging (saturation power = 2 μT; saturation time = 800 msec)8. APTw images were calculated using the magnetization transfer ratio asymmetry at 3.5ppm offset from the water frequency.
Data postprocessing
T1w, T2w, FLAIR, T1w-Gd and APTw MRI were resampled and co-registered. Normalization, bias correction, and skull-stripping were applied. Manual annotation was performed by a radiologist who segmented the peritumoral regions with abnormal FALIR/T2w signal intensities outside the gadolinium-enhanced tumor core using 3D Slicer9. Then, the peritumoral mask from the slice of the maximal tumor for each subject was chosen to apply for feature extraction. Radiomic features, including: (i) first-order statistics; (ii) shape and size; (iii) texture; and (iv) wavelet, were extracted from the tumor ROIs by a customized PyRadiomics program10,11.
Statistical analysis
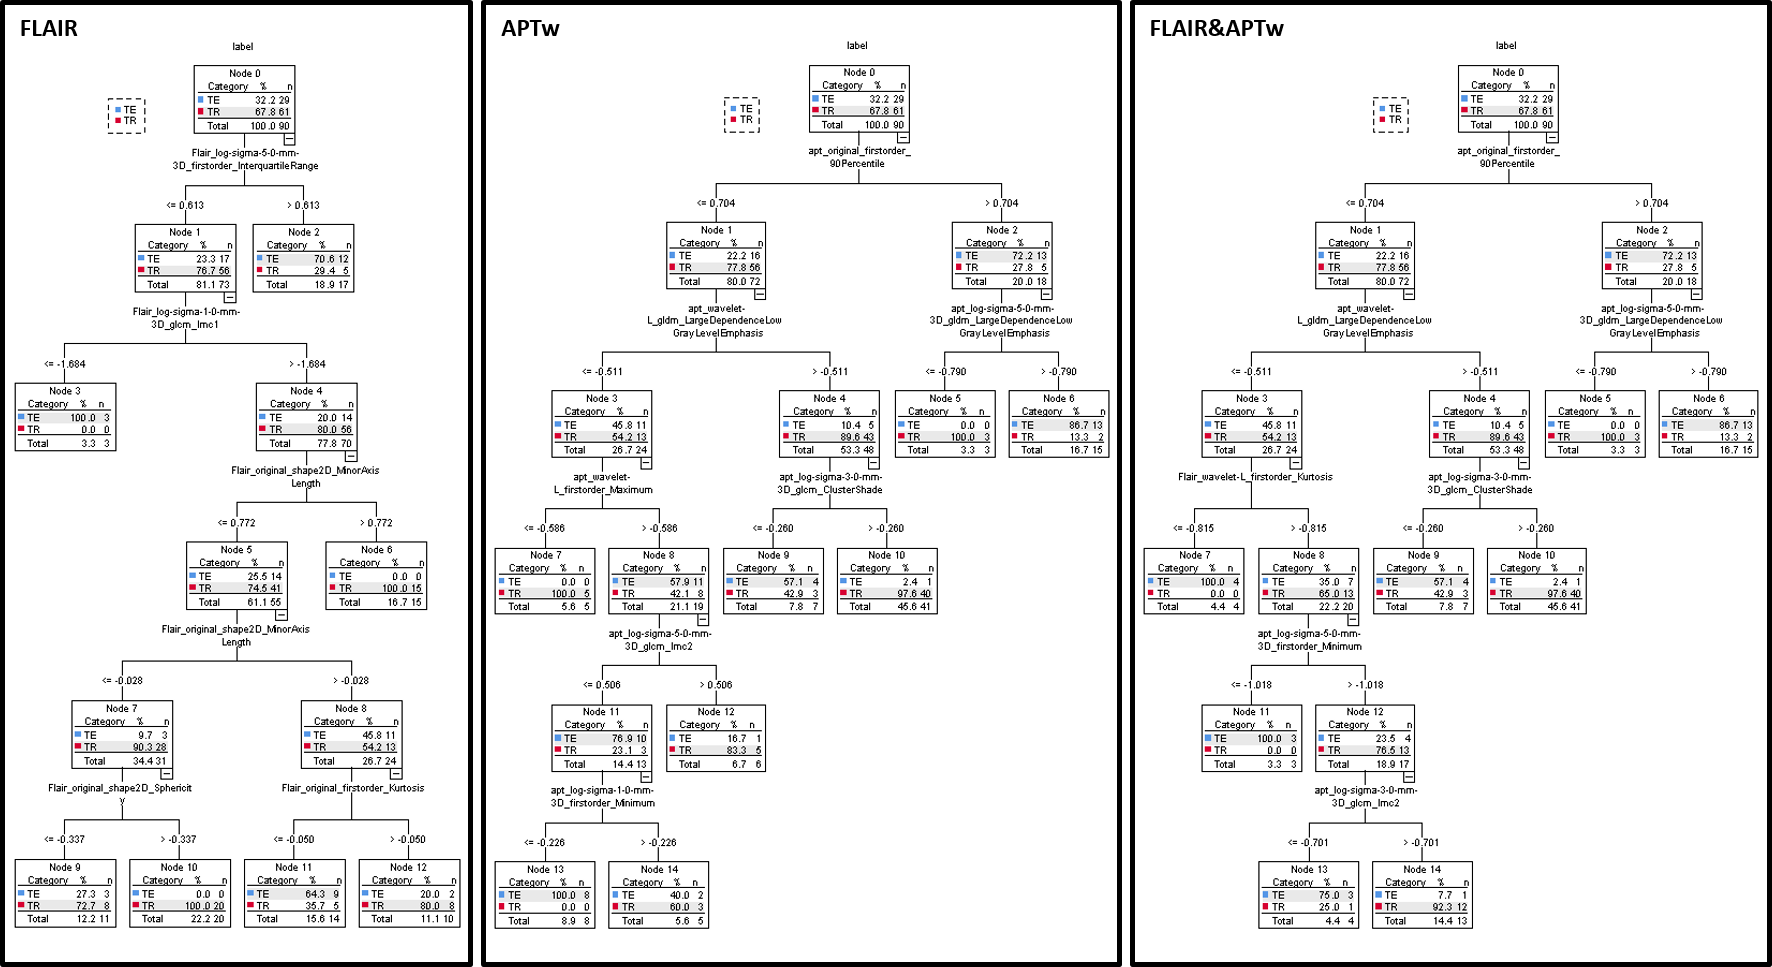
For the feature selection, univariate analysis was performed to compare radiomic features between tumor recurrence and treatment effects to identify features with significant difference. Pairs of features with a correlation coefficient |r| > 0.85 were removed after the Pearson correlation analysis. Then, a current reality tree (CRT) was constructed to identify the core features that are most critical when differentiating tumor recurrence from treatment effects. Ten-fold cross-validation was applied to get an overall estimation of the classification performance of the model. The alpha level of all tests was set at P < 0.05.
Results and Discussion
29 patients were confirmed as tumor recurrence, and the remaining 61 patients as treatment effect on biopsy or RANO criteria. Fig. 1 shows typical structural and APTw MR images for two GBM patients with tumor recurrence and treatment effects, respectively. The CRT model achieved accuracies of 83.3% with radiomic features extracted from the FLAIR images, while 90.0% with the APTw derived features, and 91.1% with the features from both the FLAIR and APTw images. The corresponding sensitivity and specificity data are listed in Table 1. The 90 percentile value of APTw signal intensity, a first order feature, was listed as the first class of features helping to distinguish the two entities in both of the decision trees based on APTw and FLAIR&APTw MRI models. The corresponding cut-off value to confirm tumor recurrence is larger than 0.704. For the FLAIR MRI model, the CRT decision tree identified that the interquartile range value of FLAIR signal intensity, extracted from the Laplacian of Gaussian (LoG) filtered FLAIR images using sigma with 5mm as the most significant predictor of tumor recurrence. The tree diagrams showing the branch reflecting the decision output, and leaf node with critical radiomic features that contributed most to the models are presented in Fig. 2.Conclusion
As a pilot study, the findings of our study support that the use of APTw MRI derived features is capable of capturing the progressive pattern in peritumoral areas. Compared to structural MRI, APTw MRI aids the accurate treatment response assessment for post treatment malignant gliomas by increasing detection specificity.Acknowledgements
This work was supported in part by grants from the National Institutes of Health (R21CA227783, R01CA228188, P41015909 and R01CA248077).References
1 Wen, P. Y. et al. Updated response assessment criteria for high-grade gliomas: response assessment in neuro-oncology working group. J. Clin. Oncol. 28, 1963-1972 (2010).
2 Mourad, P. D., Farrell, L., Stamps, L. D., Chicoine, M. R. & Silbergeld, D. L. Why are systemic glioblastoma metastases rare? Systemic and cerebral growth of mouse glioblastoma. Surg Neurol 63, 511-519; discussion 519, doi:10.1016/j.surneu.2004.08.062 (2005).
3 Jiang, S. et al. Identifying recurrent malignant glioma after treatment using amide proton transfer-weighted MR imaging: A validation study with image-guided stereotactic biopsy. Clin. Cancer Res., doi: 10.1158/1078-0432.CCR-1118-1233 (2018).
4 Park, J. E. et al. Amide proton transfer imaging seems to provide higher diagnostic performance in post-treatment high-grade gliomas than methionine positron emission tomography. Eur Radiol 28, 3285-3295, doi:10.1007/s00330-018-5341-2 (2018).
5 Meissner, J. E. et al. Early response assessment of glioma patients to definitive chemoradiotherapy using chemical exchange saturation transfer imaging at 7 T. J Magn Reson Imaging 50, 1268-1277, doi:10.1002/jmri.26702 (2019).
6 Ma, B. et al. Applying amide proton transfer-weighted MRI to distinguish pseudoprogression from true progression in malignant gliomas. J. Magn. Reson. Imaging 44, 456-462, doi:10.1002/jmri.25159 (2016).
7 Eisele, S. C., Wen, P. Y. & Lee, E. Q. Assessment of brain tumor response: RANO and its offspring. Curr. Treat. Options Oncol. 17, 35, doi:10.1007/s11864-016-0413-510.1007/s11864-016-0413-5 [pii] (2016).
8 Zhou, J. et al. Three-dimensional amide proton transfer MR imaging of gliomas: Initial experience and comparison with gadolinium enhancement. J. Magn. Reson. Imaging 38, 1119-1128 (2013).
9 Fedorov, A. et al. 3D Slicer as an image computing platform for the Quantitative Imaging Network. Magn Reson Imaging 30, 1323-1341, doi:10.1016/j.mri.2012.05.001 (2012).
10 PyRadiomics, https://pyradiomics.readthedocs.io.11 van Griethuysen, J. J. M. et al. Computational radiomics system to decode the radiographic phenotype. Cancer Res. 77, e104-e107, doi:10.1158/0008-5472.CAN-17-033977/21/e104 [pii] (2017).
Figures