0718
Inhomogeneous magnetization transfer in the healthy adult brain: reproducibility and correlation with MTR and myelin water imaging
Sarah Rosemary Morris1,2,3, Irene M. Vavasour1,4, Anastasia Smolina5,6, Erin MacMillan4,7, Guillaume Gilbert7, Michelle Lam2,4, Piotr Kozlowski1,2,4,8, Carl Michal2, Alan Manning2, Alex L. MacKay1,2,4, and Cornelia Laule1,2,4,8,9
1Radiology, University of British Columbia, Vancouver, BC, Canada, 2Physics & Astronomy, University of British Columbia, Vancouver, BC, Canada, 3International Collaboration on Repair Discoveries, Vancouver, BC, Canada, 4UBC MRI Research Centre, Vancouver, BC, Canada, 5Physics & Astronomy, McMaster University, Hamilton, ON, Canada, 6Hospital for Sick Children, Toronto, ON, Canada, 7MR Clinical Science, Philips Healthcare Canada, Markham, ON, Canada, 8International Collaboration on Repair Discoveries (ICORD), Vancouver, BC, Canada, 9Pathology & Laboratory Medicine, University of British Columbia, Vancouver, BC, Canada
1Radiology, University of British Columbia, Vancouver, BC, Canada, 2Physics & Astronomy, University of British Columbia, Vancouver, BC, Canada, 3International Collaboration on Repair Discoveries, Vancouver, BC, Canada, 4UBC MRI Research Centre, Vancouver, BC, Canada, 5Physics & Astronomy, McMaster University, Hamilton, ON, Canada, 6Hospital for Sick Children, Toronto, ON, Canada, 7MR Clinical Science, Philips Healthcare Canada, Markham, ON, Canada, 8International Collaboration on Repair Discoveries (ICORD), Vancouver, BC, Canada, 9Pathology & Laboratory Medicine, University of British Columbia, Vancouver, BC, Canada
Synopsis
We compared three myelin-sensitive MRI metrics (inhomogeneous magnetization transfer ratio (ihMTR), magnetization transfer ratio (MTR) and gradient and spin echo-derived myelin water fraction (MWF)) in 15 white matter regions of interest from 14 healthy adults at 3T. Reproducibility of ihMTR was also investigated. We found a moderately strong correlation between MWF and ihMTR but only a very weak correlation between MWF and MTR. Myelination rankings were similar for ihMTR and MWF but had no relation to MTR. Finally, we established an average ihMTR scan-rescan variability of 8.2% of the mean in each ROI.
Introduction
Magnetization transfer is a common contrast mechanism, for which images are obtained with ($$$S_+$$$) and without ($$$S_0$$$) an off-resonance pre-pulse. The magnetization transfer effect can be quantified as a ratio:$$ MTR = \frac{S_+ - S_0}{S_0} $$
The off-resonance pre-pulse saturates semi-solid protons in tissue. This saturation, via exchange processes with water, results in sensitivity to many aspects of the tissue microstructure including myelin content. The sensitivity of MTR to myelin has been validated in both human and animal tissue.1,2 However MTR is also influenced by tissue water content, which reduces the myelin specificity of the technique and therefore its utility in research.3
Inhomogeneous magnetization transfer is a novel development to the MTR method which shows promise as a myelin-specific imaging technique.4,5 It requires 5 images: a reference image with no pre-pulse ($$$S_0$$$), two images with single negative/positive frequency-offset pre-pulses ($$$S_+$$$/$$$S_-$$$) and two images with dual alternating-offset pre-pulses ($$$S_{+-}$$$/$$$S_{-+}$$$) which are combined to give the ratio6,7:
$$ ihMTR = \frac{S_++S_--S_{+-}-S_{-+}}{2S_0}$$
The double subtraction in the numerator is included to correct for any asymmetry of the macromolecular line and is balanced by dividing by 2. Some other definitions do not include this 2.4,5,8 Unlike MTR which is sensitive to all non-aqueous protons, ihMTR is only sensitive to those protons experiencing dipolar interactions with a long dipolar order relaxation time in a motion-restricted environment such as a lipid membrane. ihMTR has been validated as a myelin biomarker using fluorescence microscopy.9
Myelin water imaging (MWI) is another way to measure myelin. MWI isolates the short T2 signal from water trapped between myelin bilayers. Voxel-wise myelin water fraction (MWF) is defined as the fraction of signal below the myelin water T2 cut-off. MWF has been histologically validated as a marker for myelin.10–12
Aims: (1) To compare in vivo brain ihMTR and MTR with MWI, assessing the correlation between the metrics and consistency of myelination rankings between white matter structures. (2) To assess the reproducibility of ihMTR.
Methods
Acquisition and analysis:14 healthy volunteers (3 male, mean age=27yrs, range=21-48yrs) were scanned at 3T (Philips Achieva) with an 8-channel head-coil. Three participants were scanned twice, in separate scan sessions a few weeks apart. ihMT, MWI and 3DT1 scan parameters and processing are shown in Figure 1.
ROI analysis:
- The first echo from GRASE and the $$$S_0$$$ image from ihMT were brain extracted (FSL bet13) and linearly registered to each participant’s 3DT1 scan (FSL flirt, 6 degrees of freedom17).
- 3DT1 scans were registered to MNI standard space (FSL fnirt14). The warp produced was used to register white matter ROIs from the JHU White Matter Labels atlas15 to the 3DT1 space.
- All ROIs in the JHU White Matter Labels were included except those which were outside of the field of view or had fewer than 1000 voxels after registration. Left and right bilateral ROIs were combined into one ROI, resulting in 15 ROIs for investigation.
- A white matter mask was created for each participant (FSL FAST16) and used to mask the data to include only white matter voxels. Mean and standard deviation values for ihMTR, MTR and MWF were extracted for each ROI.
- The Pearson correlation coefficient ($$$r$$$) and the p-value for non-correlation were calculated to test the bivariate correlation between ihMTR and MWF and MTR and MWF. ihMTR, MTR and MWF rankings between white matter ROIs were investigated. Metrics from the scan-rescan data sets were plotted on a Bland-Altman graph.
Results and Discussion
Five example data sets are shown in Figure 2. MWF, MTR and ihMTR values in white matter were consistent with previous observations in existing literature. We found a moderately strong correlation between ihMTR and MWF ($$$r$$$=0.671, p<0.001), similar to that found in a smaller study by Ercan et al..17 MTR and MWF had a much weaker correlation ($$$r$$$=0.166, p=0.016) (Figure 3).The ranking of white matter brain structures by ihMTR was more similar to MWF than to MTR (Figure 4). MWF had a greater range of mean values (5-21%) across different white matter structures than either ihMTR (2.8-4.8%) or MTR (19-22%). MWF also had the highest variability across people within each ROI (mean coefficient of variation (CoV)=17%) compared to ihMTR (mean CoV=8.0%) and MTR (mean CoV=3.4%).
The Bland–Altman analysis (Figure 5) showed ihMTR had a mean scan‐rescan difference fairly close to zero (0.3%). There was no bias in the differences with increasing ihMTR, suggesting that ihMTR measurements are robust at different levels of myelination. Only one ROI for one participant was outside the limits of agreement (defined as 1.96 times the mean standard deviation of the differences). Average scan-rescan variability of ihMTR in an ROI was 8.2% of the mean, slightly higher than that found by Mchinda et al., but still adequately reproducible.18
Conclusions
Moderately strong correlation and similarity in myelination rankings between ihMTR and MWF shows that these two techniques are detecting the same variations in white matter myelination through different contrast mechanisms. MWF had the greatest variation both between and within white matter structures perhaps suggesting a higher sensitivity to small differences in myelination. IhMTR for white matter ROIs was found to be reproducible with an average scan-rescan variability of 8.2% of the mean value.Acknowledgements
We would like to thank the participants and technologists at the UBC MRI Research Centre. This study was funded by the Natural Sciences and Engineering Research Council (NSERC) of Canada.References
- Schmierer, K. et al. Quantitative magnetization transfer imaging in postmortem multiple sclerosis brain. Journal of Magnetic Resonance Imaging 26, 41–51 (2007).
- Deloire-Grassin, M. S. A. et al. In vivo evaluation of remyelination in rat brain by magnetization transfer imaging. Journal of the Neurological Sciences 178, 10–16 (2000).
- Vavasour, I. M., Laule, C., Li, D. K. B., Traboulsee, A. L. & MacKay, A. L. Is the magnetization transfer ratio a marker for myelin in multiple sclerosis? Journal of Magnetic Resonance Imaging 33, 710–718 (2011).
- Varma, G., Duhamel, G., de Bazelaire, C. & Alsop, D. C. Magnetization Transfer from Inhomogeneously Broadened Lines: A Potential Marker for Myelin. Magnetic Resonance in Medicine 73, 614–622 (2015).
- Girard, O. M. et al. Magnetization transfer from inhomogeneously broadened lines (ihMT): Experimental optimization of saturation parameters for human brain imaging at 1.5 Tesla. Magnetic Resonance in Medicine 73, 2111–2121 (2015).
- Zhang, L. et al. A comparison study of inhomogeneous magnetization transfer (ihMT) and magnetization transfer (MT) in multiple sclerosis based on whole brain acquisition at 3.0 T. Magnetic Resonance Imaging 70, 43–49 (2020).
- Manning, A. P., Chang, K. L., MacKay, A. L. & Michal, C. A. The physical mechanism of ‘inhomogeneous’ magnetization transfer MRI. Journal of Magnetic Resonance 274, 125–136 (2017).
- Varma, G. et al. Interpretation of magnetization transfer from inhomogeneously broadened lines (ihMT) in tissues as a dipolar order effect within motion restricted molecules. Journal of Magnetic Resonance 260, 67–76 (2015).
- Duhamel, G. et al. Validating the sensitivity of inhomogeneous magnetization transfer (ihMT) MRI to myelin with fluorescence microscopy. NeuroImage 199, 289–303 (2019).
- Laule, C. et al. Myelin water imaging in multiple sclerosis: quantitative correlations with histopathology. Multiple Sclerosis Journal 12, 747–753 (2006).
- Laule, C. et al. Myelin water imaging of multiple sclerosis at 7T: correlations with histopathology. NeuroImage 40, 1575–1580 (2008).
- Laule, C. et al. High-resolution myelin water imaging in post-mortem multiple sclerosis spinal cord: A case report. Multiple Sclerosis Journal 22, 1485–1489 (2016).
- Smith, S. M. Fast robust automated brain extraction. Human Brain Mapping 17, 143–155 (2002).
- Jenkinson, M., Beckmann, C. F., Behrens, T. E. J., Woolrich, M. W. & Smith, S. M. FSL. NeuroImage 62, 782–790 (2012).
- Mori, S., Wakana, S., Zijl, P. C. M. van & Nagae-Poetscher, L. M. MRI Atlas of Human White Matter. (Elsevier, 2005).
- Zhang, Y., Brady, M. & Smith, S. Segmentation of brain MR images through a hidden Markov random field model and the expectation-maximization algorithm. IEEE Transactions on Medical Imaging 20, 45–57 (2001).
- Ercan, E. et al. Microstructural correlates of 3D steady-state inhomogeneous magnetization transfer (ihMT) in the human brain white matter assessed by myelin water imaging and diffusion tensor imaging. Magnetic Resonance in Medicine 80, 2402-2414 (2018).
- Mchinda, S. et al. Whole brain inhomogeneous magnetization transfer (ihMT) imaging: Sensitivity enhancement within a steady-state gradient echo sequence. Magnetic Resonance in Medicine 79, 2607–2619 (2018).
Figures
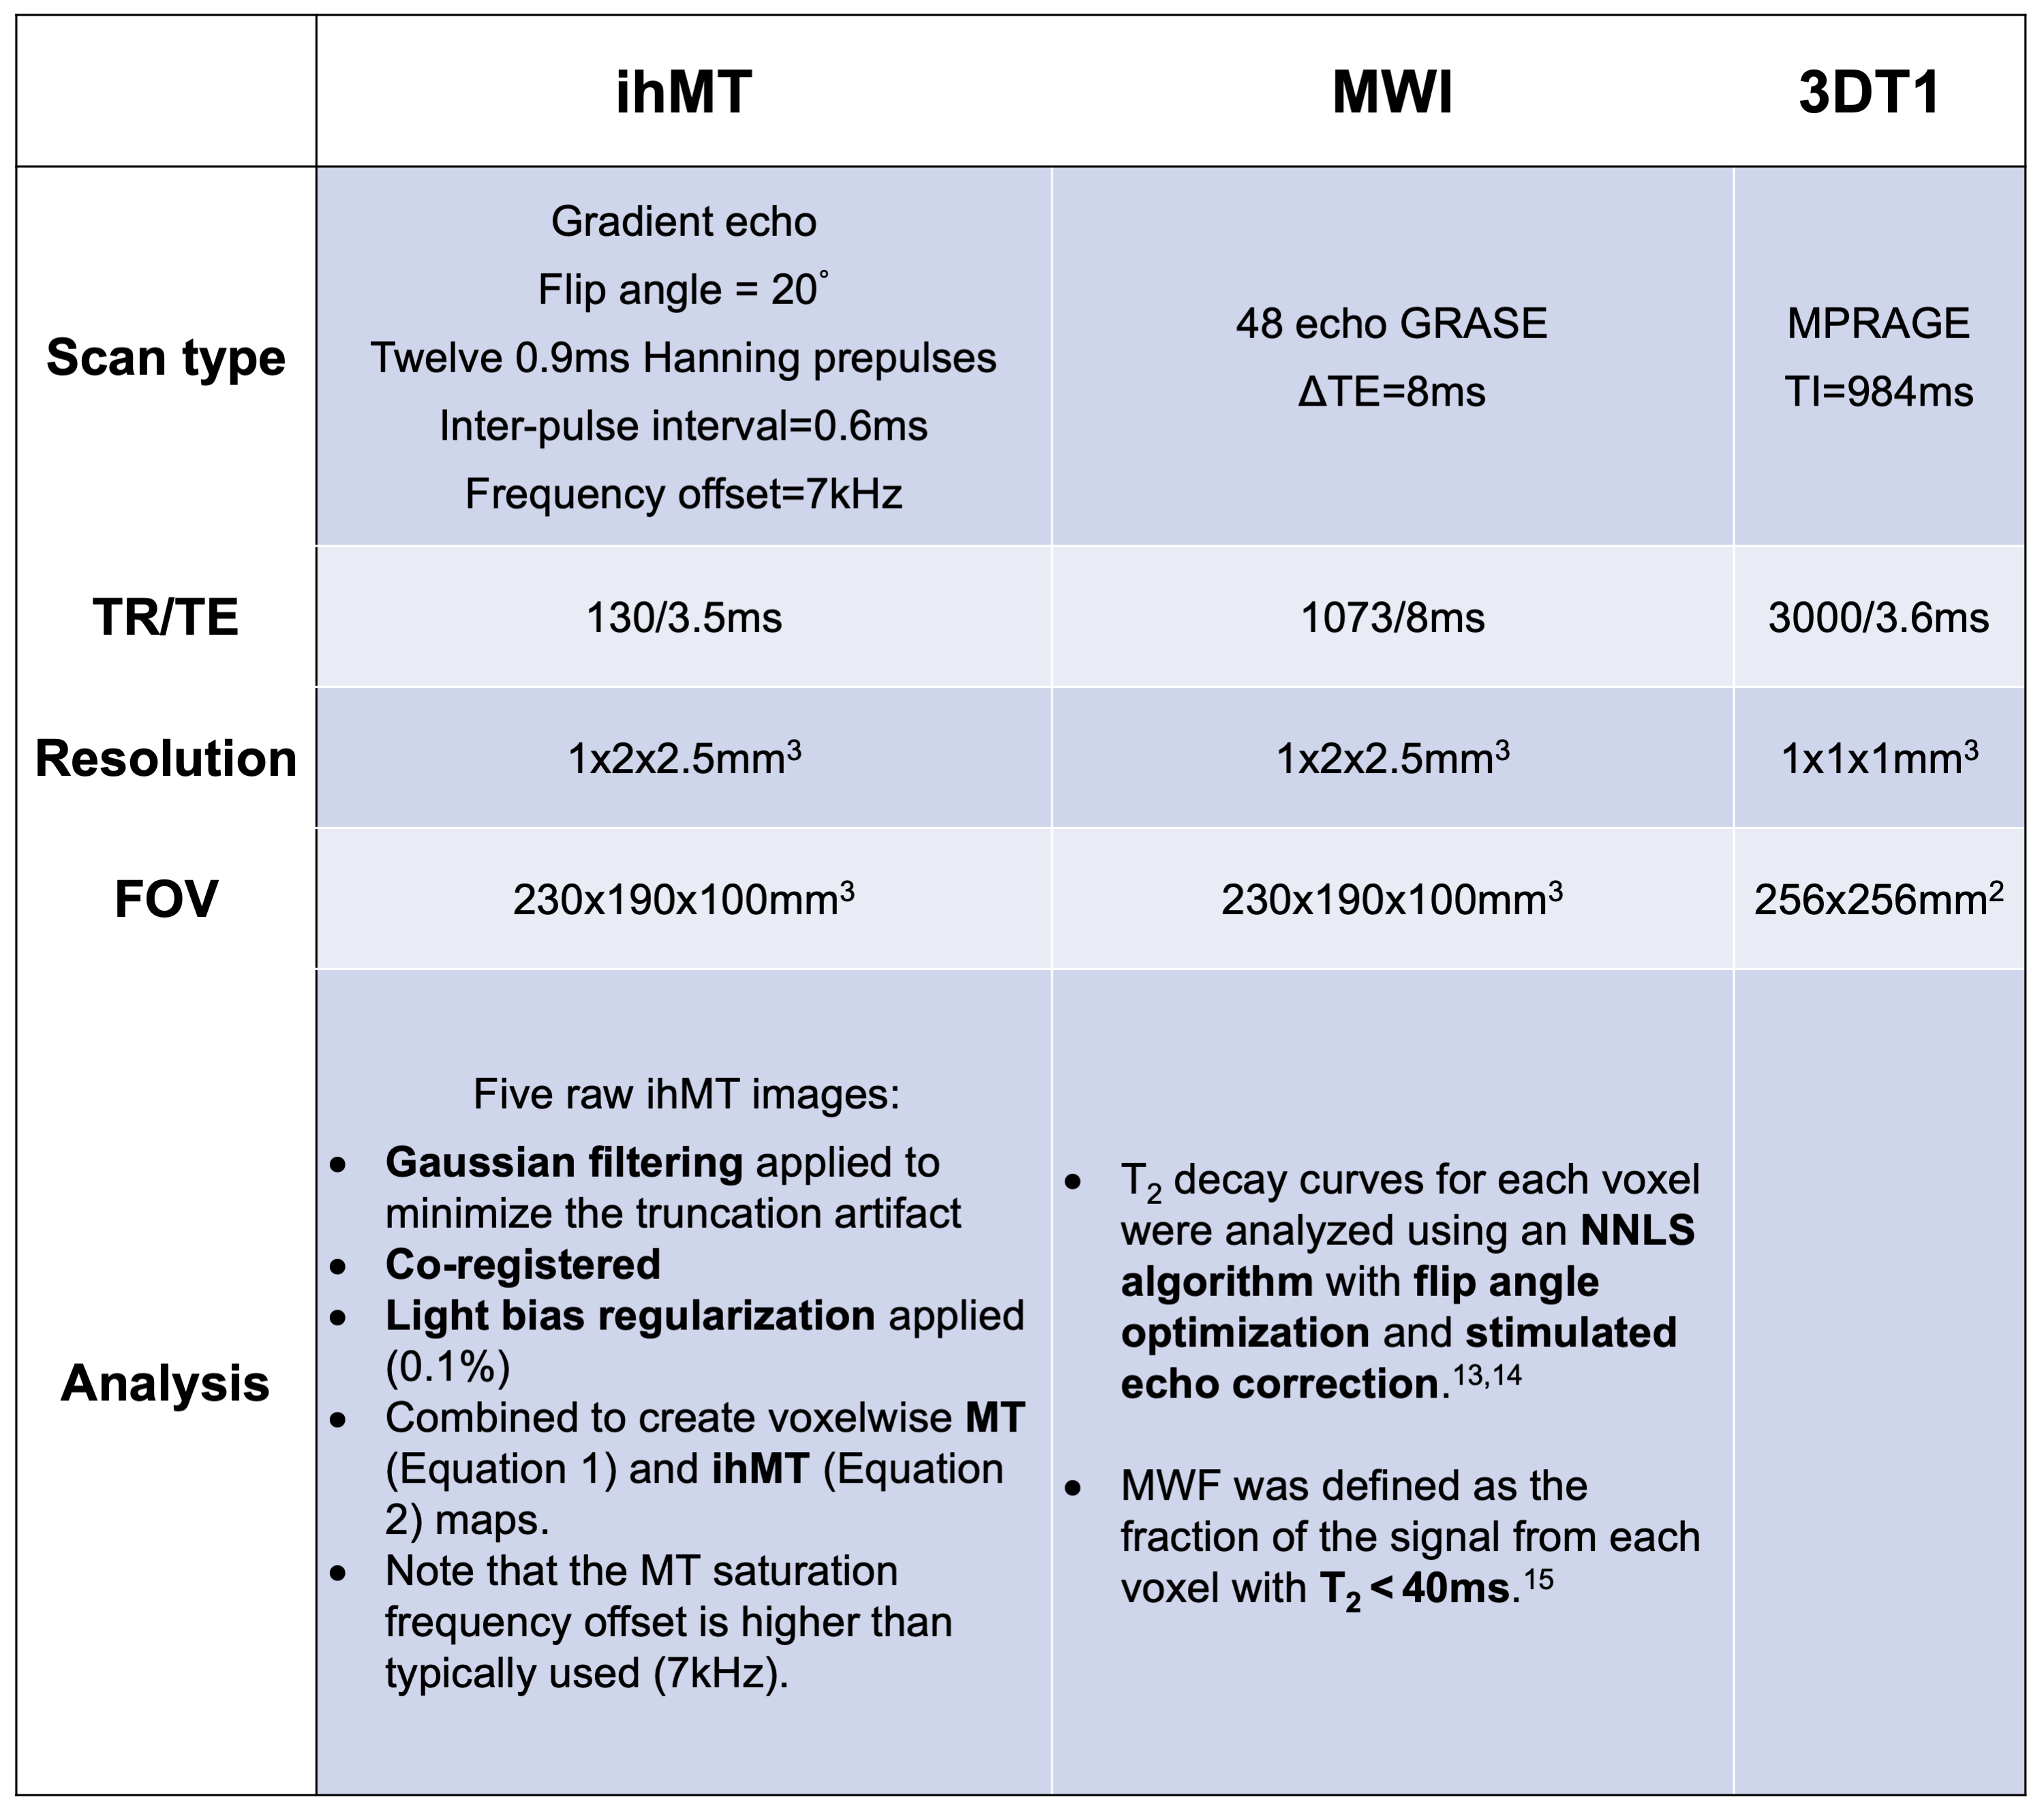
Figure 1: Scan parameters and analysis procedures for the three scans performed in this study.
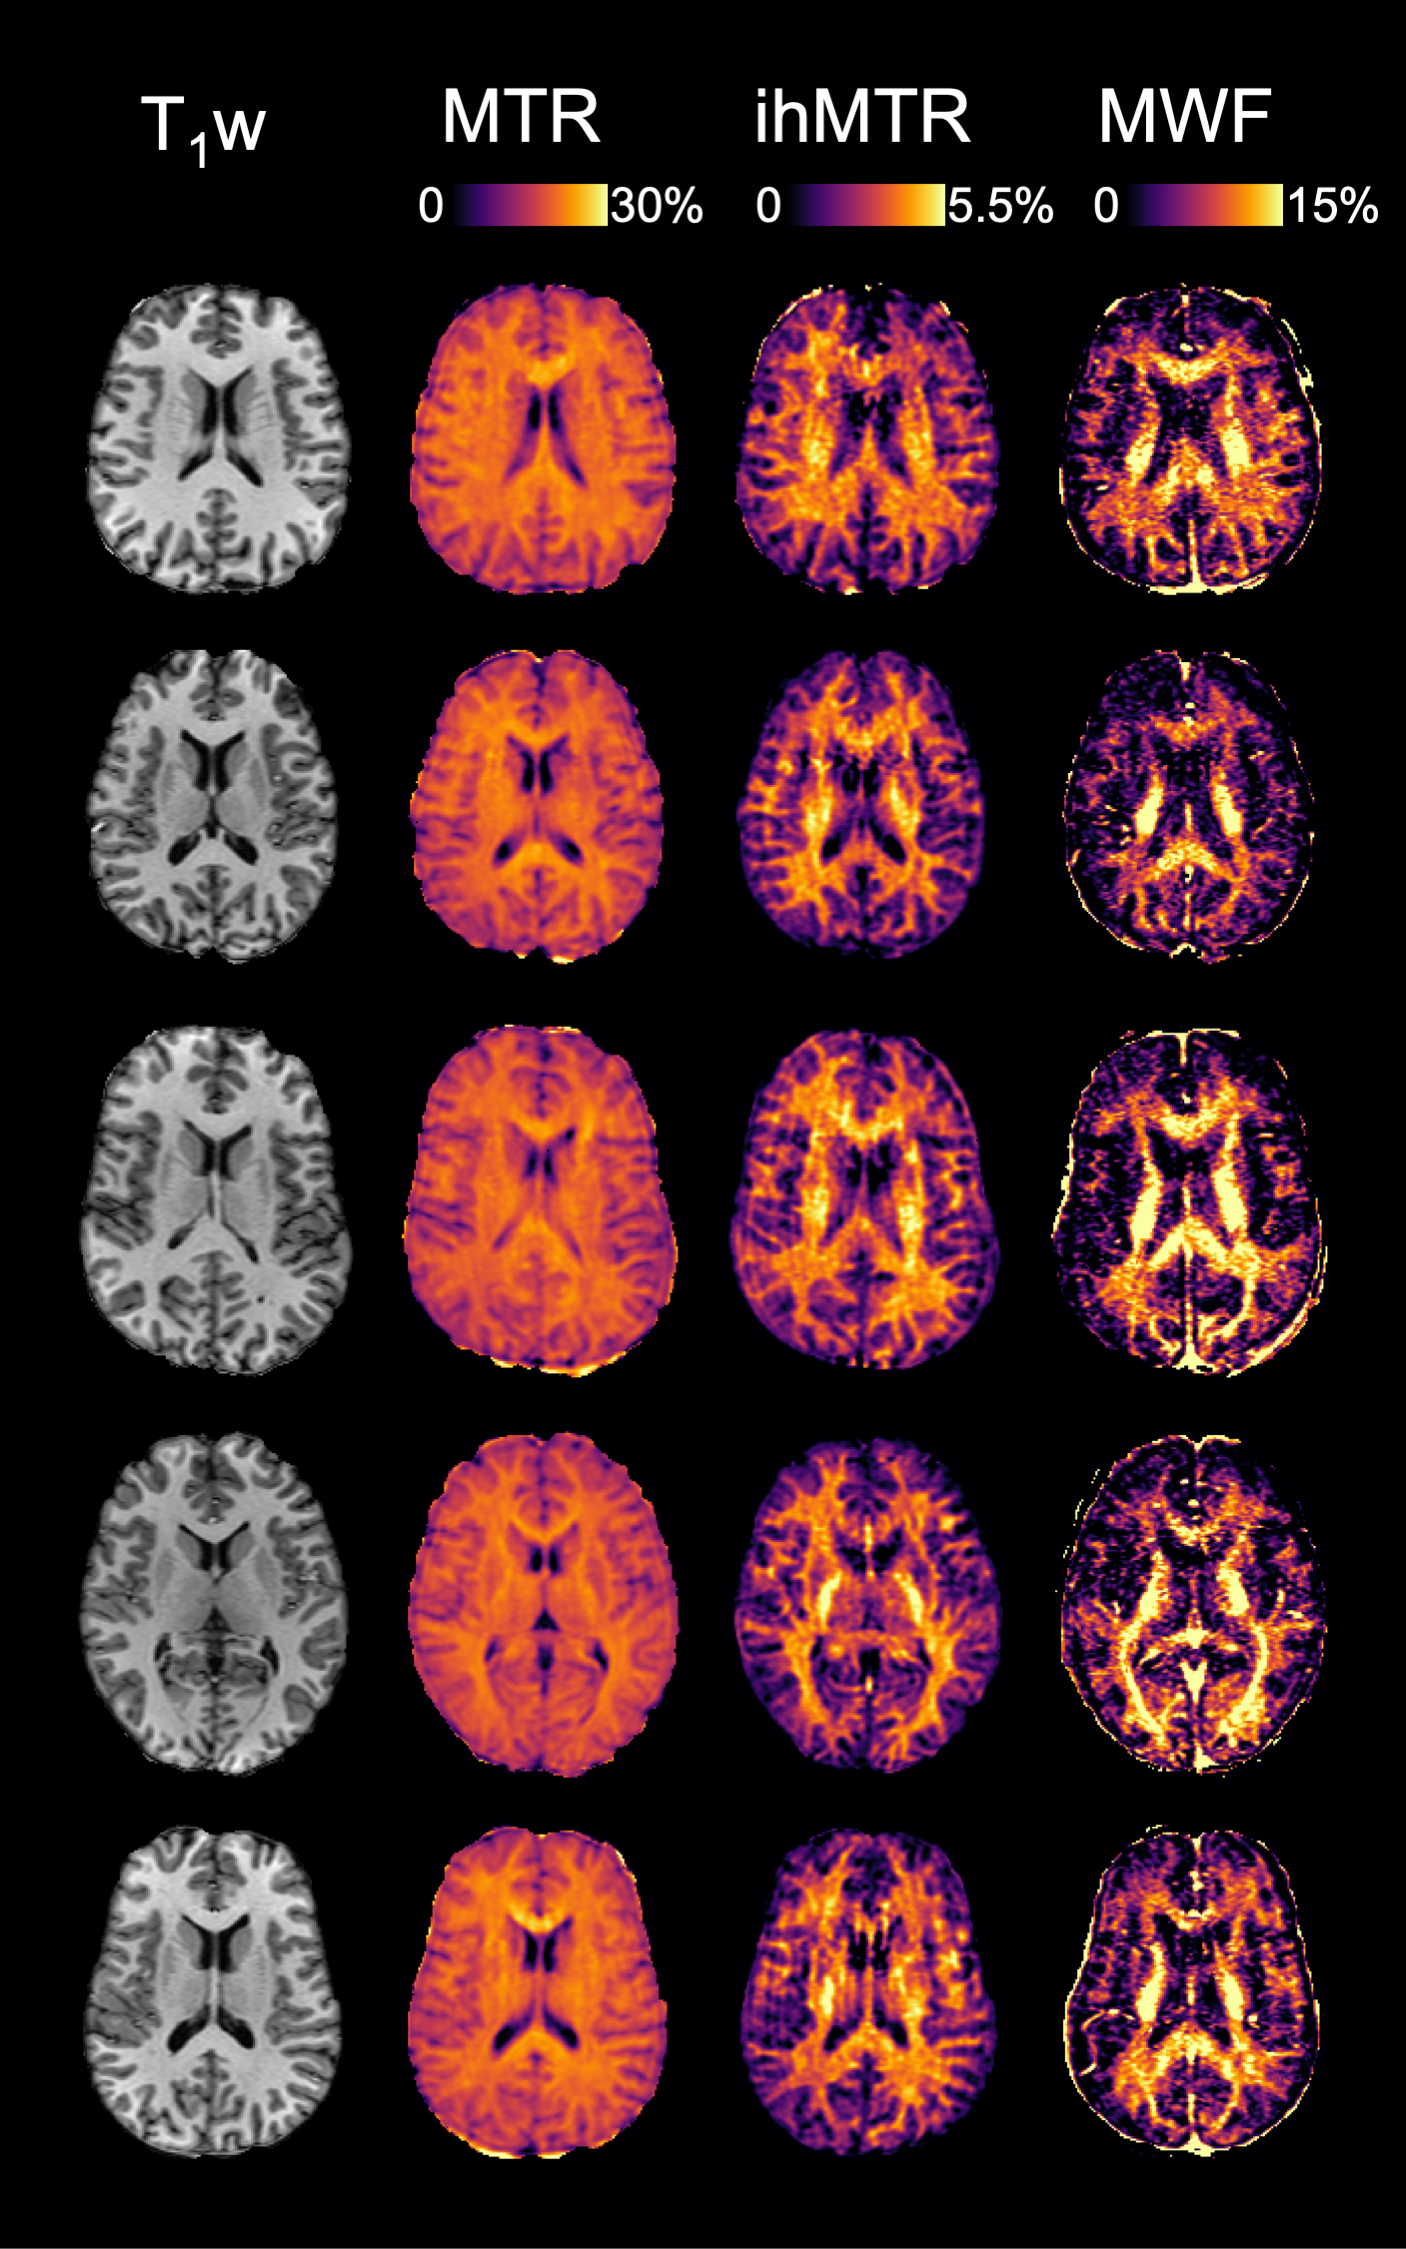
Figure 2: Example magnetization transfer ratio (MTR), inhomogeneous MTR (ihMTR) and myelin water fraction (MWF) maps from five of the participants. ihMTR and MWF show more variation in white matter than MTR.
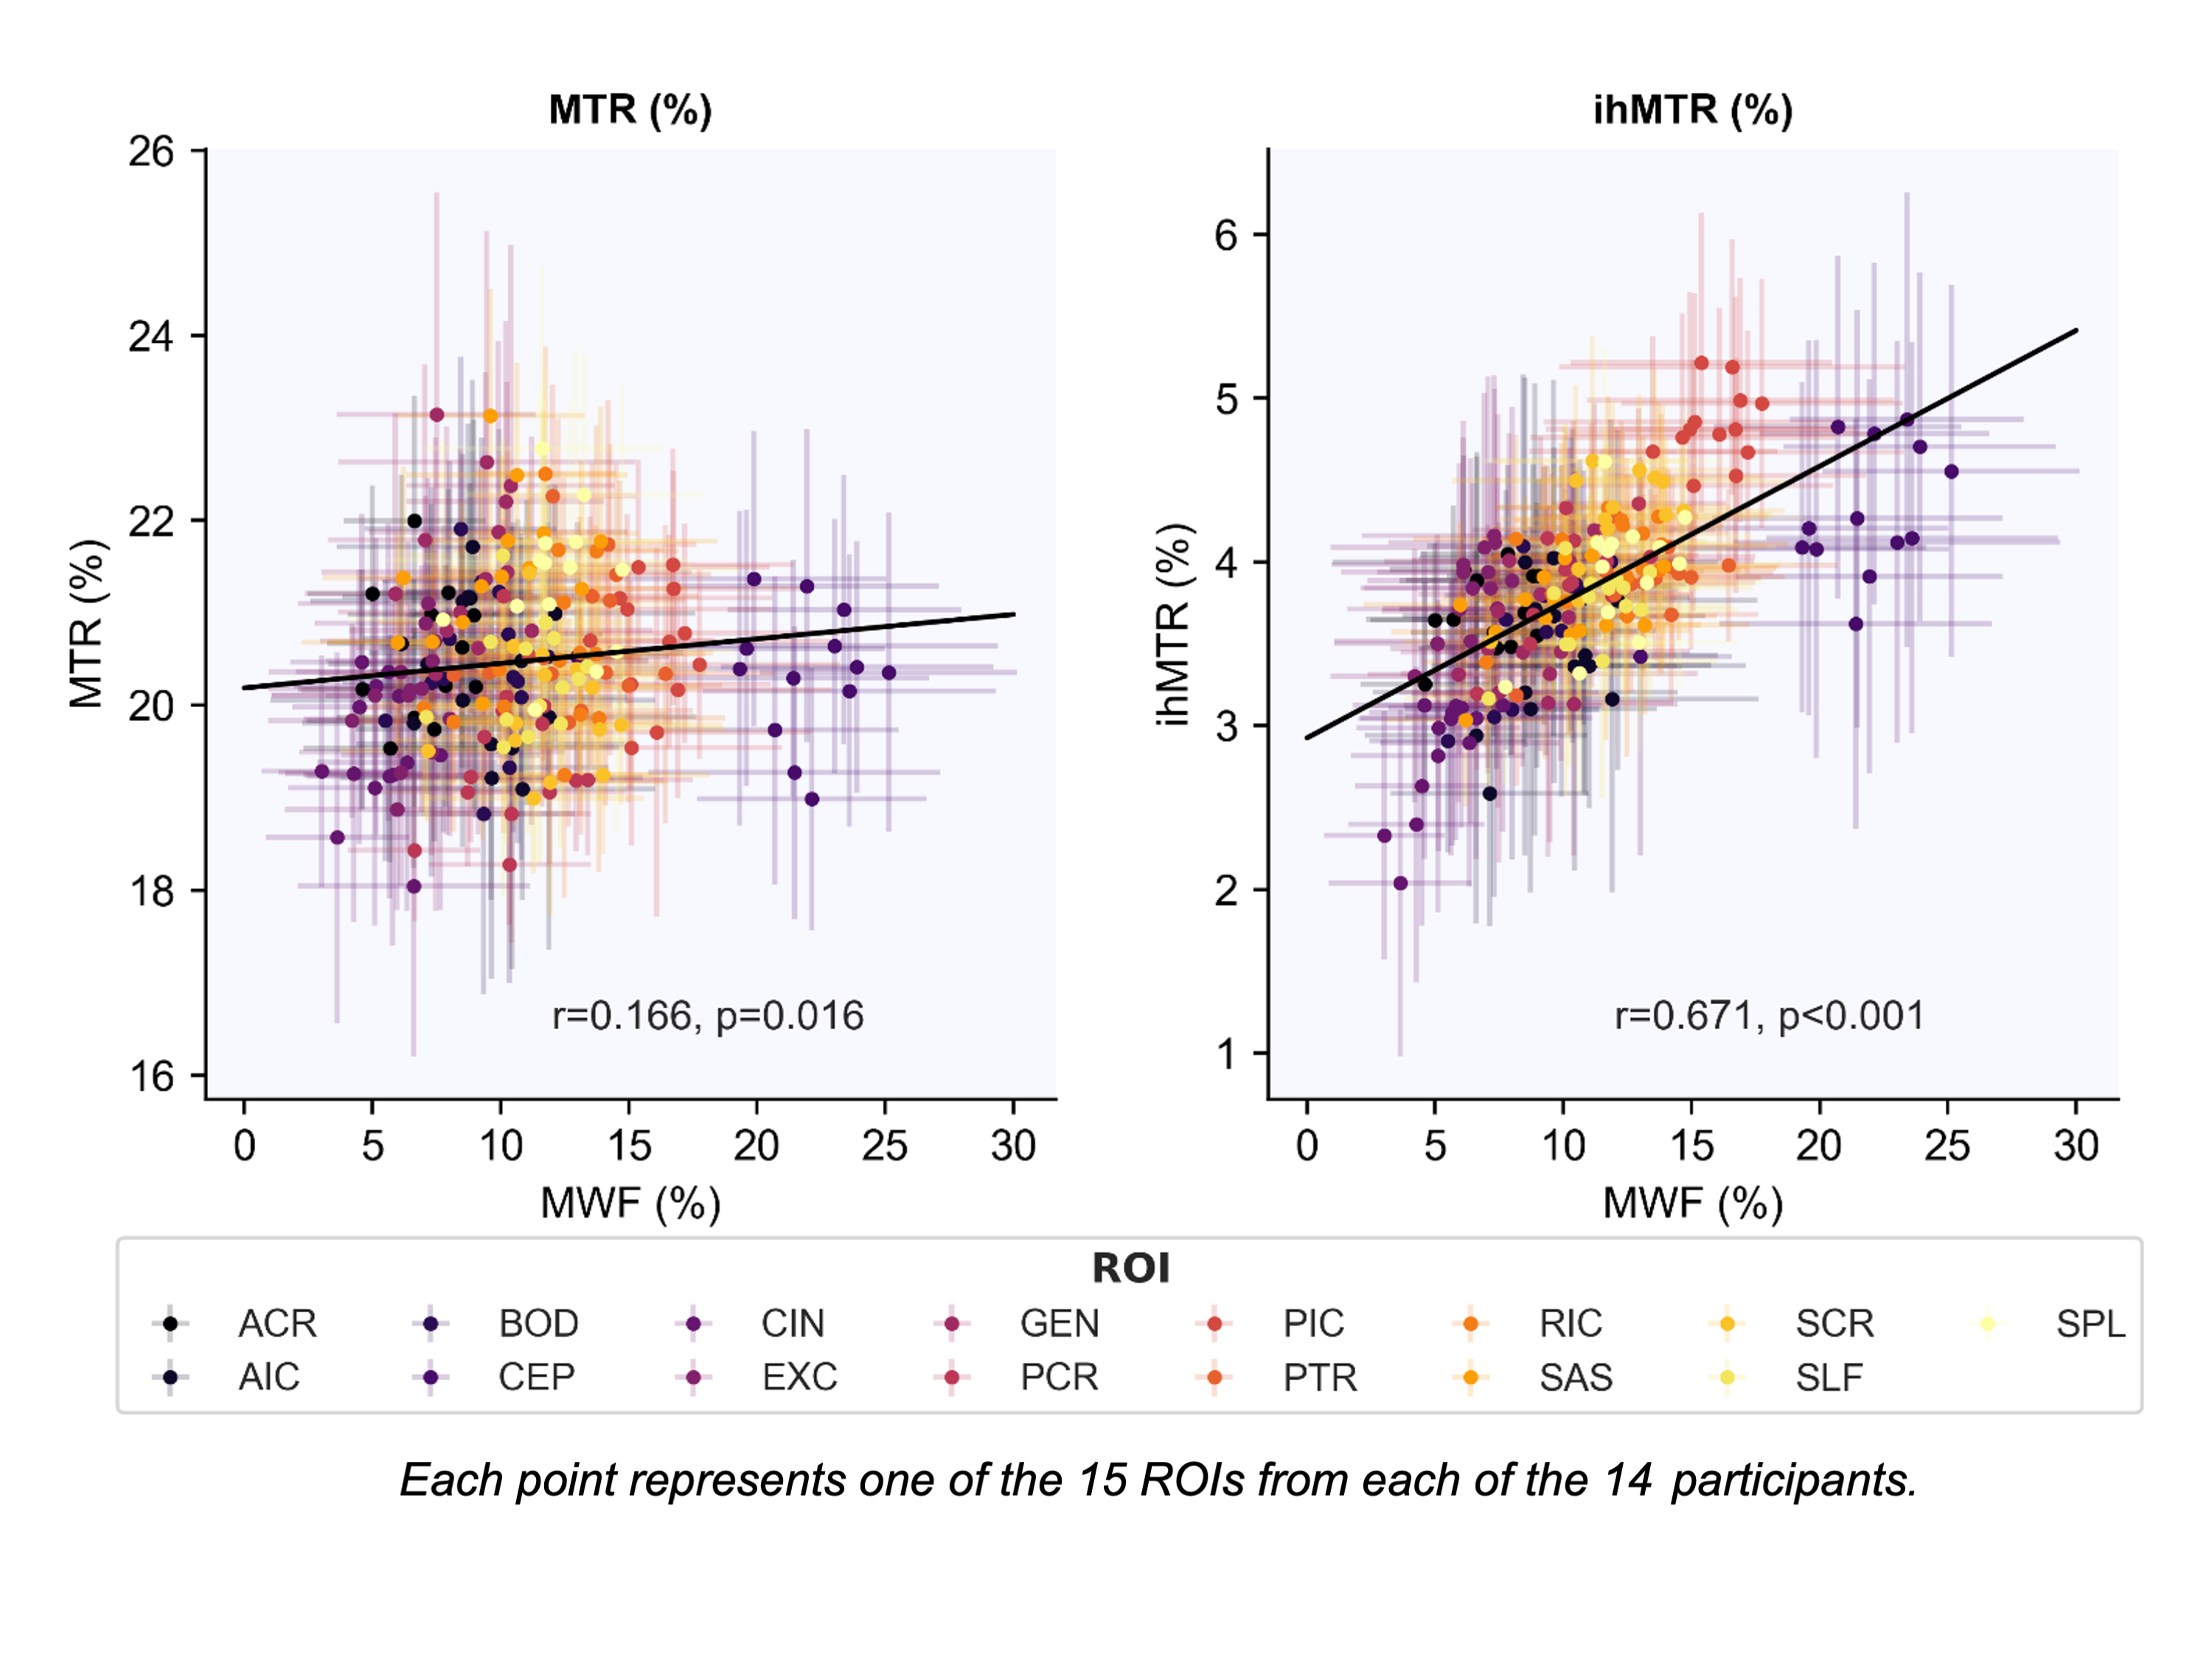
Figure 3: Pearson correlations between MTR and MWF and ihMTR and MWF. (ACR=Anterior corona radiata, AIC=Anterior limb of internal capsule, BOD=Body of corpus callosum, CEP=Cerebral peduncle, CIN=Cingulum, EXC=External capsule, GEN=Genu, PCR=Posterior corona radiata, PIC=Posterior limb of internal capsule, PTR=Posterior thalamic radiation, RIC=Retrolenticular part of internal capsule, SAS=Sagittal stratum, SCR=Superior corona radiata, SLF=Superior longitudinal fasciculus, SPL=Splenium)
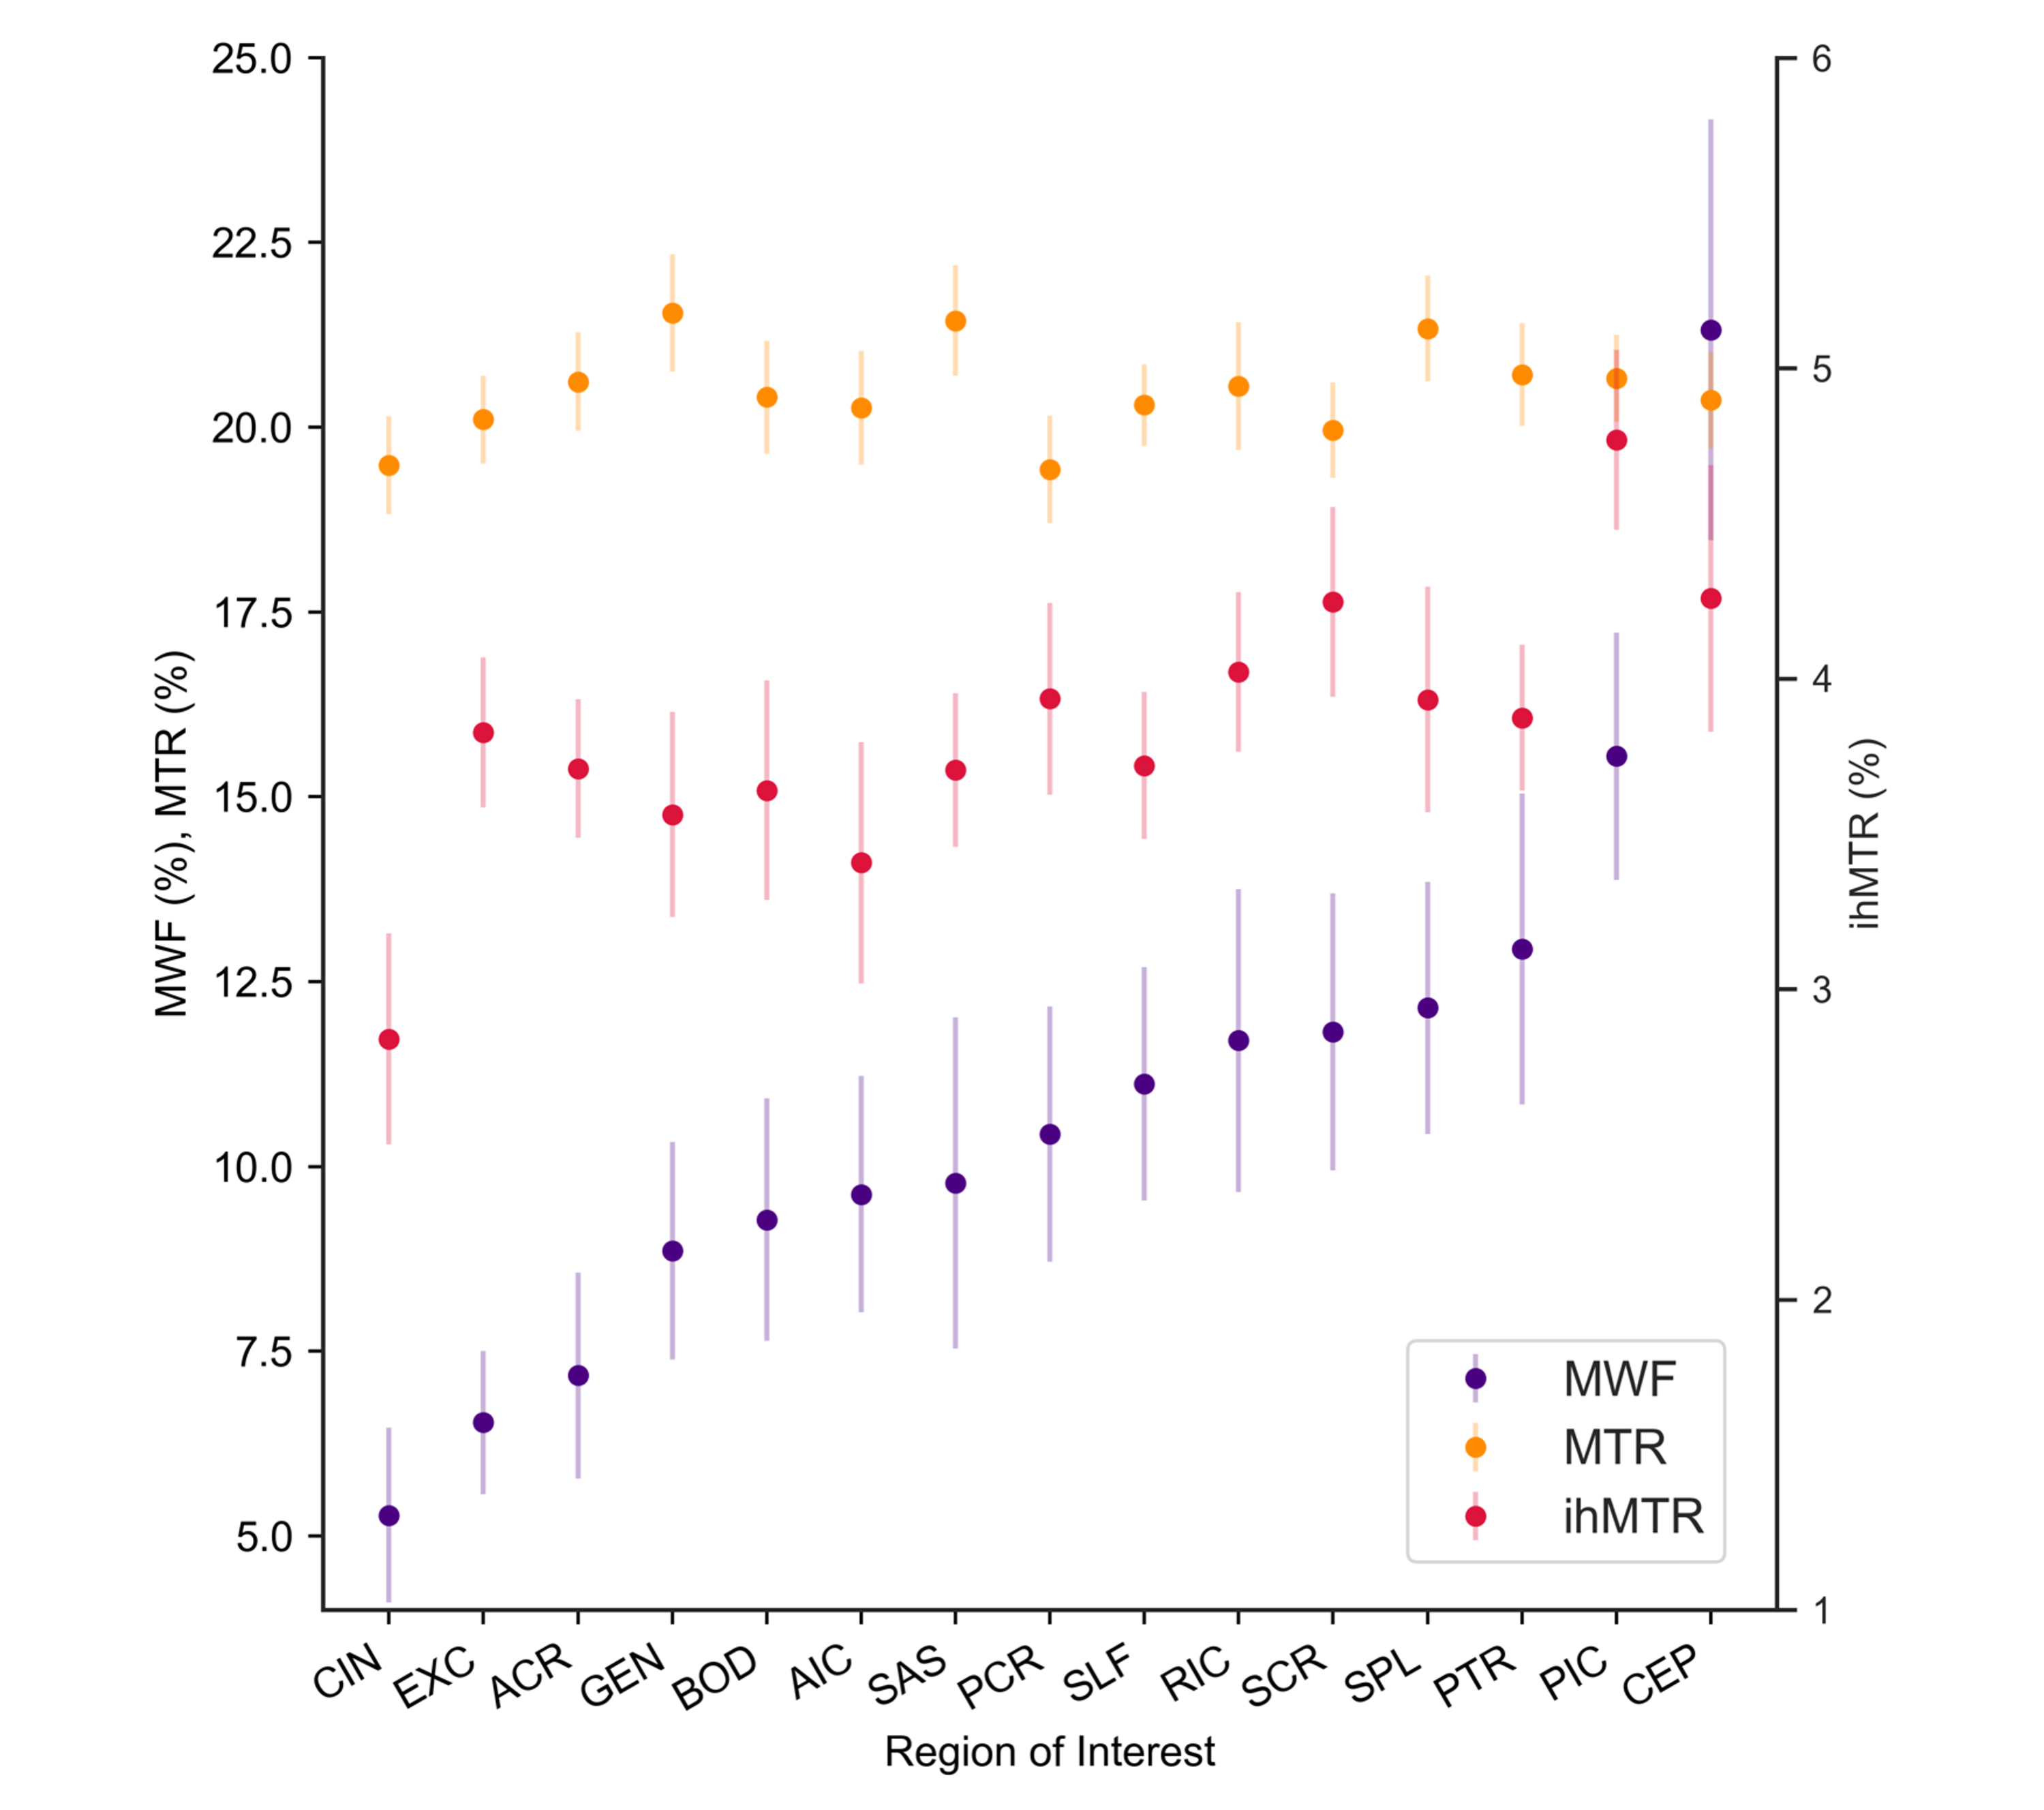
Figure 4: Comparison of the ranking of different white matter ROIs by MWF, MTR and ihMTR. Each point represents the mean for each ROI over all 14 participants with error bars giving the standard deviation.
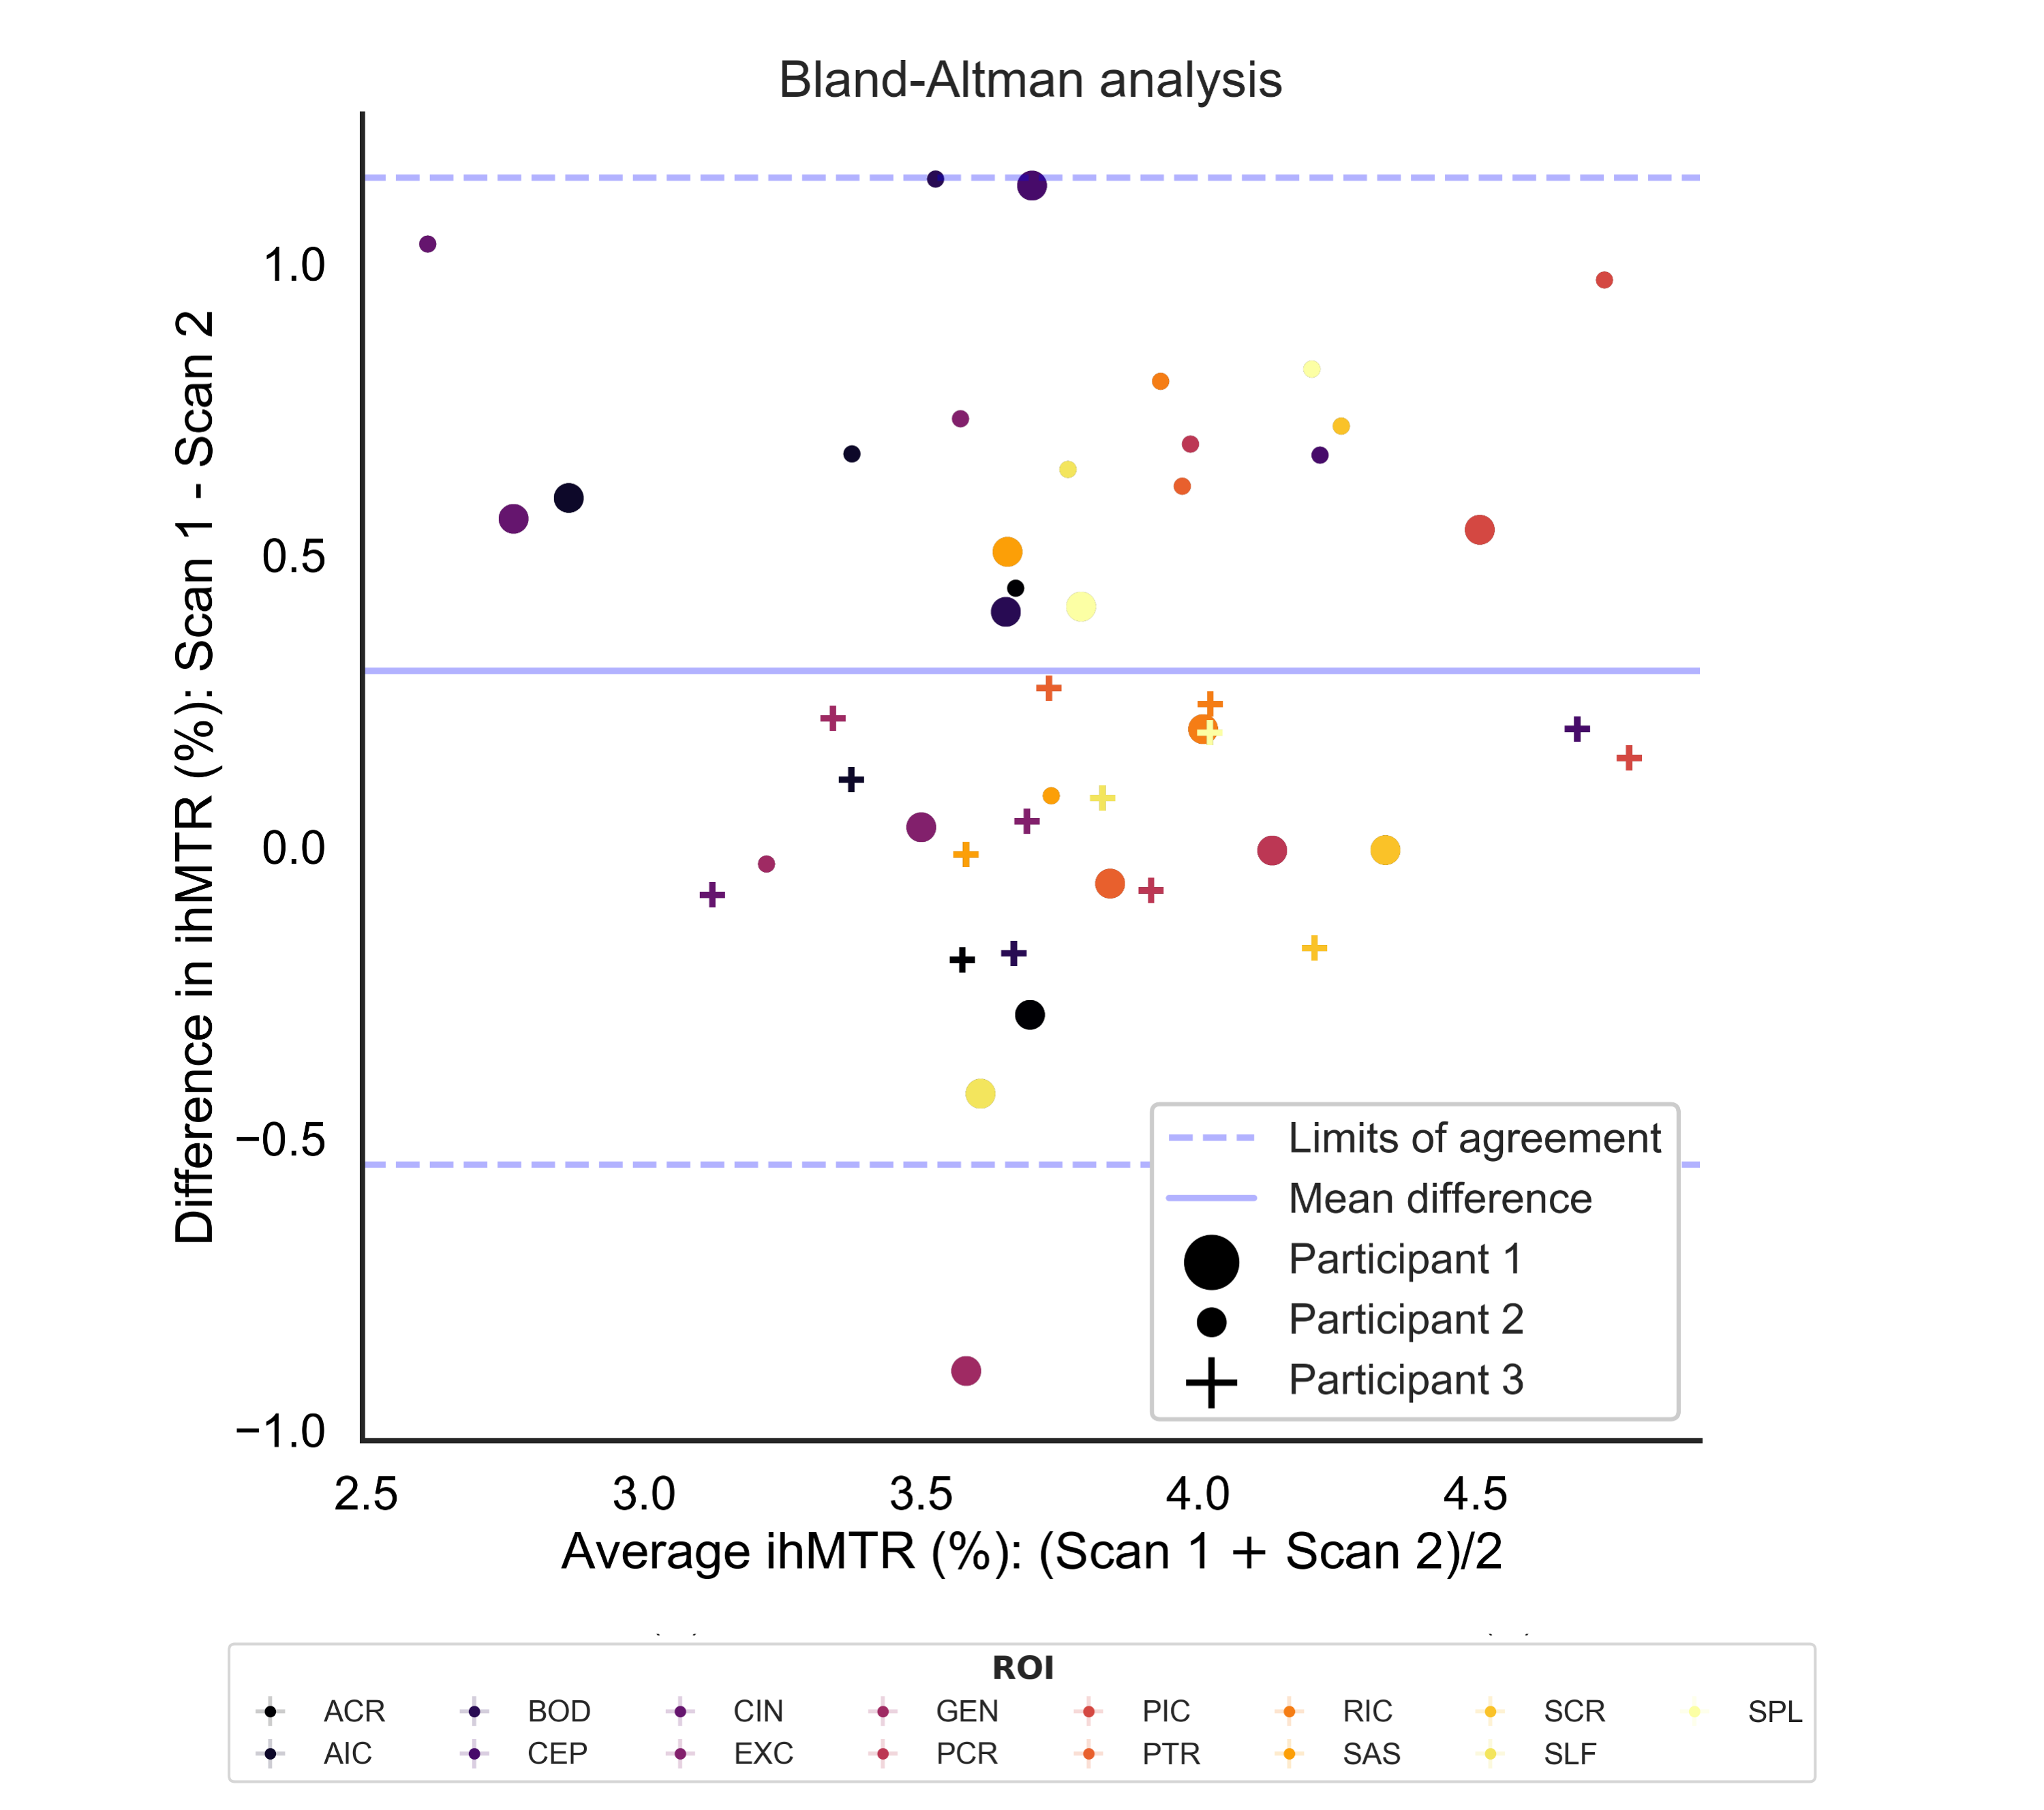
Figure 5: Bland-Altman graph analysing the reproducibility of ihMTR in three participants scanned twice a few weeks apart.