0715
Dynamic GlucoCEST MRI: results in primary brain tumors at 3 Tesla1RADIOLOGY, HOSPITAL SÍRIO-LIBANÊS, SAO PAULO, Brazil, 2Radiology, Hospital Sírio-Libanês, Sao Paulo, Brazil, 3General Eletric, Sao Paulo, Brazil, 4General Eletric, Tokyo, Japan, 5RADIOLOGIA, HOSPITAL SÍRIO-LIBANÊS, SAO PAULO, Brazil, 6Oncology, Hospital Sírio-Libanês, Sao Paulo, Brazil
Synopsis
This study shows the glucoCEST effect in 15 patients with primary malignant brain tumors compared with normal white matter(NWM) at 3-Tesla-MRI. The procedure included a full Z-spectra CEST and a dynamic glucoCEST. The signal % at 2 ppm calculated using mean asymmetric magnetization transfer ratio values were significantly higher in the whole cancer compared to NWM. Similarly, the dynamic glucoCEST presented as mean area-under-the-curve values were significantly different in whole cancer in comparison to normal tissue. This method, using clinical field strength of 3Tesla, was capable of identifying distinct patterns of glucose metabolismand also heterogeneity in the cancer metabolism
INTRODUCTION
Glucose weighted chemical exchange saturation transfer (glucoCEST) MRI is one technique to assess glucose uptake by the continuous transfer of excited hydrogen protons, leading to proportional increase of saturation in water. There is limited available data using this technique in clinical field strength of 3Tesla (3T). This study aims to develop and assess glucoCEST effect in primary malignant brain tumors compared with normal tissue at 3T.METHODS
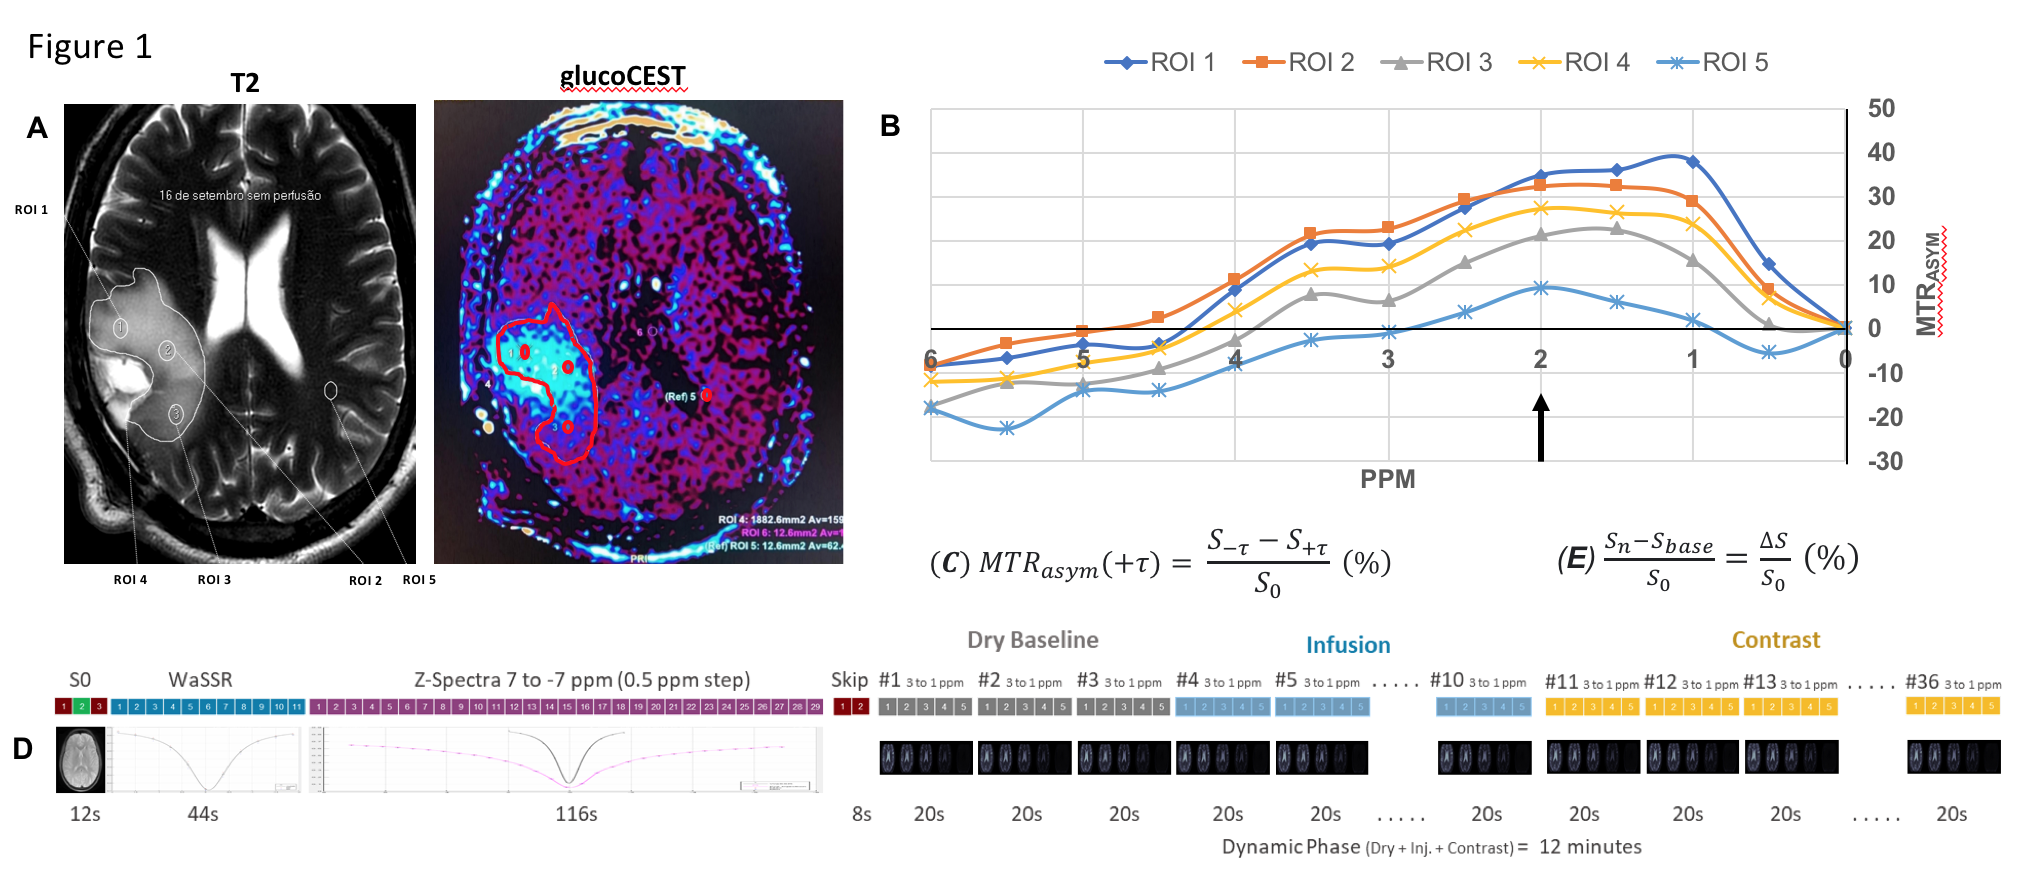
Conventional MRI images and a single glucoCEST procedure at 3T (Discovery MR 750, GE Healthcare, Milwaukee, USA) were performed sequentially in 15 patients with primary brain tumors. An independent neuroradiologist reviewed the images and selected a single 10mm slice with best cancer visibility. Using conventional perfusion and diffusion functional images, the neuroradiologist outlined 5 regions of interest (ROI) to be use as reference ROIs in the glucoCEST processing. Four ROIs were identified on the cancer following the same rule: elliptical ROI 1 on the higher perfusion area, elliptical ROI 2 on the central cancer area, elliptical ROI 3 on the periphery of the cancer and freehand ROI 4 encompassed all the tumor. Elliptical ROI 5 was identified on the contralateral normal white matter. ROI 1,2,3 and 5 had identical shapes and areas. The glucoCEST procedure used a specific CEST pulse sequence database (PSD) tested in prior phantom studies (consisted of a 2-second saturation pulse followed by a SSFSE and B1=2µT). This procedure started with a reference image map without saturation to determine S0. Then a full Z-spectra CEST procedure (steps of 0.5 ppm, ranging from +7 to -7 ppm with respect to water proton frequency) was performed followed by a dynamic glucoCEST procedure of 36 phases (steps of 0.5 ppm, ranging from +3 to -1 ppm for each phase). The DRY phase of dynamic glucoCEST procedure was done with the patient´s baseline blood glucose level. Next, the INFUSION phase was performed during the IV infusion of 30 g of glucose at a rate of 0.3 ml/s. The CONTRAST phase initiated when the contrast infusion was completed (Figure 1). The dynamic glucoCEST results were shown by means of area under the curve (AUC) for each ROI. Statistical comparison significance was defined for p-value <0.05.RESULTS
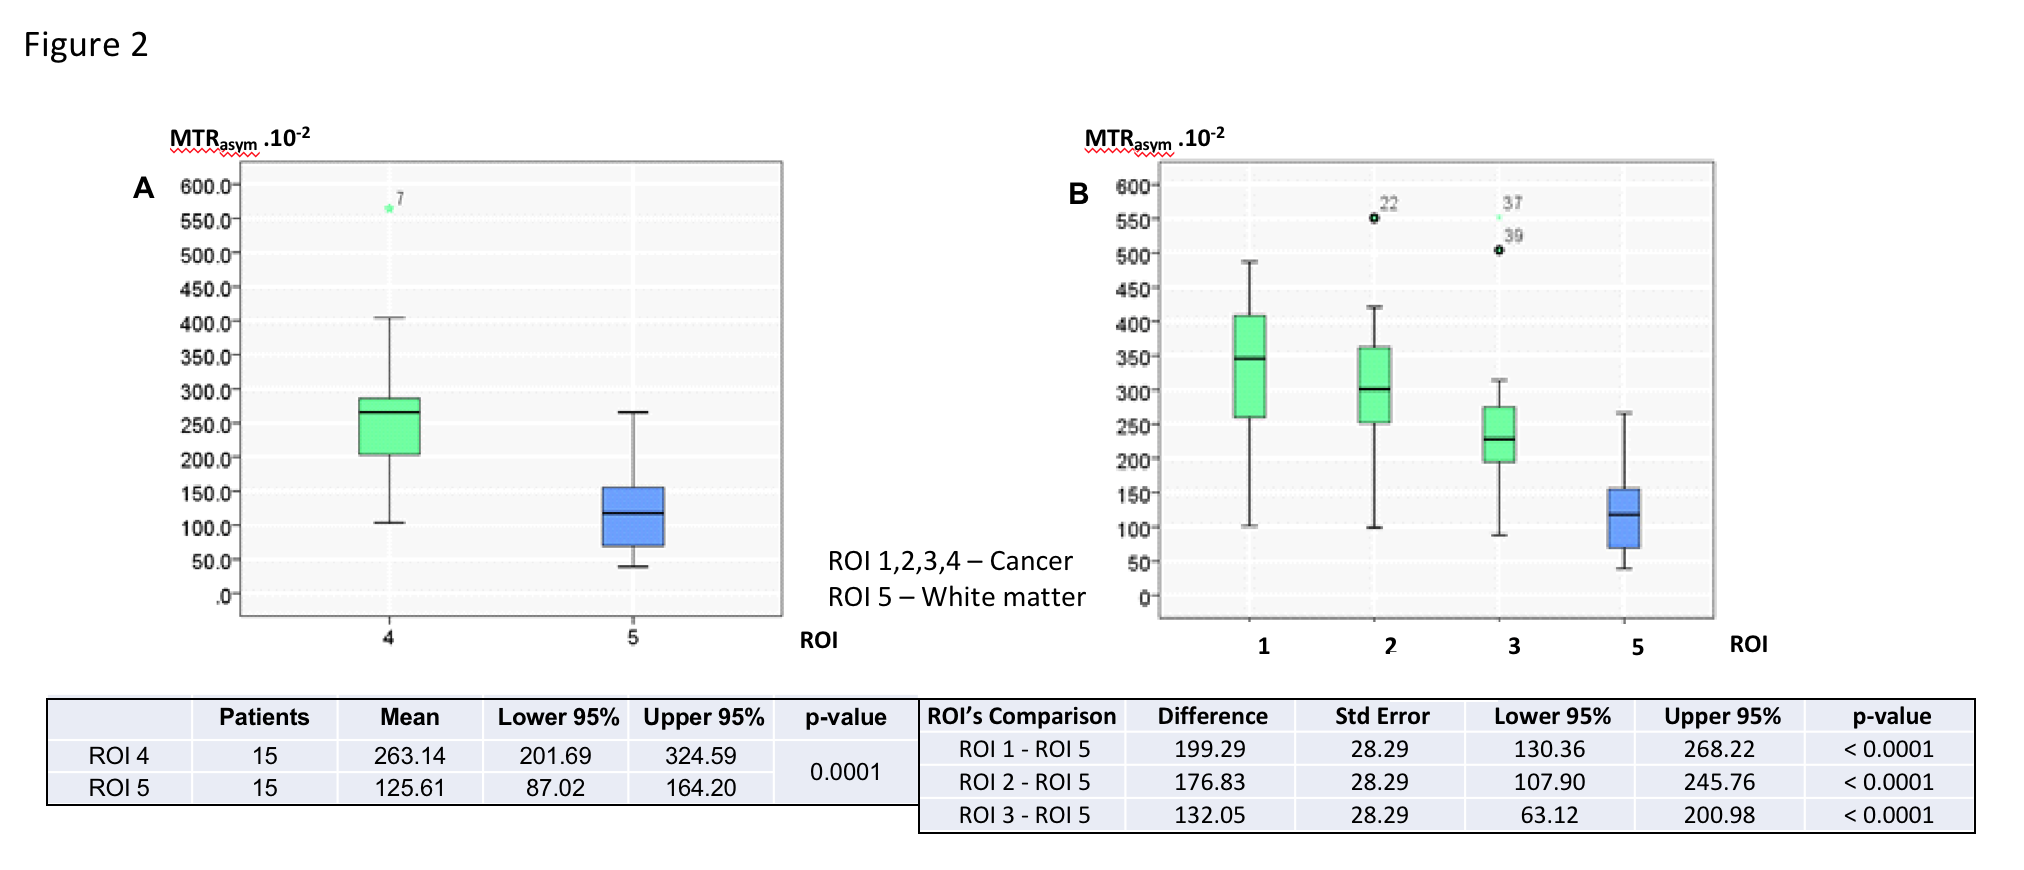
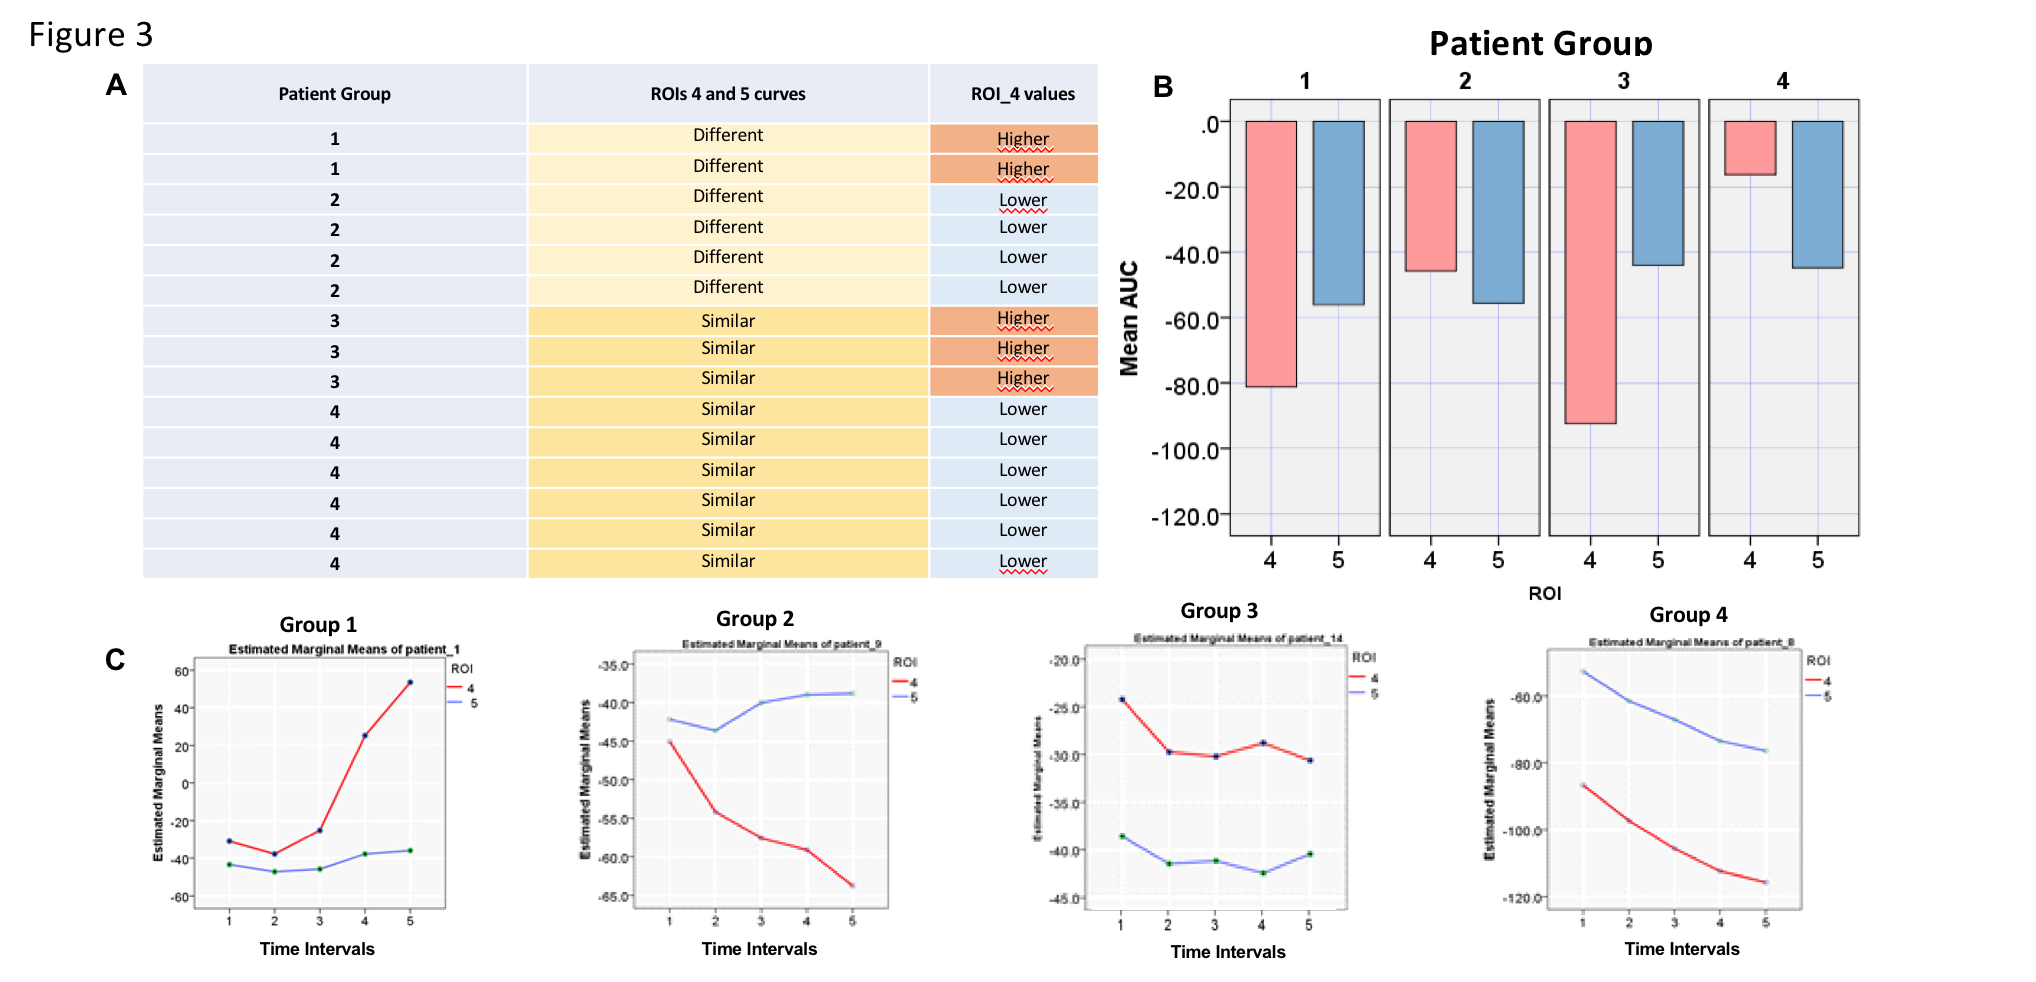
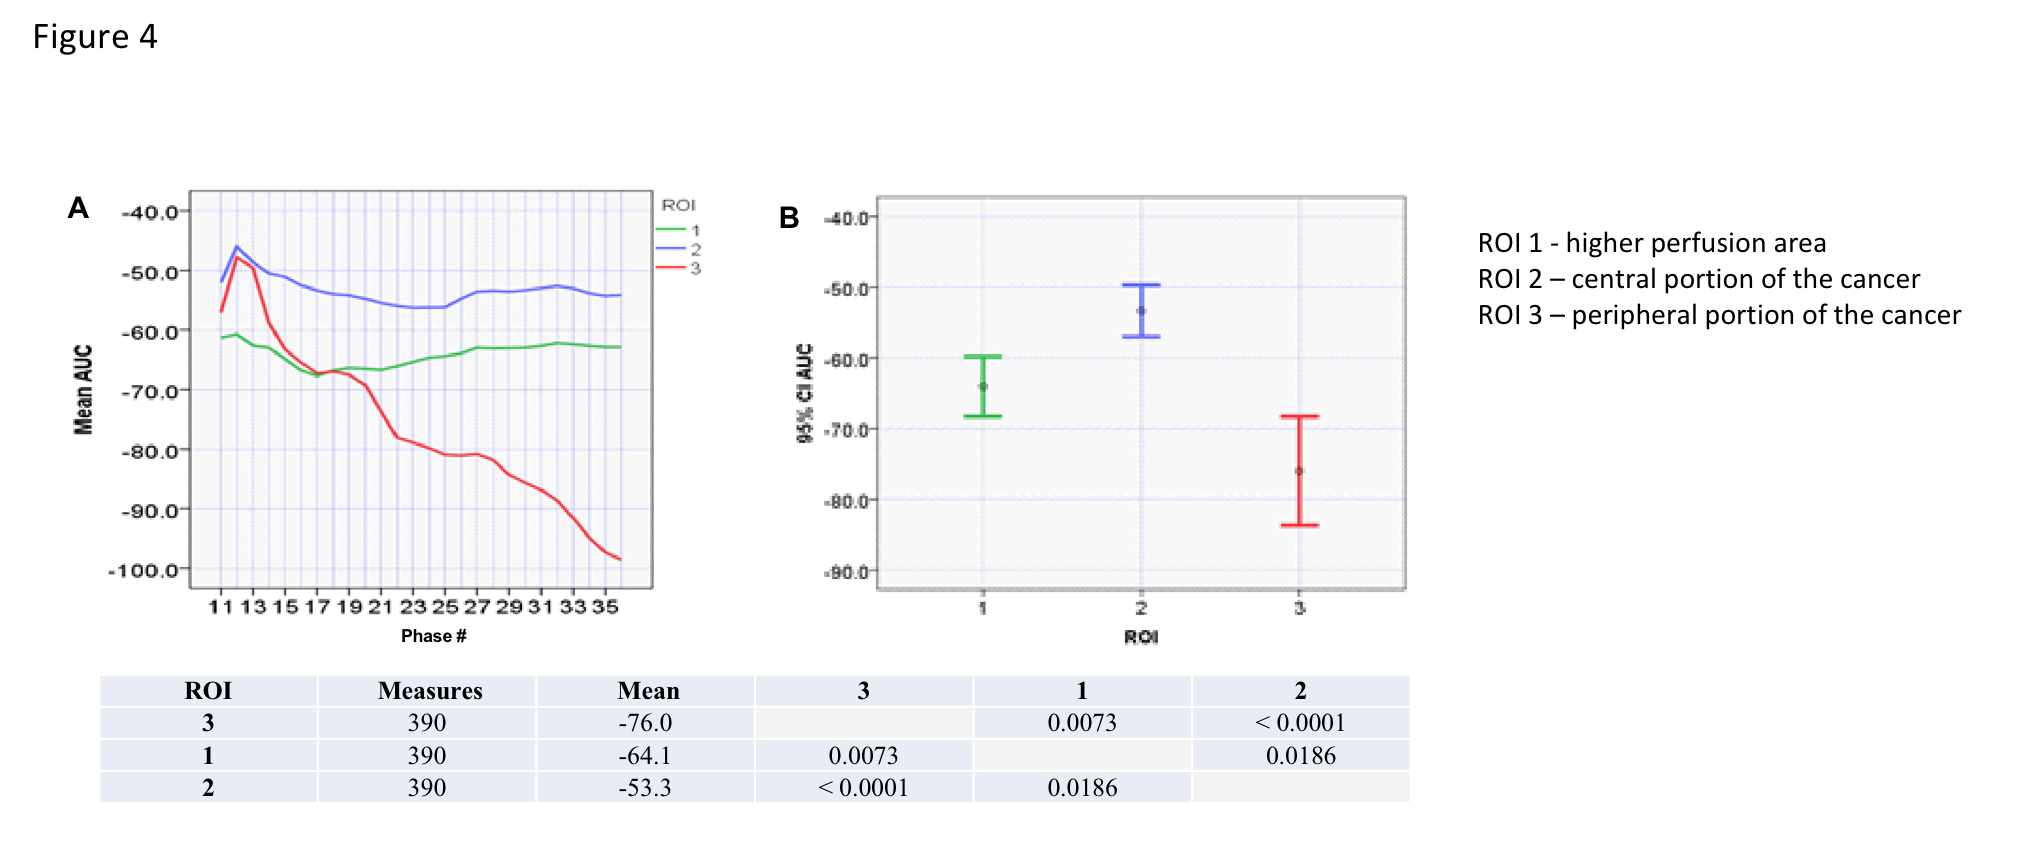
Mean MTRasym values were significantly higher in the whole cancer (ROI 4) compared to normal white matter (ROI 5) (p < 0.0001). The differences in mean MTRasym values between ROI 1 to 3 and ROI 5 were also significant (Figure 2)(p < 0.0001). However, mean MTRasym values were not able to demonstrate significant differences in glucose metabolism between ROI 1 to 3. Similarly,the dynamic glucoCEST mean AUC values were significantly different in ROI 4 in comparison to ROI 5 in almost all measurements as a function of time (p < 0.0001). We observed distinct patterns of glucose metabolismwhich have significant different values for ROI 4 and ROI 5(Figure 3). Moreover, there were significant differences in ROI 1 and ROI 3 suggesting heterogeneity in cancer metabolism (Figure 4).DISCUSSION
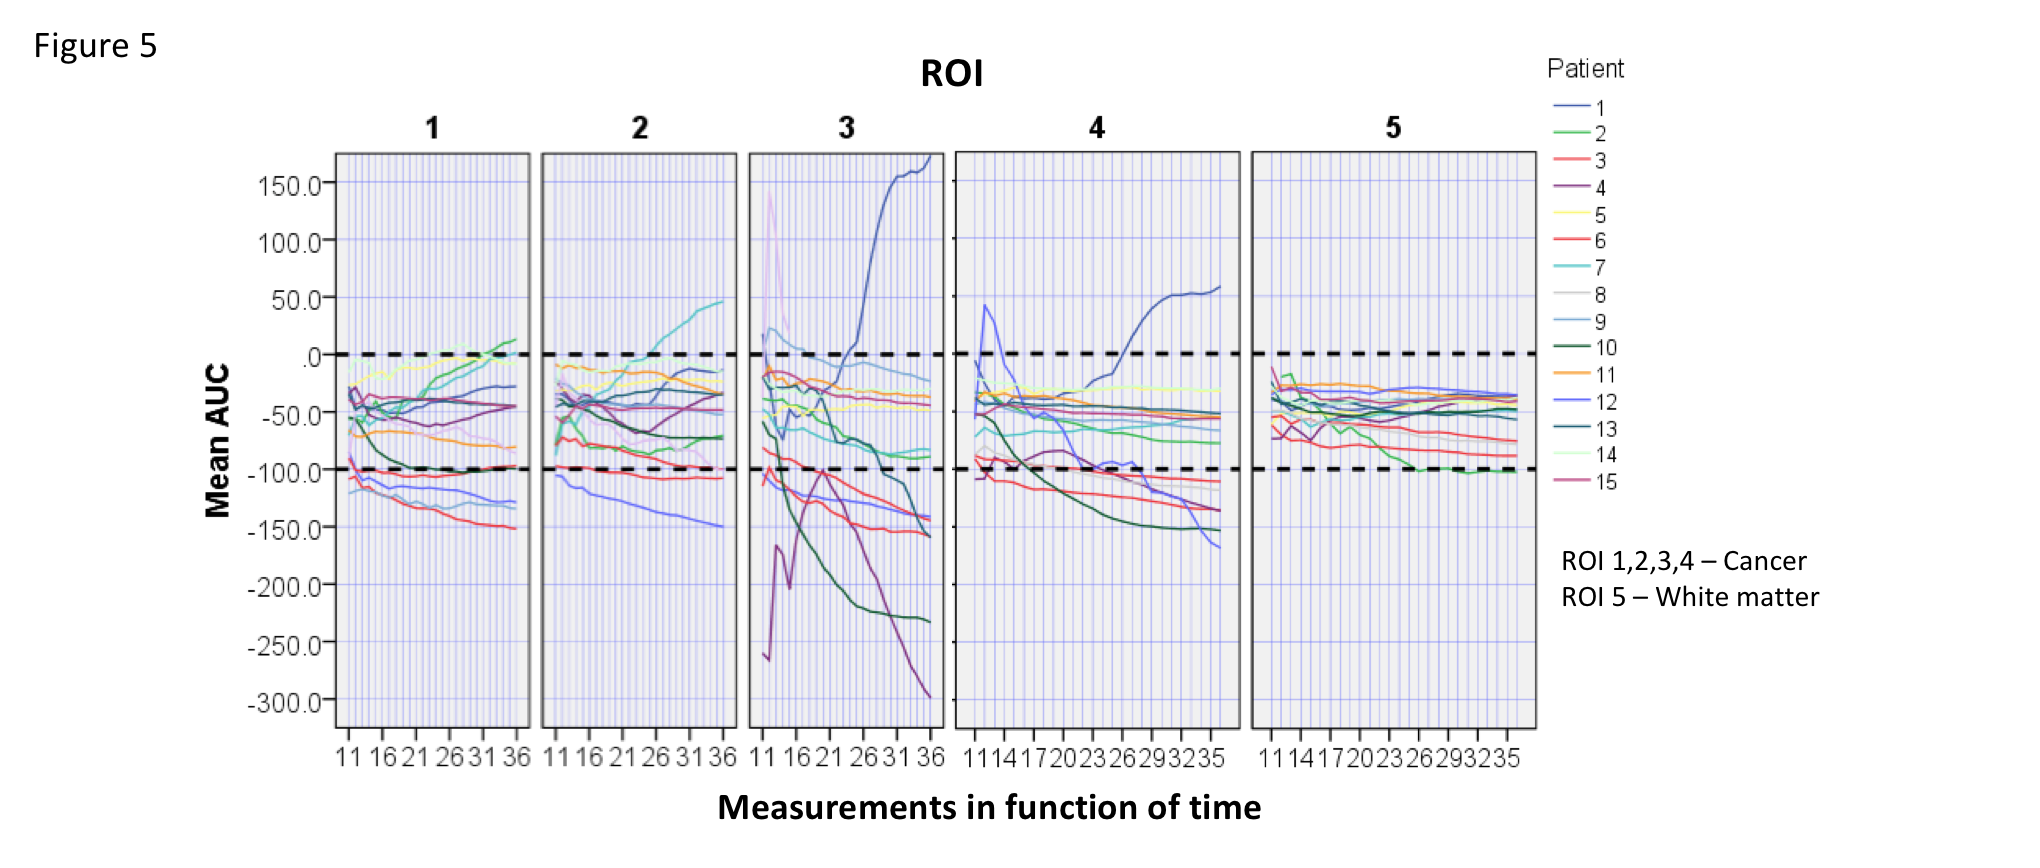
There is still debate about the feasibility of glucoCEST in clinical field strength of 3T because of the proximity of 2ppm signals and water saturation signals. This drawback of lower fields is attributed to a broader distribution in ppm units and the faster exchange regime with the surrounding water signal (coalescence phenomenon). The post processing algorithm addressed and corrected deviations due to patients´ head motion and B0 shift, two confounders of glucoCEST effect. Our results showed a mean MTRasymvalue of 2,65% at 2ppm. However, glucose signals detection is not limited by the proximity of the 2ppm signal to water saturation at 3T in this study. In fact, thedynamic glucoCEST mean AUC values were different between ROIs 1,2,3,4 and ROI 5 as a function of time (p<0.0001). The mean AUC values clustered patients into 4 different metabolic patterns (Figure 3). This may reflect individual variations of the cancer metabolism after the glucose injection. Additionally, variation in detected glucose signals present in ROI 5 were significantly lower than observed in the cancer (Figure 5). This finding demonstrates the robustness of this method to measure glucose signals in normal and cancer tissues using dynamic glucoCEST. The dynamic glucoCEST mean AUC values are sensitive to differences in cancer glucose metabolism, especially in the periphery of the cancer (Figure 4). Differences in ROI 1 and ROI 3 may demonstrate that glucose metabolism is not directly associated with higher perfused areas as identified by conventional functional MRI. There is a significantly higher glucose consumption in the periphery of the cancer than showed in the central portion of the cancer. This may support previous findings in the literature of differences in metabolic rates in distinct regions of a cancer.CONCLUSION
The glucose signals measured by MTRasym and dynamic glucoCEST mean AUC valuesare significantly different in cancer and normal white matter in 3T. Future studies comparing glucoCEST to functional MR techniques such as DWI/DCE are needed. Current evidence has not objectively addressed the cancer physiopathology and the prognostic value of the patterns of cancer metabolism observed in this study. New experiments are being planned to address these questions.Acknowledgements
No acknowledgement found.References
Wu B et al. An overview of CEST MRI for non-MR physicists. EJNMMI Phys 2016; 3(1):19
Xu X et al. D-glucose weighted chemical exchange saturation transfer (glucoCEST)-based dynamic glucose enhanced (DGE) MRI at 3T: early experience in healthy volunteers and brain tumor patients. Magn Reson Med. 2019; 00:1–16
Kim M et al. Challenges in glucoCEST MR body imaging at 3 Tesla. Quant Imaging Med Surg. 2019; 9(10):1628–1640
Xu X et al. Dynamic Glucose-Enhanced (DGE) MRI: Translation to Human Scanning and First Results in Glioma Patients. Tomography. 2015; 1(2):105–114
Fadaka A et al. Biology of glucose metabolization in cancer cells. J Oncol Sci. 2015; 3(2):45-51
Figures