0712
Quantifying Placental Structure and Function in Healthy and Compromised Pregnancies with Combined T2*-diffusion1Centre for Medical Image Computing, Department of Computer Science, University College London, London, United Kingdom, 2Centre for the Developing Brain, School of Biomedical Engineering and Imaging Sciences, King's College London, London, United Kingdom, 3Biomedical Engineering Department, School of Biomedical Engineering and Imaging Sciences, King's College London, London, United Kingdom, 4Women’s Health Department, King's College London, London, United Kingdom
Synopsis
We quantify placental structure and function across gestation using a combined T2*-diffusion protocol and InSpect, a data-driven approach for quantitative MRI analysis. We identify and map seven distinct placental tissue environments, and show that these environments are related to dysfunction. Our approach shows promise for diagnosis and monitoring of pregnancy complications.
Introduction
Placental MRI is an emerging technique for prediction, diagnosis, prognosis, and monitoring of pregnancy complications. Two promising modalities are T2* mapping, which informs on placental oxygenation, and diffusion, which quantifies microstructure and microcirculation.Measuring MRI properties simultaneously can account for inherent correlations, and can characterise tissue microstructure with increased sensitivity and specificity. We recently published an acquisition that simultaneously measures T2* and diffusivity in the placenta[1]. We also introduced InSpect, a data-driven technique for analysing quantitative MRI data[2]. InSpect automatically identifies underlying spectral components in an image, and their corresponding voxelwise mappings. Each InSpect component essentially illustrates a distinct tissue environment, such as fetal or maternal blood in the placenta. Here we generalise InSpect to automatically identify the number of components in the data, and apply it to visualise fine microstructural details in healthy and dysfunctional placentas.
Methods
Twelve pregnant participants were imaged in the coronal plane on a Philips Achieva (3T) in the supine position with a protocol that simultaneously varies diffusion encoding (b=0-1600mm2/s) and echo time (TE=78,114,150,186,222ms). Nine were healthy controls, two had chronic hypertension in pregnancy (CH), and one had pre-eclampsia (PE) and signs of fetal growth restriction (FGR). One CH participant was scanned twice and developed superimposed PE between scans. We manually defined an ROI comprising the placenta and adjacent basal plate on the first b=0, TE=78ms volume.We analysed the data by generalising the InSpect algorithm[2]. Briefly, InSpect seeks a lower-dimensional, data-driven, representation of quantitative MRI images. The representation comprises M canonical spectral components, $$$F_m$$$, and corresponding voxelwise maps, $$$\{z_{n1},z_{n2},...,z_{nM}\}_{n=1}^N$$$. The algorithm proceeds by iteratively maximising
$$
\mathbf{F}_m=\mbox{argmin}_{\mathbf{F}_m\geq 0}\Bigg|\Bigg|\sum_{n=1}^N(\mathbf{K}z_{nm})\mathbf{F}_m-\sum_{n=1}^N\left(\mathbf{S}_n-\mathbf{K}\left(\sum_{m\neq n}z_{nm}\mathbf{F}_m\right)\right)\Bigg|\Bigg|_2^2,\mbox{ for spectral components}\;m=1,...,M
$$
and
$$
\{z_{nm}\}_{m=1}^M=\mbox{argmax}_{z_{nm}}\log\mathcal{N}\left(\mathbf{S}_n;\mathbf{K} F(\mathbf{z}_{n}),\sigma_n^2I\right),\mbox{ subject to}\;\sum_{m=1}^M z_{nm}=1,\mbox{for voxels}\;n=1,..,N
$$
where $$$\mathbf{S}_n$$$ is the voxelwise signal and $$$\mathbf{K}$$$ is a dictionary of kernels, e.g. $$$\exp(−TE/T_2^*)\exp(−bD))$$$ for T2*-diffusion.
Whereas M was previously user-defined, here we automatically select the number of spectral components (M) in the data using the Bayesian information criterion (BIC). For an InSpect run with fixed M, the BIC is
$$BIC=k\log n−2\log\pi(D|\hat{\theta})$$
where there are $$$k$$$ parameters, $$$n$$$ observations, and $$$\log\pi(D|\hat{\theta})$$$ is the maximised log-likelihood.
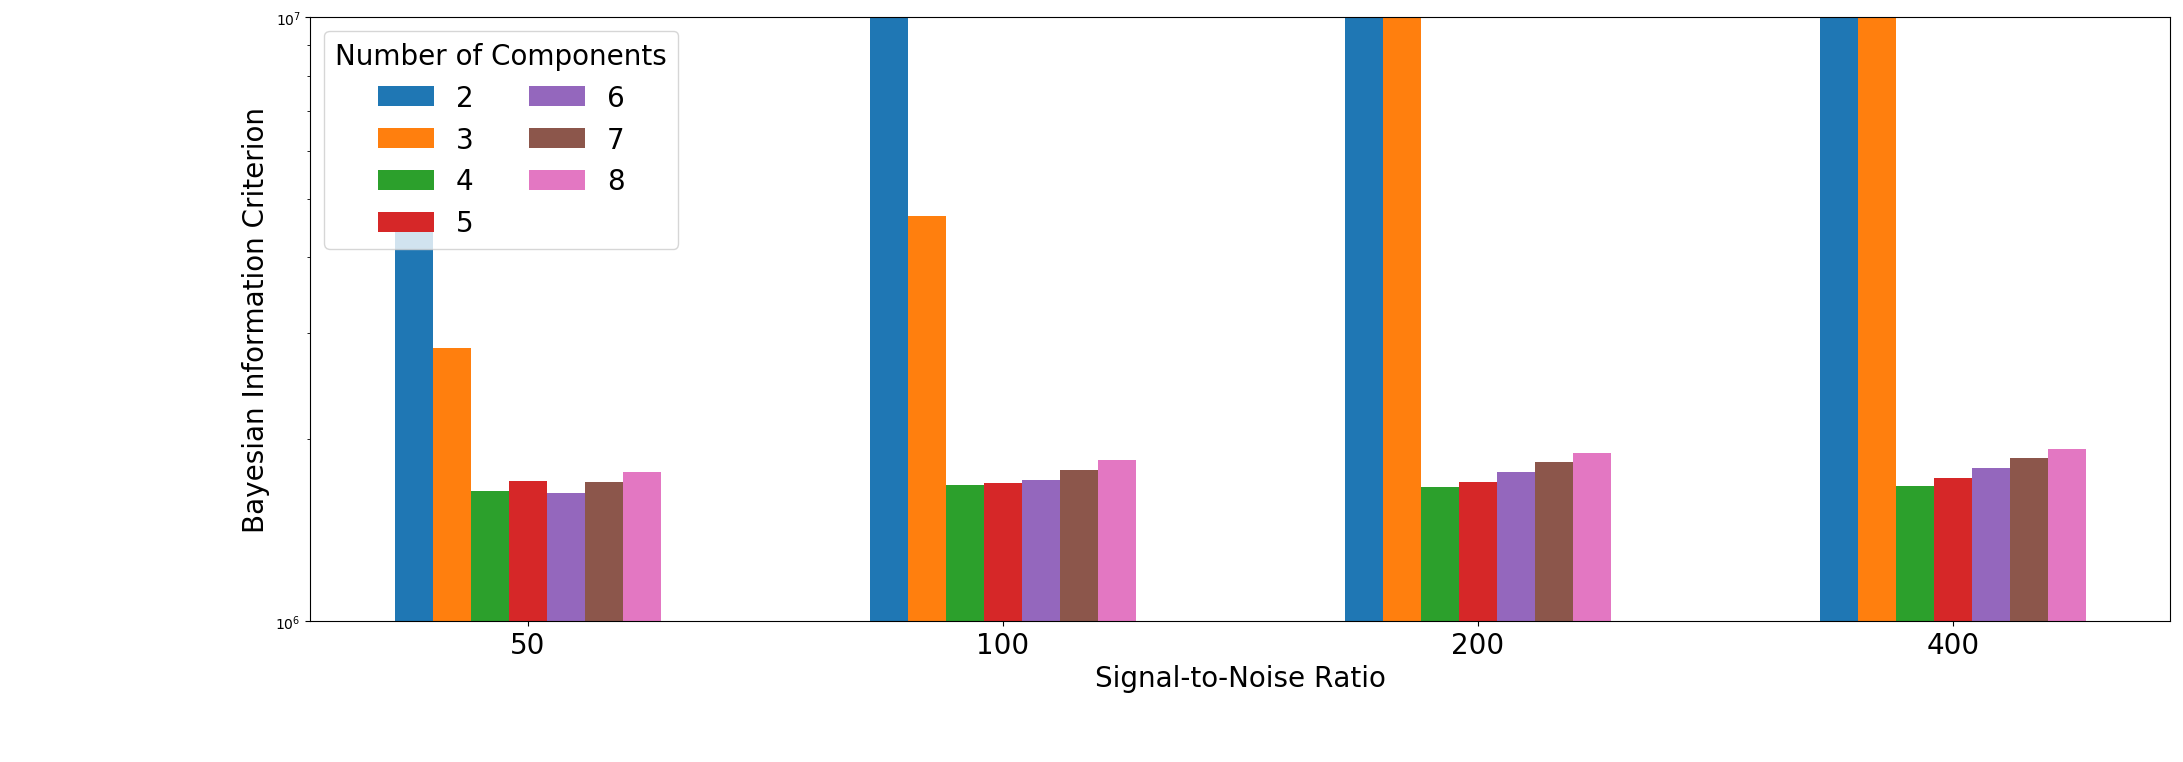
We also relaxed the condition (used in [2]) that spectral component weights must sum to 1, and hence allow for overall scale changes across voxels. After first testing the InSpect BIC calculation in simulations, we ran InSpect on all 13 placenta scans simultaneously for all choices of the number of canonical spectral components from 2 to 10, and calculated the BIC for each run.
Results
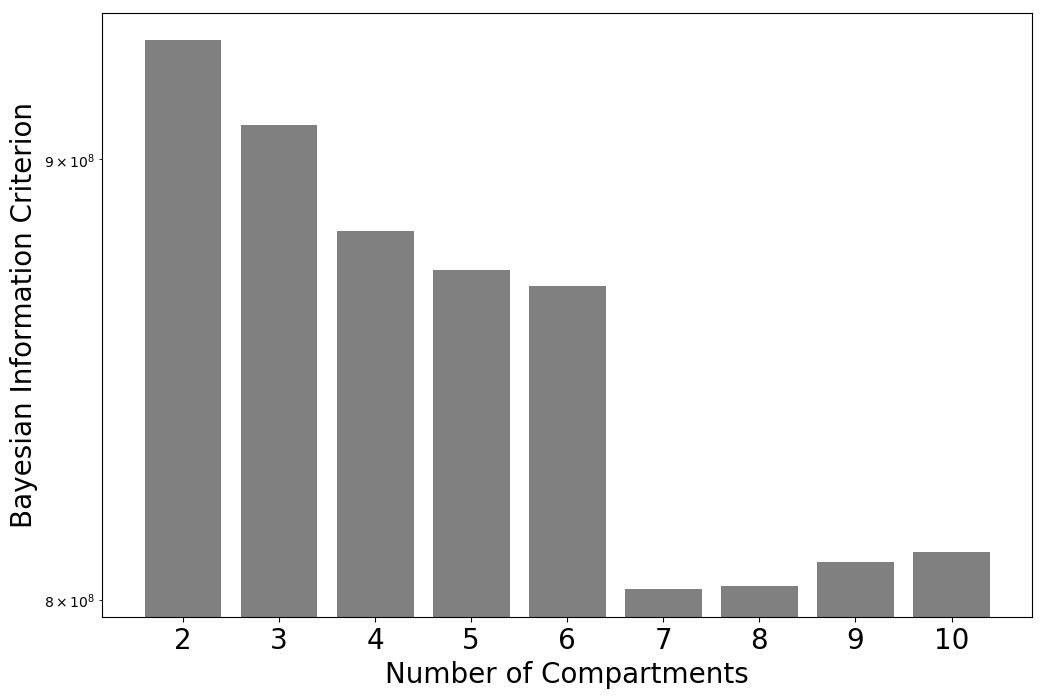
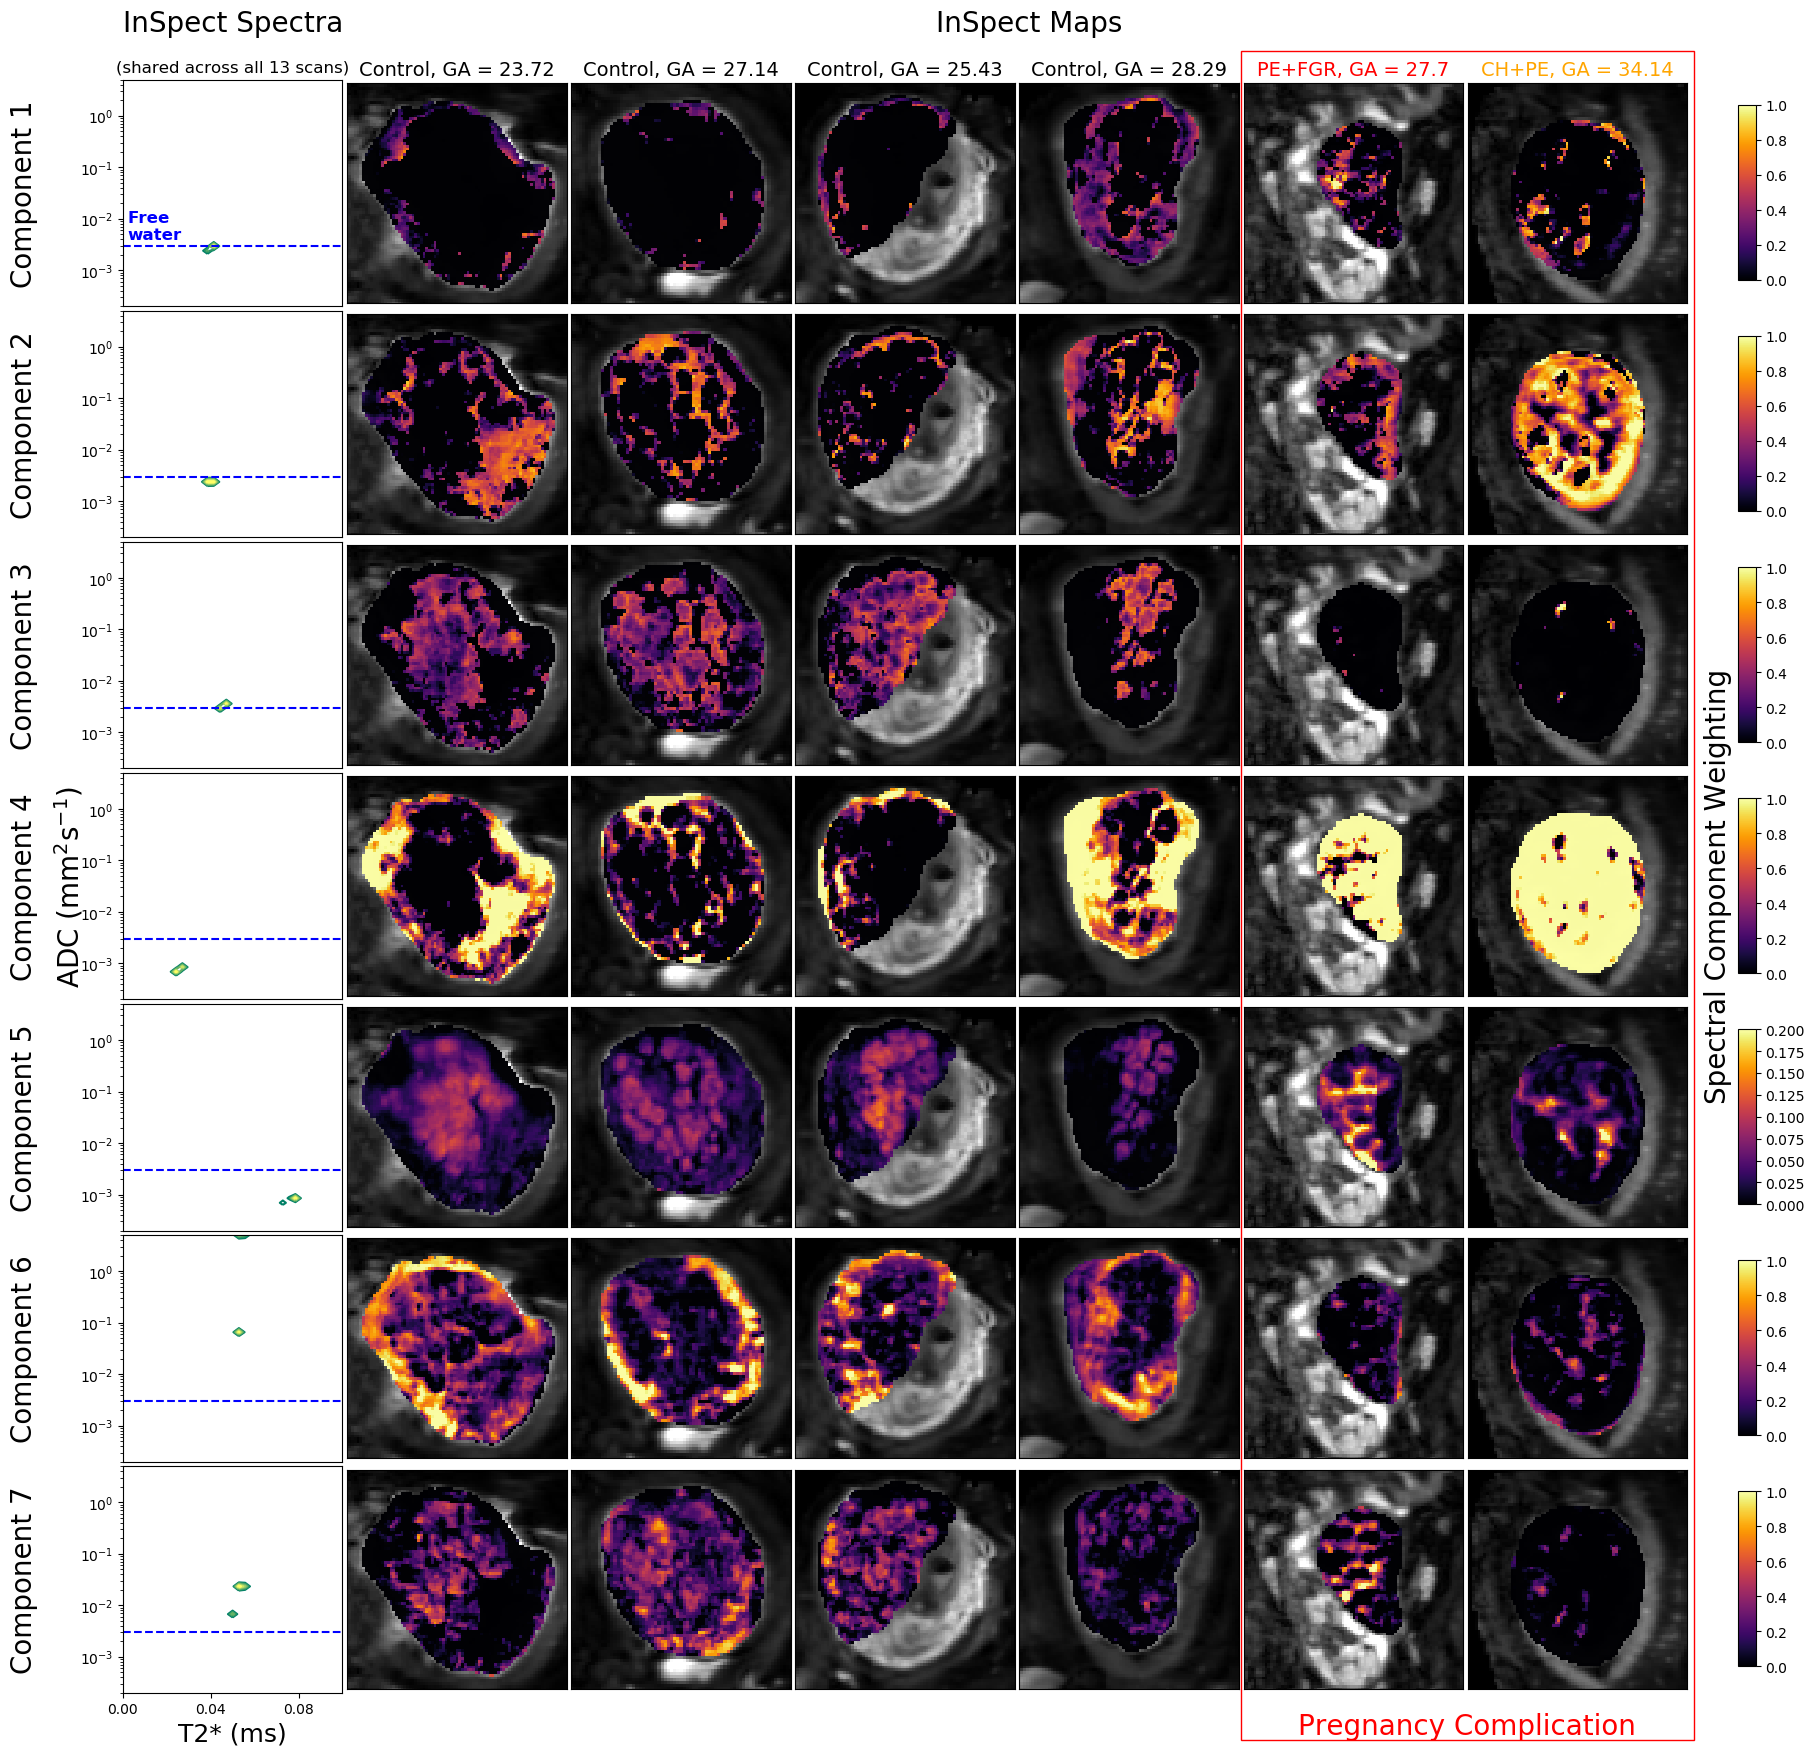
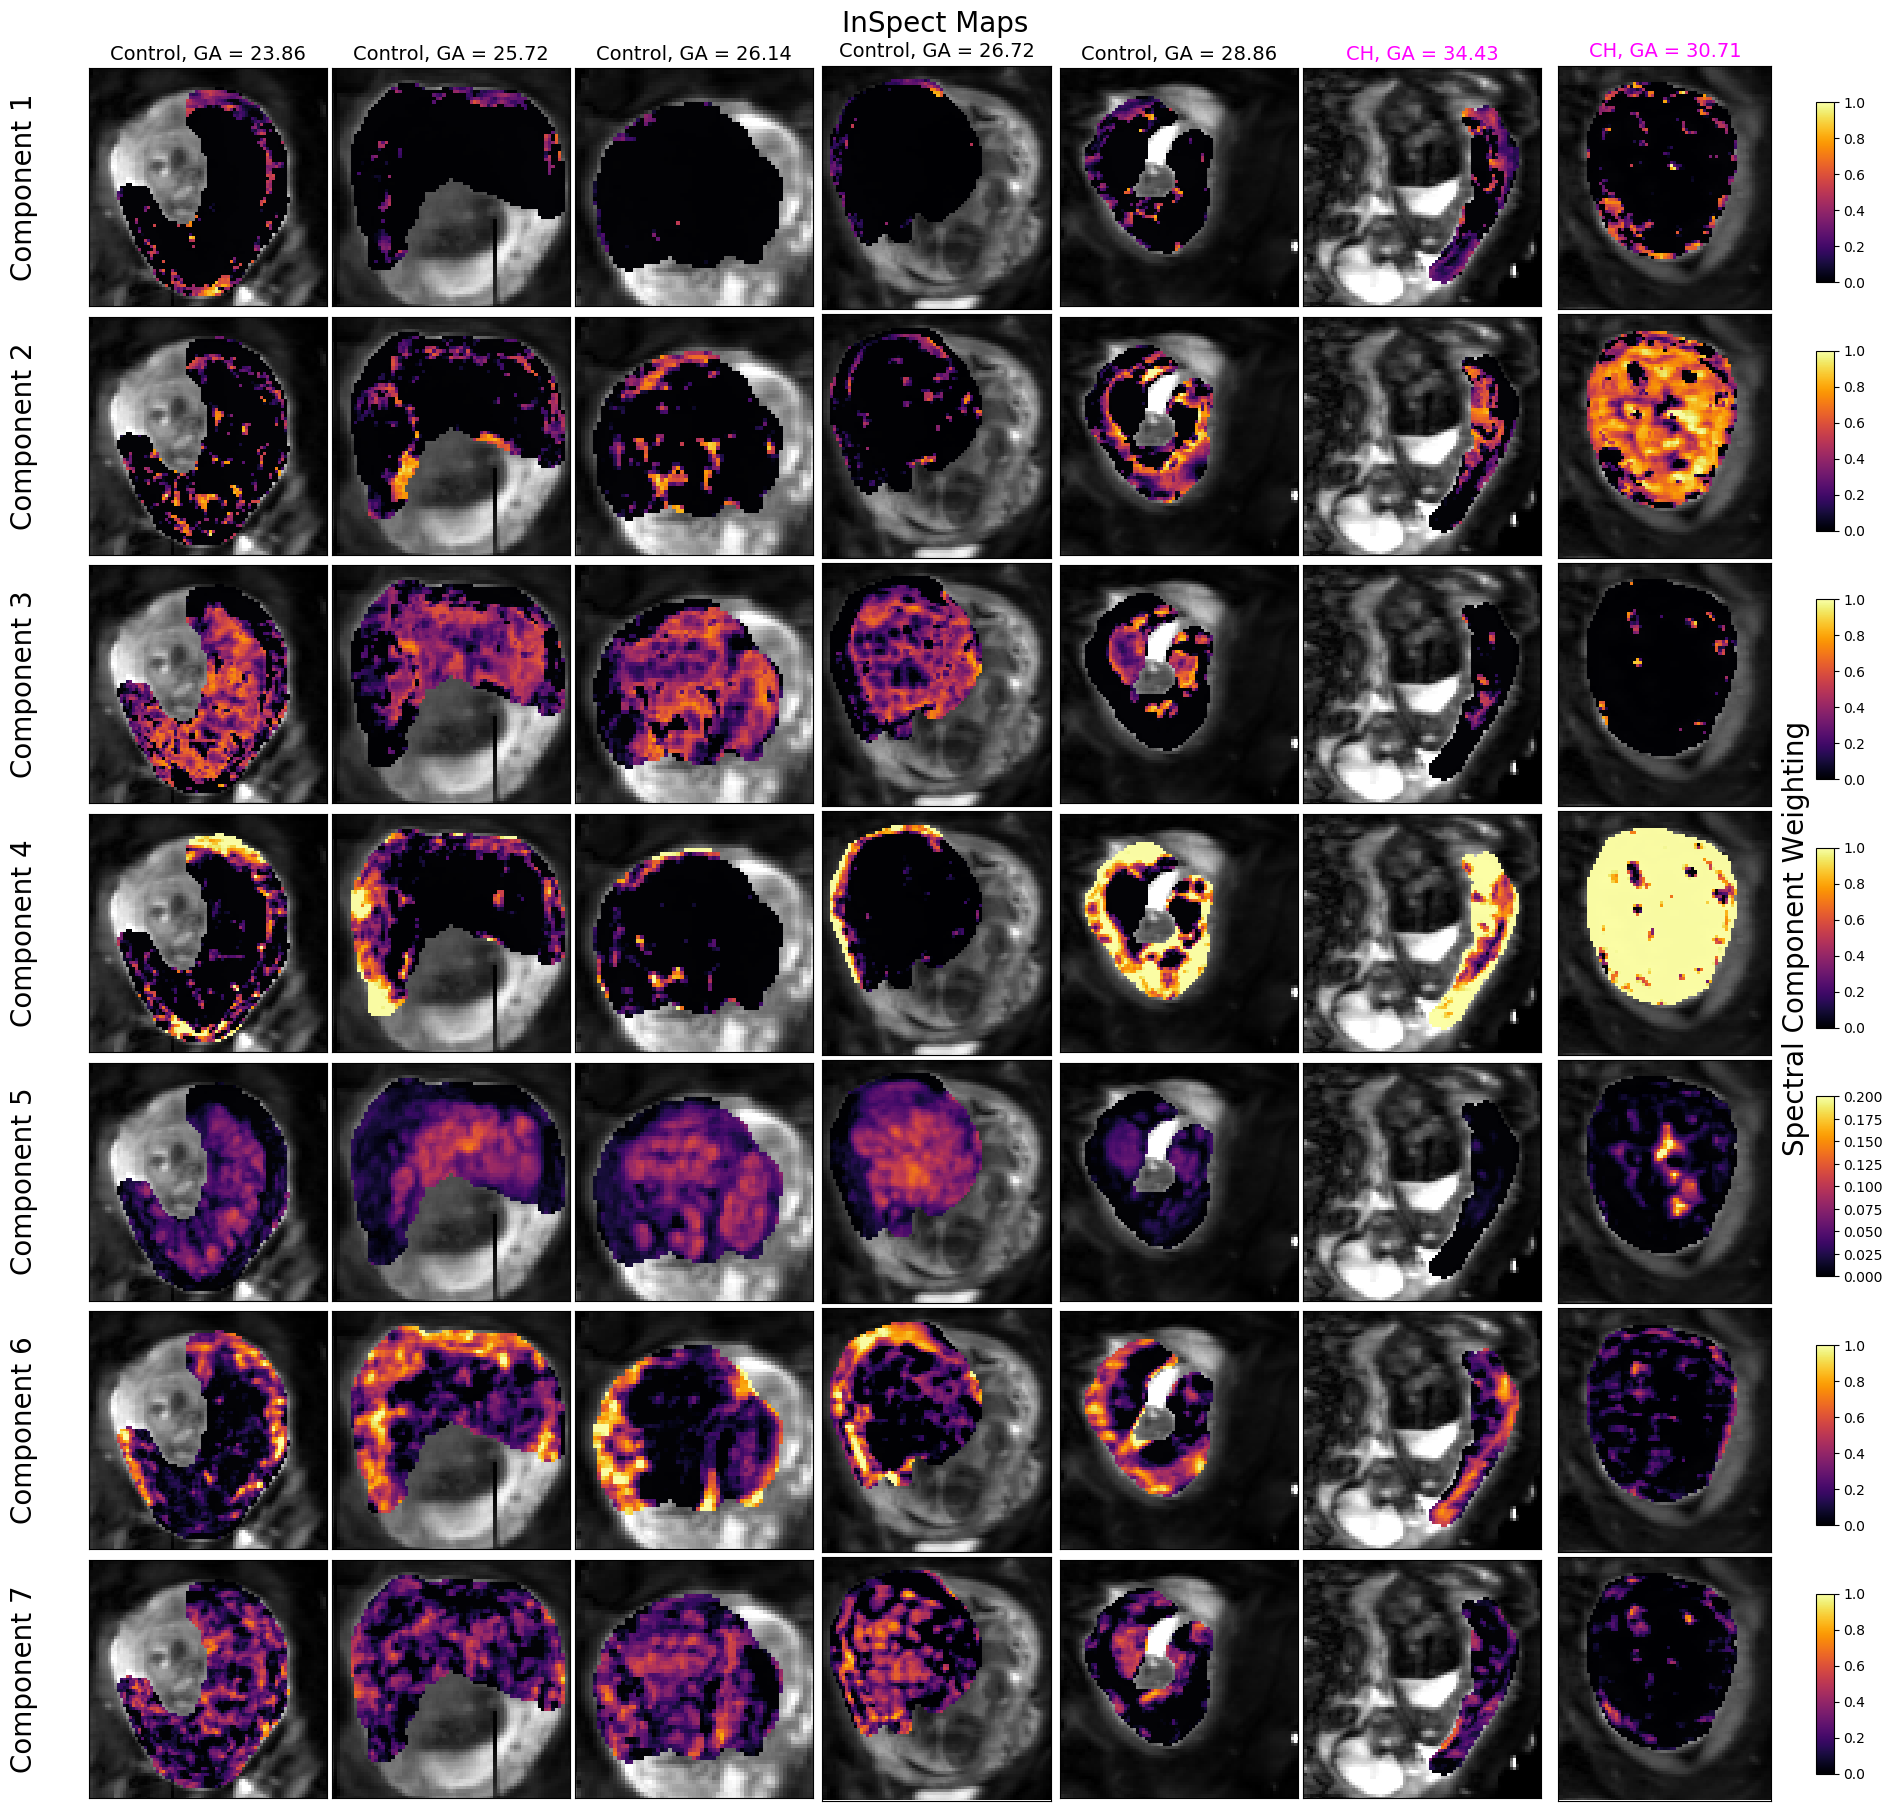
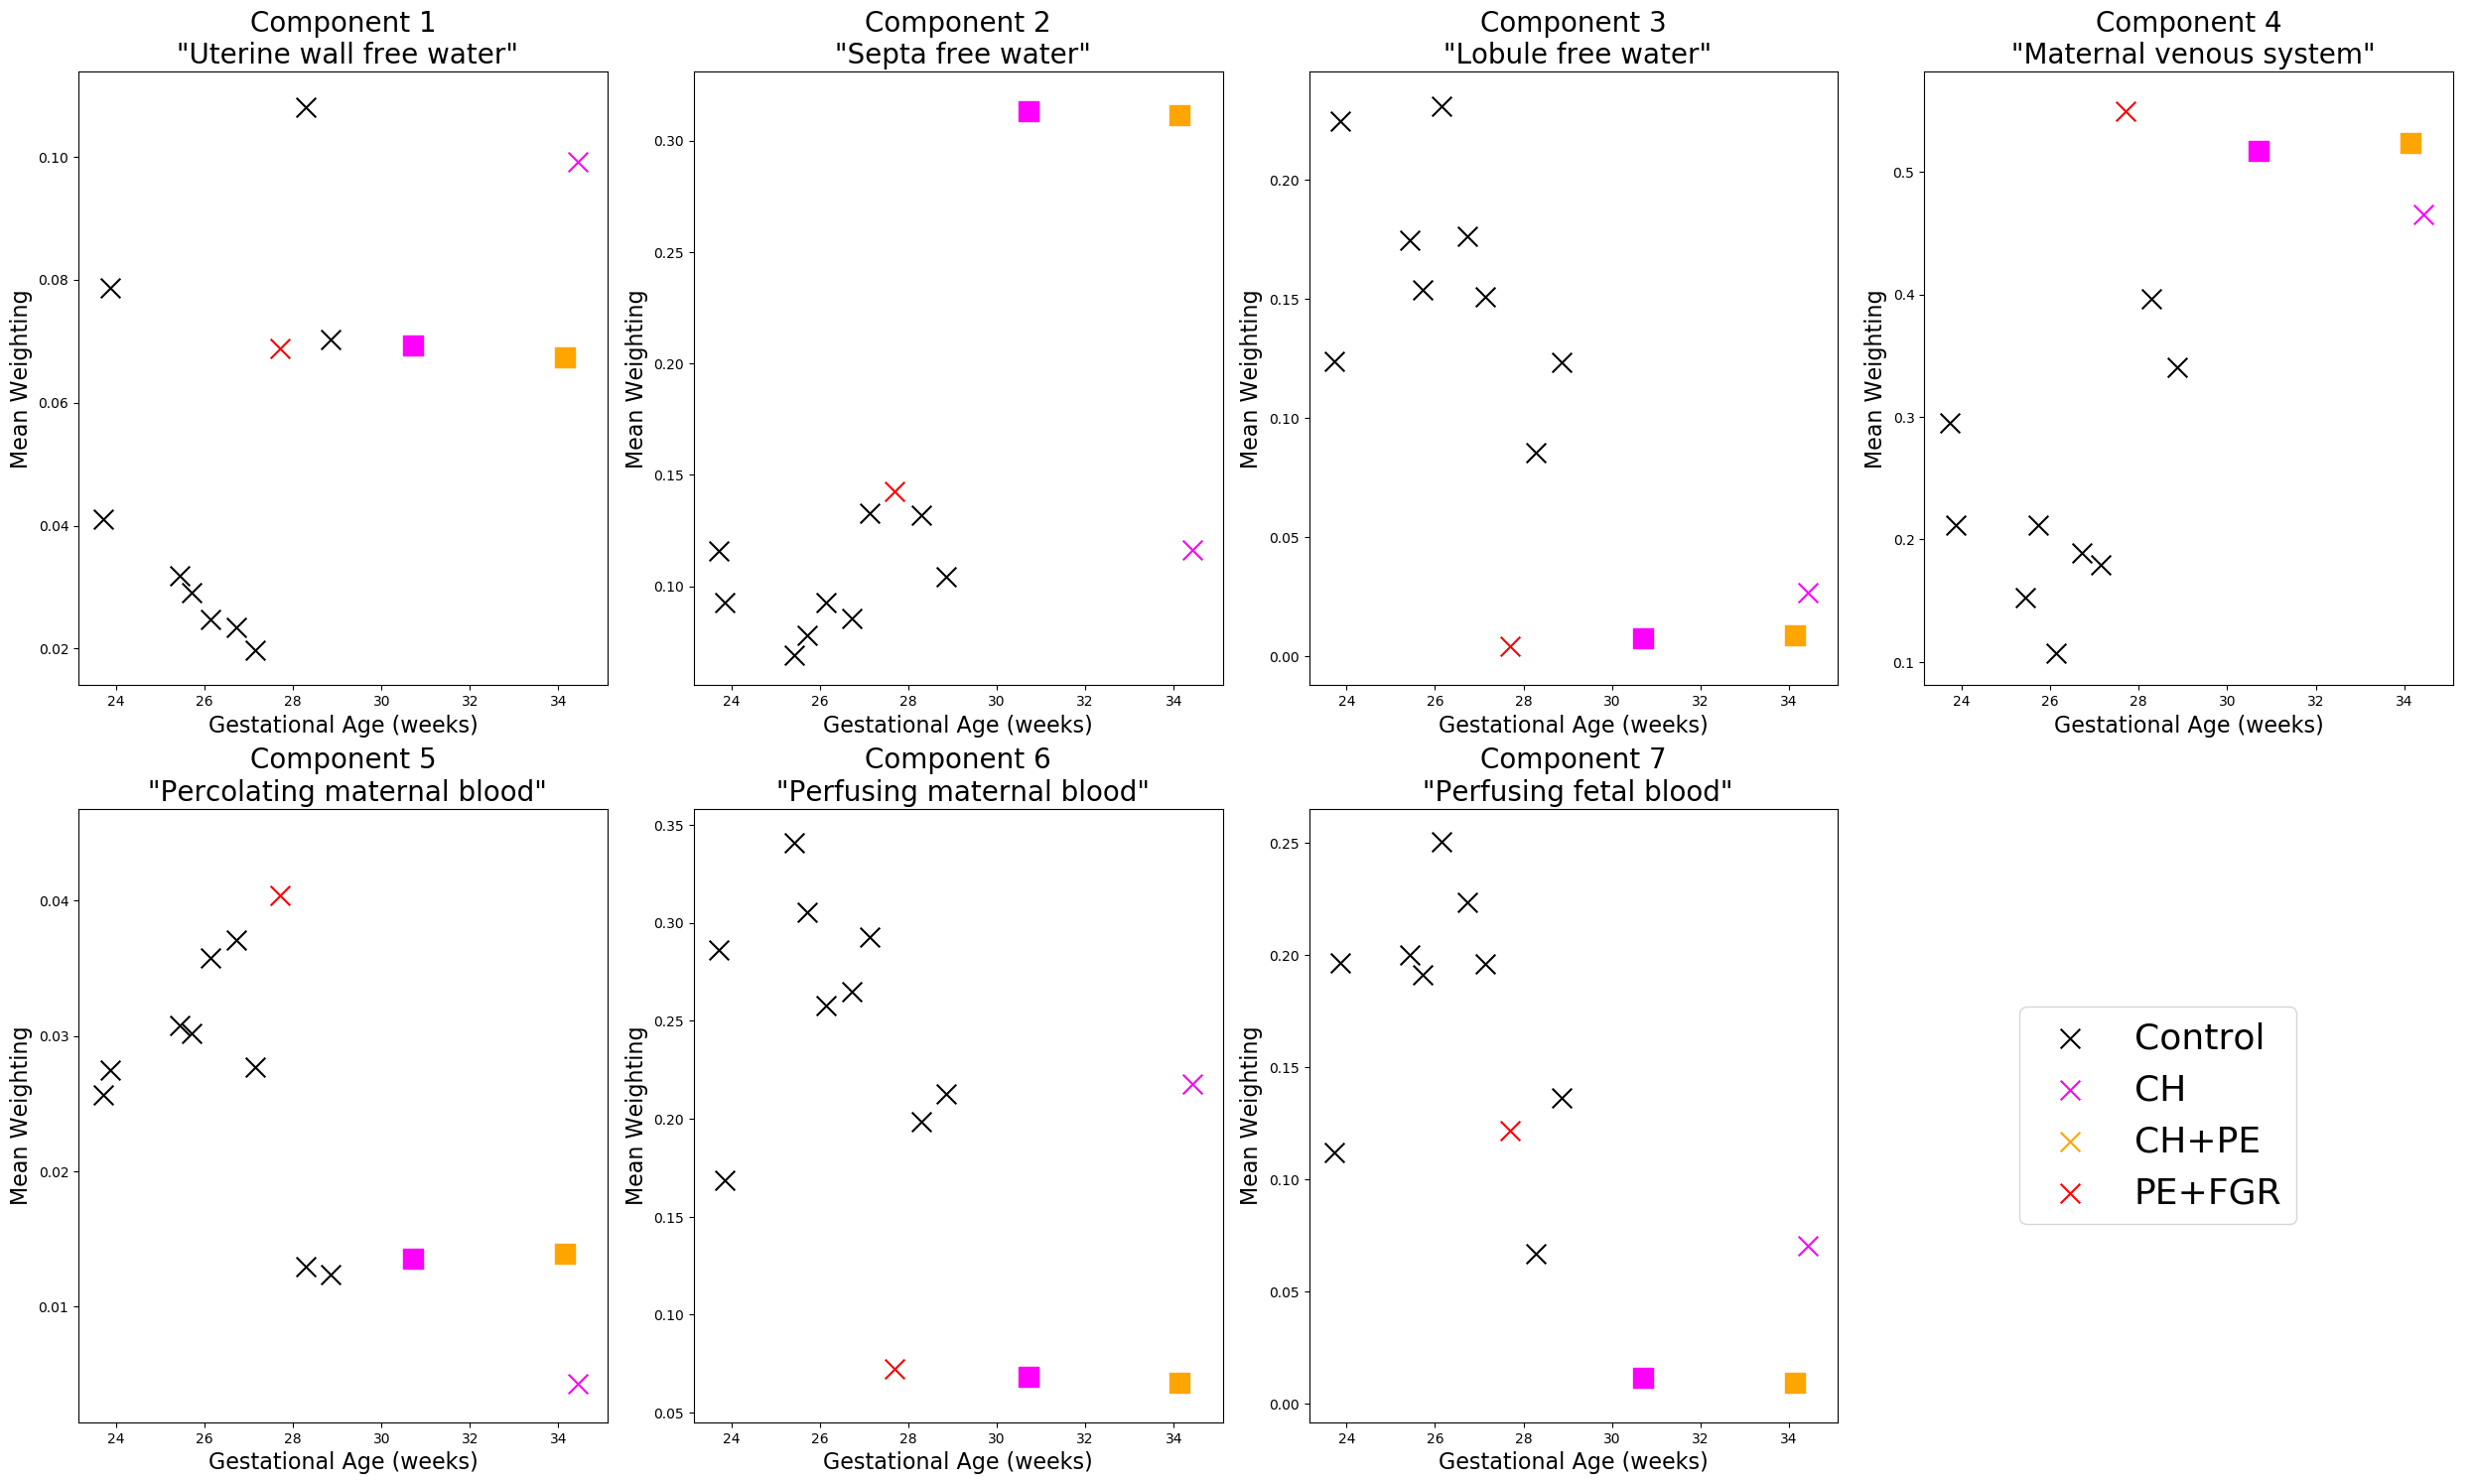
Figure 1 shows that the BIC typically identifies the correct number of underlying spectral components in simulations. Figure 2 shows that the 7-component InSpect run on the placental data had the lowest BIC, suggesting that this choice explains the data best.Figures 3 and 4 display the 7-component InSpect results with all participants’ placental MR images analysed simultaneously. The first column in Figure 3 shows the canonical spectral components (shared across all participants), and the remaining columns show the corresponding weighting maps.
Discussion
The spectral components in Figures 3 and 4 have distinct characteristics. Even though the algorithm imposes no direct anatomical analogue for any of the components, the corresponding maps identify clear anatomical structures that are consistent across control placentas, and show clear differences in dysfunctional placentas. This suggests that InSpect identifies distinct tissue environments, and that these environments are salient to placental dysfunction. Given the spectral components and maps, we make these initial speculations about the placental environments associated with each component:- Components one, two and three have a single peak with ADC close to free water. In maps, these components are prominent in the uterine wall, areas surrounding lobules, and lobules respectively. These observations are consistent with these components representing freely diffusing water in the uterine wall, septa, and lobules respectively.
- Component four has a low ADC, low T2* peak, and maps are prominent in maternal tissue. This is consistent with lower oxygen saturation and hindered diffusion, potentially deoxygenated maternal blood percolating through convoluted intervillous space.
- Component five has a single peak with low ADC and high T2*, and is prominent in lobules. This is consistent with high oxygen saturation and hindered diffusion, potentially oxygenated maternal blood in intervillous space (e.g. [3]).
- Component six has two peaks with high ADC, and is prominent in the uterine wall, potentially reflecting maternal blood perfusing in maternal vasculature.
- Component seven has two peaks with ADC higher than free water, and is prominent in lobules, potentially reflecting fetal blood perfusing in fetal vasculature.
Conclusion
We generalise InSpect to automatically identify the number of components in quantitative MRI data. We show that this approach can identify fine-grained placental microenvironments, and hence has the potential to quantify placental dysfunction.Acknowledgements
We thank all mothers, midwives, obstetricians, and radiographers who played a key role in obtaining the datasets. This work was supported by the NIH Human Placenta Project grant 1U01HD087202-01 (Placenta Imaging Project [PiP]); Wellcome Trust (201374/Z/16/Z); EPSRC (N018702, M020533, EP/N018702/1); UKRI Future Leaders Fellowships (MR/T020296/1 for MP, MR/T018119/1 JH) ; the European Union’s Horizon 2020 research and innovation programme under grant agreement No. 666992; NIHR (RP-2014-05-019); by core funding from the Wellcome/EPSRC Centre for Medical Engineering at Kings College London (WT 203148/Z/16/Z) and by the National Institute for Health Research (NIHR) Biomedical Research Centre based at Guy’s and St Thomas’ NHS Foundation Trust and Kings’ College London. The views expressed are those of the authors and not necessarily those of the NHS, the NIHR or the Department of Health.References
1. Slator PJ, Hutter J, Palombo M, Jackson LH, Ho A, Panagiotaki E, et al. Combined Diffusion-Relaxometry MRI to Identify Dysfunction in the Human Placenta. Magn Reson Med. John Wiley & Sons, Ltd; 2019; 1–22. doi:10.1002/mrm.27733
2. Slator PJ, Hutter J, Marinescu RV, Palombo M, Jackson LH, Ho A, et al. Data-Driven Multi-Contrast Spectral Microstructure Imaging with InSpect. MICCAI 2020. 2020;12266 LNCS. doi:10.1007/978-3-030-59725-2_36
3. Dellschaft NS, Hutchinson G, Shah S, Jones NW, Bradley C, Leach L, et al. The haemodynamics of the human placenta in utero. Ikawa M, editor. PLoS Biol. Public Library of Science; 2020;18: e3000676. doi:10.1371/journal.pbio.3000676
4. Slator PJ, Hutter J, Panagiotaki E, Rutherford MA, Hajnal J V., Alexander DC, et al. IVIM MRI of the Placenta. In: Le Bihan D, Iima M, Federau C, Sigmund EE, editors. Intravoxel Incoherent Motion (IVIM) MRI. Pan Stanford; 2018. pp. 345–366. doi:10.1201/9780429427275-16
5. Anderson KB, Hansen DN, Haals C, Sinding M, Petersen A, Frøkjær JB, et al. Placental diffusion-weighted MRI in normal pregnancies and those complicated by placental dysfunction due to vascular malperfusion. Placenta. 2020;91: 52–58. doi:10.1016/j.placenta.2020.01.009
6. Derwig I, Barker GJ, Poon L, Zelaya F, Gowland P, Lythgoe DJ, et al. Association of placental T2relaxation times and uterine artery Doppler ultrasound measures of placental blood flow. Placenta. Elsevier Ltd; 2013;34: 474–479. doi:10.1016/j.placenta.2013.03.005
7. Sinding M, Peters DA, Frøkjær JB, Christiansen OB, Petersen A, Uldbjerg N, et al. Prediction of low birth weight: Comparison of placental T2* estimated by MRI and uterine artery pulsatility index. Placenta. Elsevier; 2017;49: 48–54. doi:10.1016/j.placenta.2016.11.009
8. Ingram E, Morris D, Naish J, Myers J, Johnstone E. MR imaging measurements of altered placental oxygenation in pregnancies complicated by fetal growth restriction. Radiology. 2017;285: 953–960. doi:10.1148/radiol.2017162385
9. Hutter J, Slator PJ, Jackson L, Gomes ADS, Ho A, Story L, et al. Multi‐modal functional MRI to explore placental function over gestation. Magn Reson Med. John Wiley & Sons, Ltd; 2019;81: 1191–1204. doi:10.1002/mrm.27447
10. Ho AEP, Hutter J, Jackson LH, Seed PT, Mccabe L, Al-Adnani M, et al. T2* Placental Magnetic Resonance Imaging in Preterm Preeclampsia: An Observational Cohort Study. Hypertens (Dallas, Tex 1979). 2020;75: 1523–1531. doi:10.1161/HYPERTENSIONAHA.120.14701
Figures