0711
APPLAUSE: Automatic Prediction of PLAcental health via U-net Segmentation and statistical Evaluation1Centre for Medical Engineering, King's College London, London, United Kingdom, 2Women's Health, King's College London, London, United Kingdom, 3King's College London, London, United Kingdom, 4Centre for the Developing Brain, King's College London, London, United Kingdom
Synopsis
The placenta is key for any successful pregnancy. Deviations from the normal dynamic maturation throughout gestation are closely linked to major pregnancy complications. Automatic segmentation and age prediction based on a 30sec MRI T2* scan is enabled and evaluated in >100 pregnancies. High abnormality scores correlate with low birth weight, premature birth and histopathological findings. Retrospective application on a different cohort imaged at 1.5T illustrates the ability for direct clinical translation. The proposed machine-learning pipeline runs in close to real-time and, deployed in clinical settings, has the potential to become a cornerstone of diagnosis and intervention of placental insufficiency.
Introduction
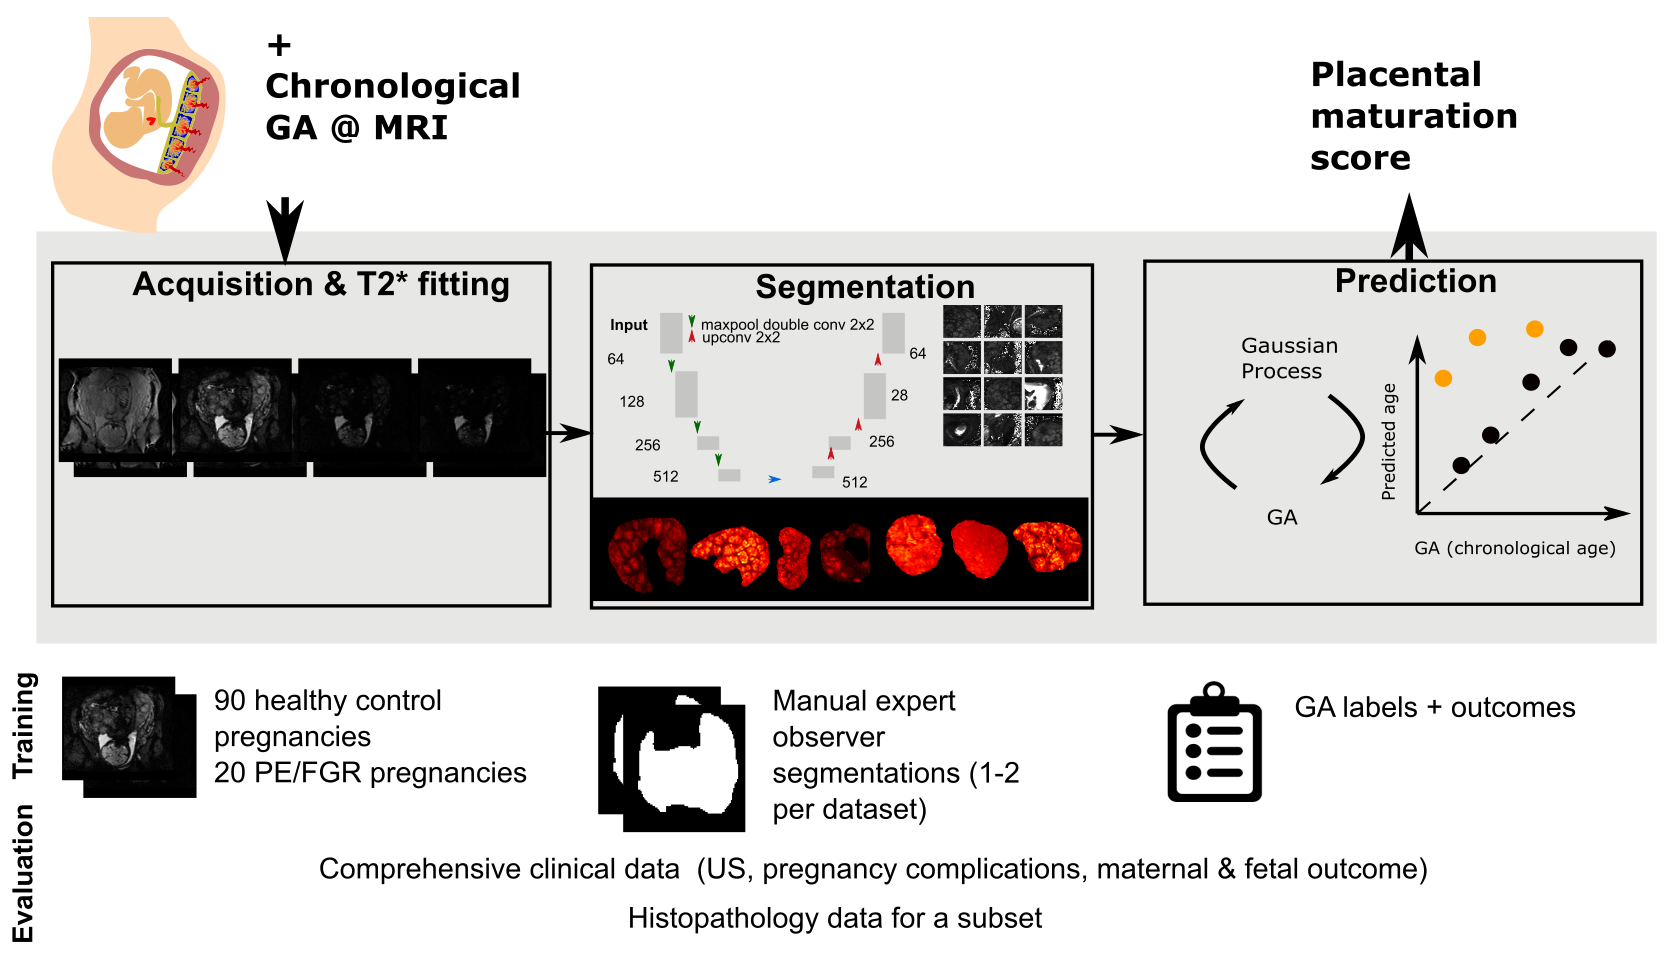
The placenta plays a crucial role for any successful human pregnancy. It changes across gestation to adapt to the increasing demands of the foetus. As the placenta ages, there is increased deposition of calcium and fibrin, contributed to the lobulated appearance and increase in granularity on imaging. This process of placental ageing occurs normally non-pathologically in accord with gestational age (GA). However, accelerated aging of the placenta, as documented on histopathology, has been associated with increased risk of placental failure, fetal growth restriction, pre-eclampsia (PE) and unexplained late stillbirth. In contrast, delayed maturation of the placenta is associated with gestational diabetes and chromosomal abnormalities [Benton2018].Functional MR imaging could facilitate identification of accelerated ageing or of a delayed trajectory in individual placentas. Antenatal T2* assessment in-vivo has shown great promise [Sorensen2020] but clinical translation is hampered by time consuming manual segmentation and analysis techniques based on comparison against normative curves. Prior automatic segmentation efforts have focused on the anatomical T2-weighted data.Previously, in the setting of neuroimaging [Cole2018] Gaussian Process regression (GPR) [Rasmussen2004], has been successfully used. GPR is a nonparametric algorithm that assigns a probability to each possible function describing the training data. In this work, we will use automatic segmentation based on U-Nets and GPR to obtain a placental age prediction to identify abnormal data (Figure 1).Methods
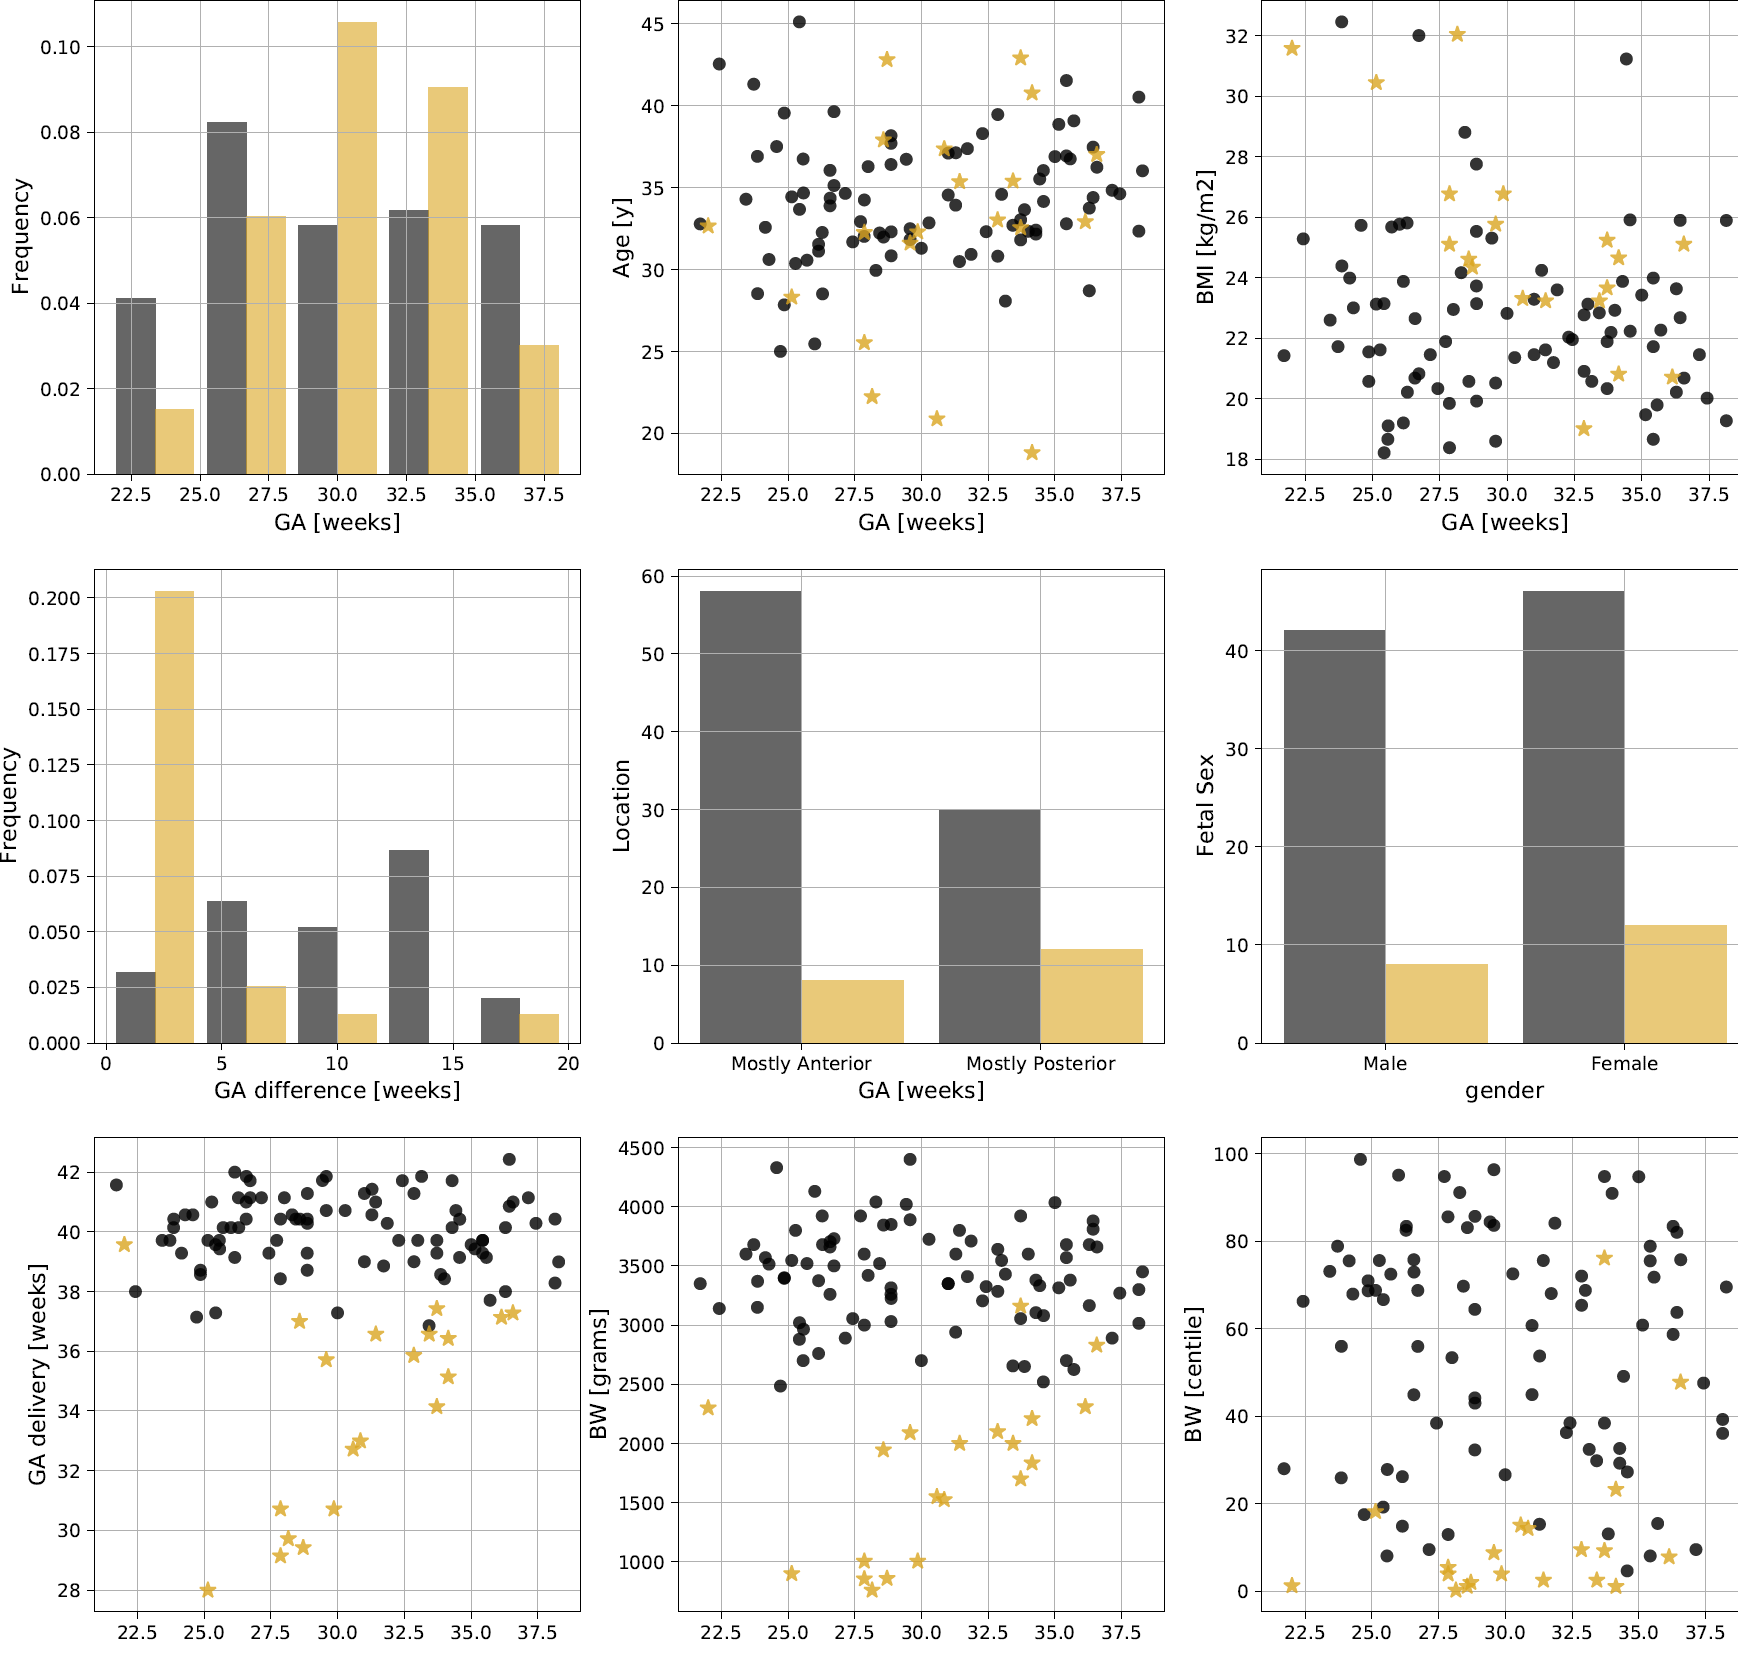
A free-breathing Multi-echo gradient-echo MRI scan was performed on a clinical 3T Philips Achieva (Best, The Netherlands) on 108 women (singleton pregnancies, 18-40 weeks GA, REC 14/LO/1169) using the 32-channel cardiac receiver coil with frequent monitoring of vital signs.Participants were assigned to a high and low-risk cohort based on outcome data (GA at birth, birth weights, pregnancy complications) and enrollment characteristics (Figure 2). Histopathological evaluation was performed for 56 cases. Datasets with signs of sub-clinical contractions were removed, the data was fitted to a mono-exponential decay curve and the placental parenchyma segmented by 1-2 experts.Segmentation
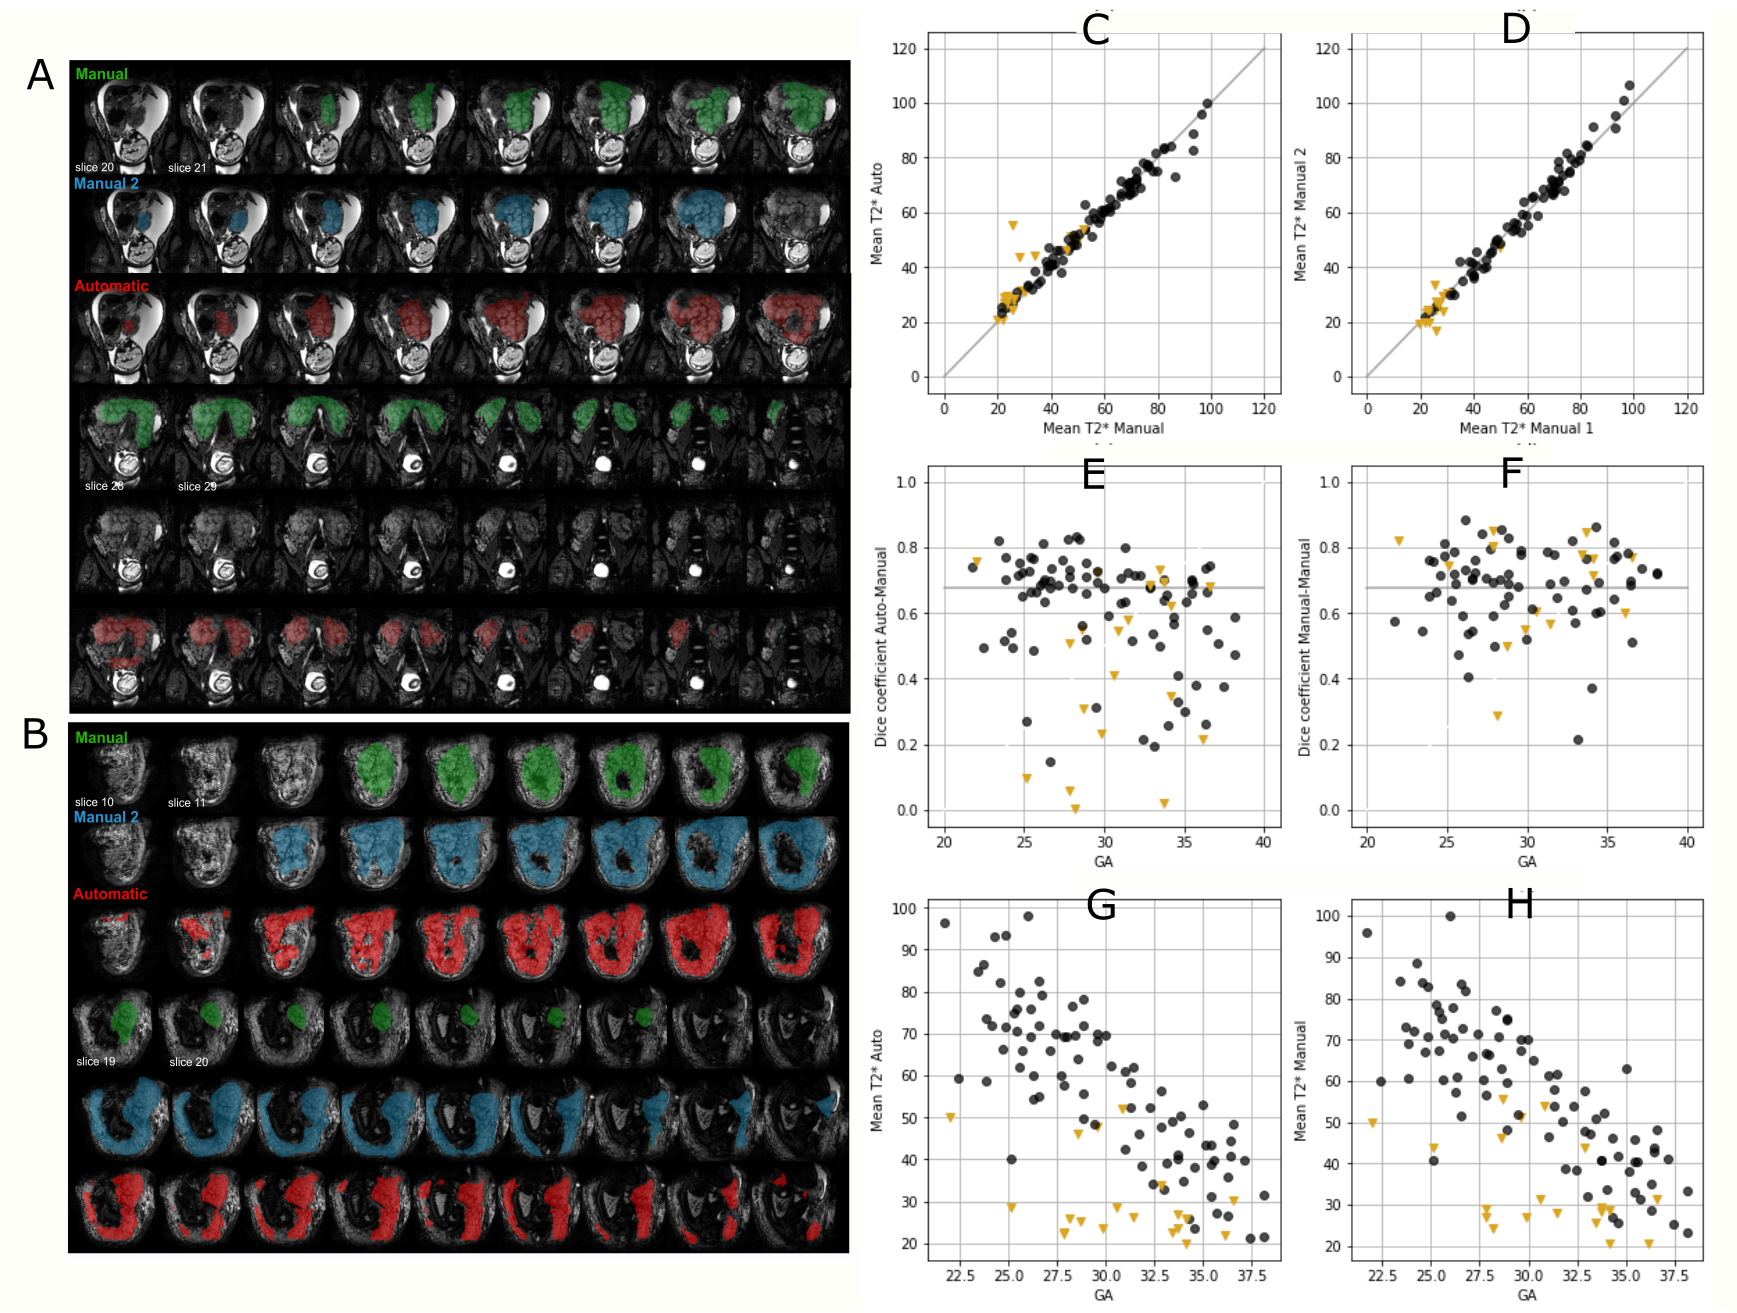
A 2D U-net implementation was employed. Training and inference were performed on 2D patches (64x64 voxels) after demeaning and data augmentation (cropping, mirroring and rotations) [Isensee2020]. Stochastic gradient descent was employed (Adam optimizer, learning rate=0.0001, batch size=50000 epochs, binary cross entropy loss). Five-fold stratified cross-validation was performed. Results were evaluated with the DICE coefficient (segmentation) and the Pearson Correlation Coefficient (PCC) and Root-Mean-Square-Error (T2* values).
Unbiased Placental health prediction
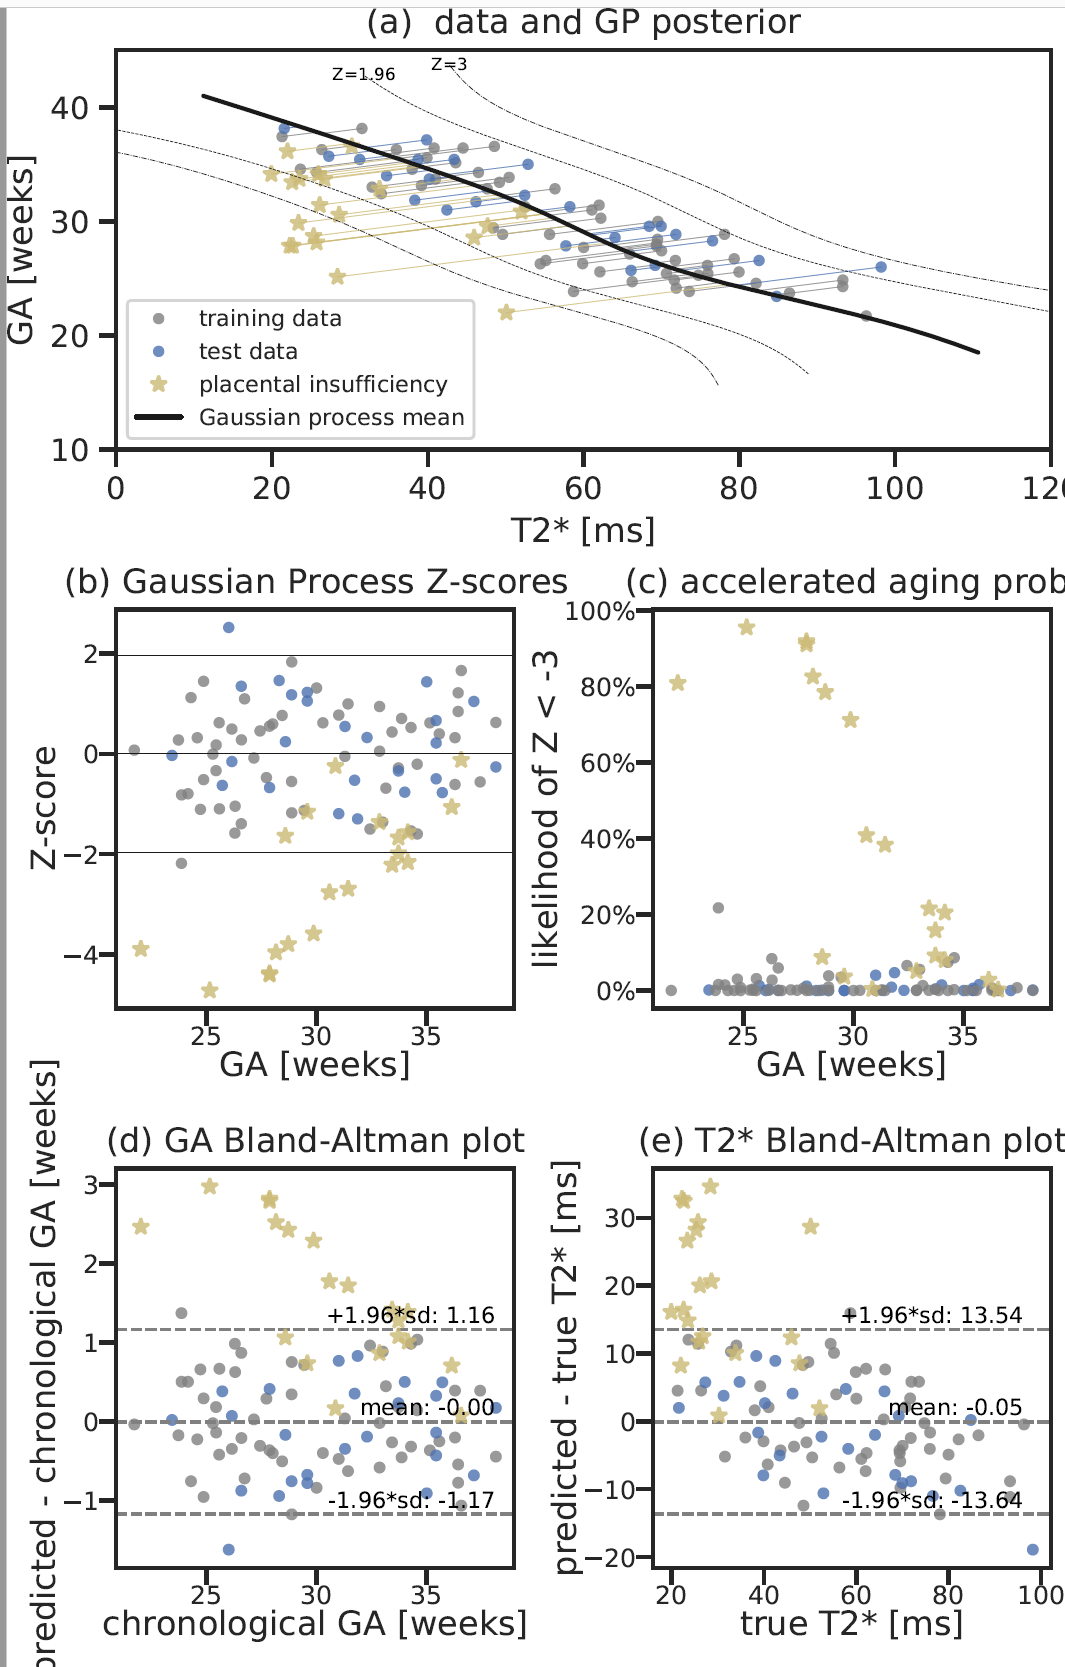
To predict biological placental age $t_b$ from the mean T2* value ($\overbar{T2^*}$), a probabilistic function $t_b=f(\overbar{T2^*}) + \epsilon$ is assumed (noise $\epsilon \sim \mathcal{N}(0,\sigma_\epsilon^2 \mathbb{1})$). A GPR regression model was trained in SciKitLearn to approximate $f(x) \sim \mathcal{GP}(\mu(x),k_\theta(x,x'))$. The mean $\mu(x)$ was constant, the covariance function $k$ a linear trend with local nonlinear deviation using a sum of dot product kernel and squared-exponential function kernel (length-scale $\le 1\sigma(T2^*)$) with an additive white-noise kernel. Model hyperparameters $\theta$ were estimated by maximizing the log marginal likelihood and the probability of the training data conditioned on kernel hyperparameters. The performance was evaluated by calculating the mean squared error and PCC between biological and predicted GA ($t_b$). To obtain an unbiased estimate of placental health, the $(t_b, \overbar{T2^*})$ data points were transformed using a least squares fit. Low-risk data sets were split 0.7:0.3 into training:test data. Only low-risk cases were chosen for training as only these allow the GPR to accurately model normal maturation over gestation. A multivariate normal noise model with covariance matrix $\text{diag}(\sigma_\epsilon^2, \sigma_\delta^2)$ is assumed for new observations and the corresponding predictive distribution estimated via Markov Chain Monte-Carlo sampling (10000 samples). Conditional on the hyperparameters, training data, and input noise estimates, the likelihood that a placenta exhibits abnormally accelerated aging ($Z < -3$) can be obtained. Data was also acquired from 36 control and 6 PE cases on a clinical 1.5T Philips Ingenia scanner with an adapted protocol. The processing was done with the pipeline discussed here.
Results
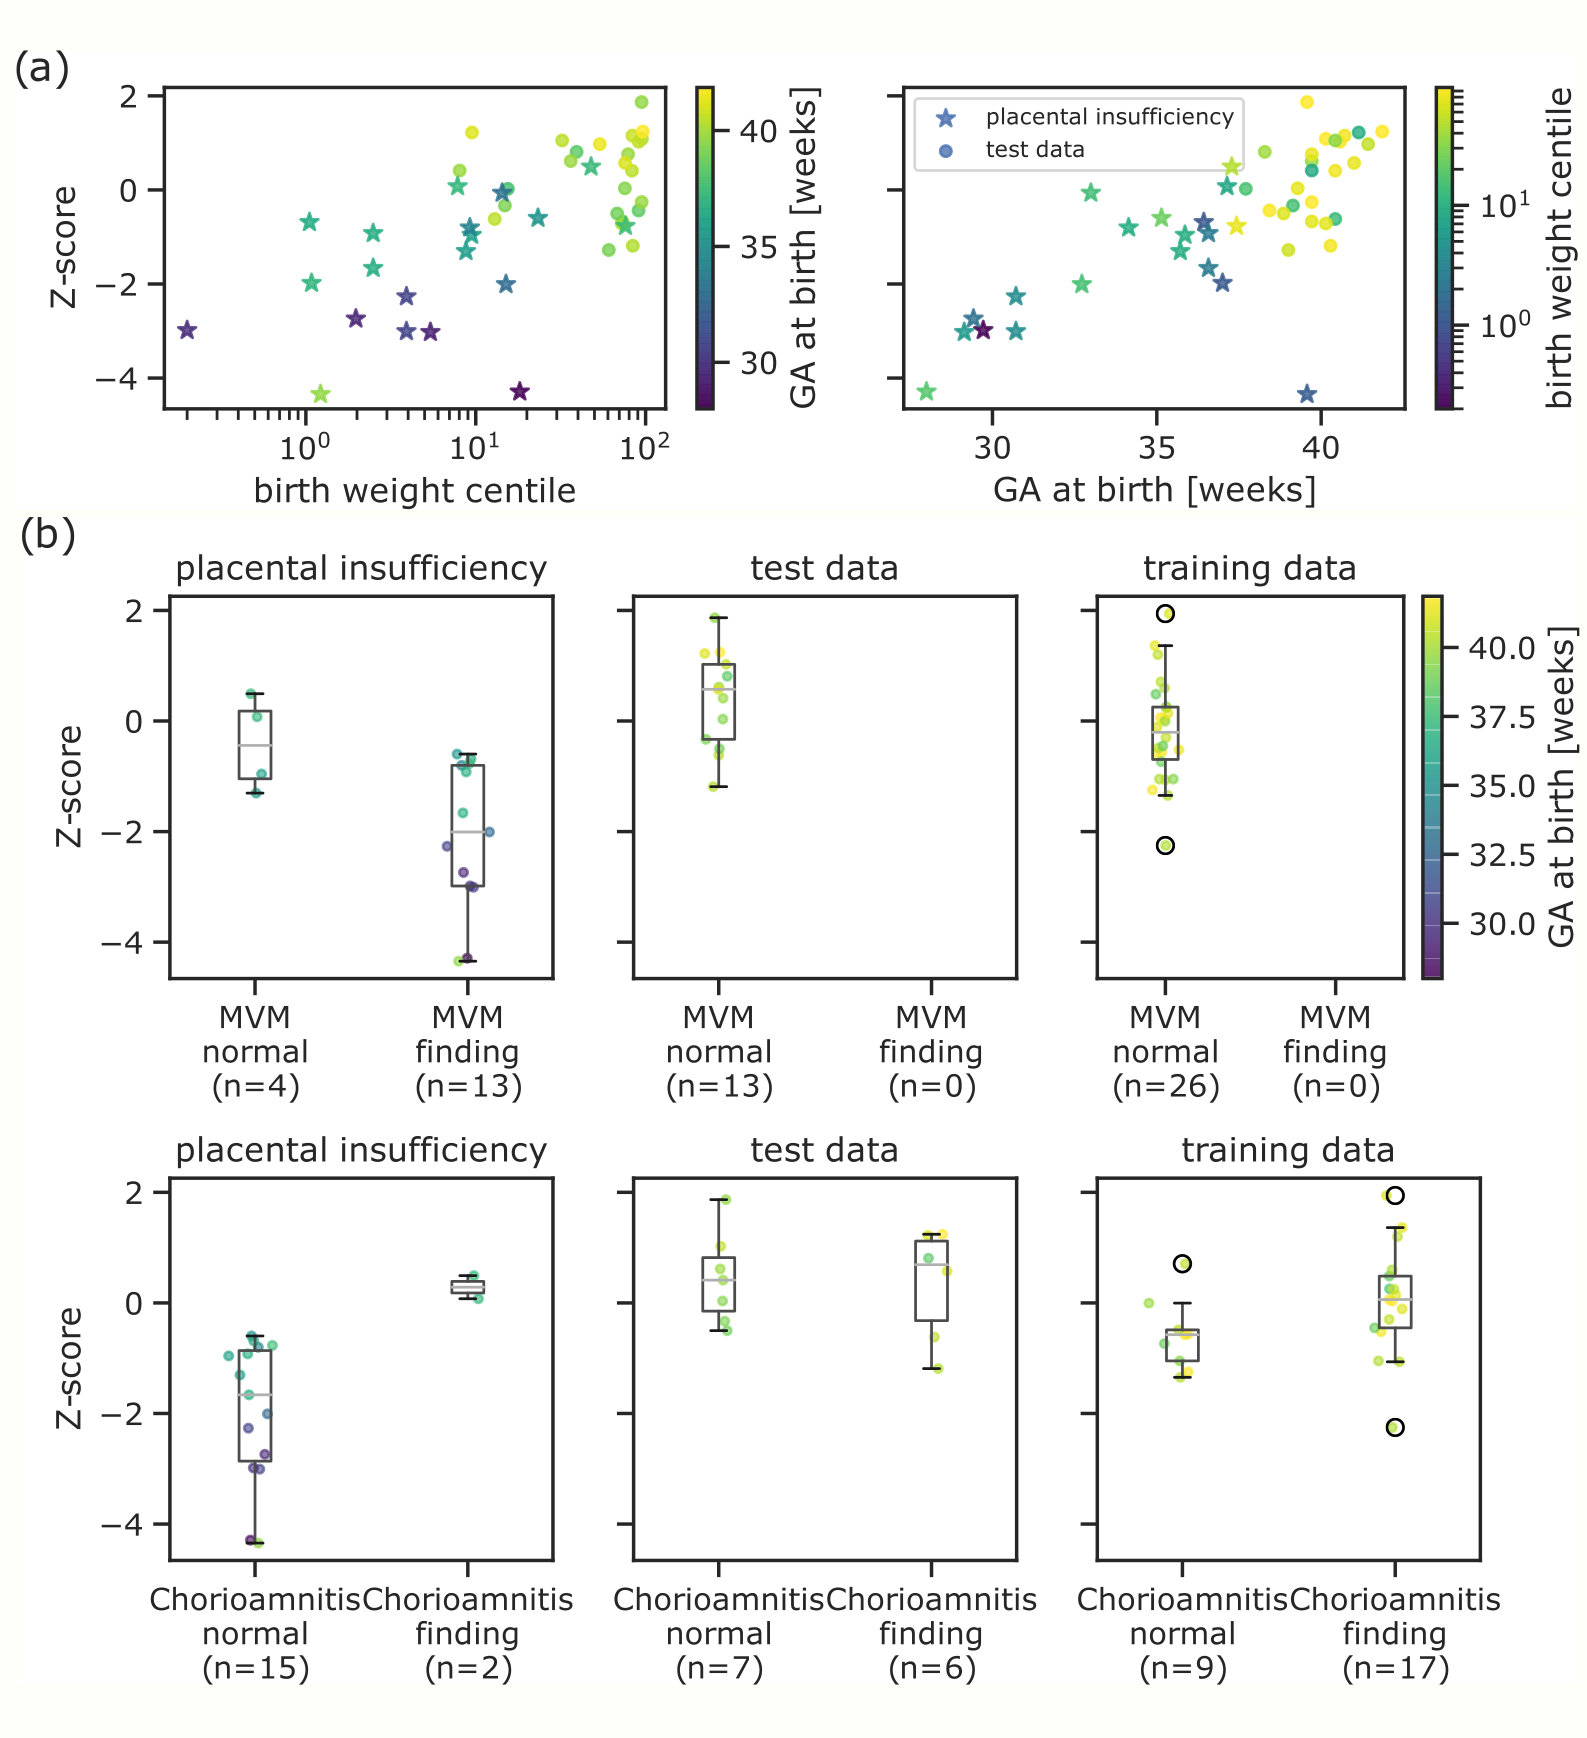
Automatic segmentation achieves comparable performance to human experts (DICE=0.76, PCC=0.986 for mean T2*). Examples and quantitative results in Figure 3. The GPR results in both training and test data lie in the normal cohort within the expected Z-score range $\pm3$. A positive linear trend between Z-scores and both GA and weight centile at birth can be observed (Figure 4). Large deviations are associated with either premature birth <28 weeks or birth weight centile <1st centile. In high-risk cases, lower Z-scores are associated with maternal vascular malperfusion, signs of chorioamnionitis coincide with normal Z-scores. The results from the 1.5T data illustrate the same pattern.Discussion and Conclusion
The presented automatic pipeline facilitates a fast, robust and reliable prediction of placental maturation based on a short MRI scan. It yields human-interpretable and verifiable intermediate results and quantifies uncertainties on the cohort-level and for individual predictions. The proposed machine-learning pipeline runs in close to real-time and, deployed in clinical settings, has the potential to become a cornerstone of diagnosis and intervention of placental insufficiency. Retrospective application on a different cohort imaged at 1.5T illustrates the ability for direct clinical translation.Acknowledgements
This work received funding from the NIH Human Placenta Project grant [1U01HD087202-01] European Research Council under the European Union’s Seventh Framework Programme [FP7/20072013]/ERC grant agreement no. [319456] (dHCP project), and was supported by the Wellcome EPSRC Centre for Medical Engineering at Kings College London [WT 203148/Z/16/Z], Wellcome Trust Sir Henry Wellcome Fellowship [201374/Z/16/Z], UKRI FLF [MR/T018119/1] and Open Science Enrichment award, MRC strategic grant [MR/K006355/1] and by the National Institute for Health Research (NIHR) Biomedical Research Centre based at Guy’s and St Thomas’ NHS Foundation Trust and King’s College London. The views expressed are those of the authors and not necessarily those of the NHS, the NIHR or the Department of Health. The authors thank all involved radiographers, research midwifes and participating mothers for their invaluable help.References
[Sorensen2020] Sørensen, A., Hutter, J., Seed, M., Grant, P.E., Gowland, P., 2020. T2*-weighted placental MRI: basic research tool or emerging clinical test for placental dysfunction? Ultrasound in Obstetrics and Gynecology 55, 293–302. doi:10.1002/uog.20855
[Benton2018] Benton, S.J., Leavey, K., Grynspan, D., Cox, B.J., Bainbridge, S.A., 2018. The clinical heterogeneity of preeclampsia is related to both placental gene expression and placental histopathology. American Journal of Obstetrics and Gynecology 219, 604.e1–604.e25. doi:10.1016/j.ajog.2018.09. 036
[Cole2018] Cole, J.H., Ritchie, S.J., Bastin, M.E., Valdes Hernandez, M.C., Munoz Maniega, S., Royle, N., Corley, J., Pattie, A., Harris, S.E., Zhang, Q., Wray, N.R., Redmond, P., Marioni, R.E., Starr, J.M., Cox, S.R., Wardlaw, J.M., Sharp, D.J., Deary, I.J., 2018. Brain age predicts mortality. Molecular Psychiatry 23, 1385–1392. doi:10.1038/mp.2017.62
[Rasmussen] Rasmussen, C.E., 2004. Gaussian Processes in machine learning. Lecture Notes in Computer Science (including subseries Lecture Notes in Artificial Intelligence and Lecture Notes in Bioinformatics) 3176, 63–71. doi:10.1007/978-3-540-28650-9_4
[Isensee2919] Isensee, F., Jager, P.F., Kohl, S.A.A., Petersen, J., Maier-Hein, K.H., 2019. ¨ Automated Design of Deep Learning Methods for Biomedical Image Segmentation. preprint arXiv:1904.08128
Figures