0709
Detecting abnormal placental microvascular flow based on flow-compensated and non-compensated intravoxel incoherent motion imaging
Yuhao Liao1, Taotao Sun2,3, Ling Jiang2,3, Zhiyong Zhao1, Tingting Liu1, Zhaoxia Qian2,3, Yi Sun4, Yi Zhang1, and Dan Wu1
1Key Laboratory for Biomedical Engineering of Ministry of Education, Department of Biomedical Engineering, College of Biomedical Engineering & Instrument Science, Zhejiang University, Hangzhou, China, 2Department of Radiology, International Peace Maternity and Child Health Hospital, School of Medicine, Shanghai Jiao Tong University, Shanghai, China, 3Shanghai Key Laboratory of Embryo Original Diseases, Shanghai, China, 4MR Collaboration, Siemens Healthcare China, Shanghai, China
1Key Laboratory for Biomedical Engineering of Ministry of Education, Department of Biomedical Engineering, College of Biomedical Engineering & Instrument Science, Zhejiang University, Hangzhou, China, 2Department of Radiology, International Peace Maternity and Child Health Hospital, School of Medicine, Shanghai Jiao Tong University, Shanghai, China, 3Shanghai Key Laboratory of Embryo Original Diseases, Shanghai, China, 4MR Collaboration, Siemens Healthcare China, Shanghai, China
Synopsis
Intravoxel Incoherent Motion (IVIM) imaging has been used to assess placental microcirculatory flow for prenatal examination. Here we proposed a joint analysis of flow-compensated (FC) and non-compensated (NC) diffusion MRI to estimate the fraction and velocity of ballistic microcirculatory flow, and evaluated the diagnostic performance of the new IVIM markers in maternal and fetal disorders. We found the flow velocity measurement from FC-NC joint model could differentiate patients with maternal hyperglycemia and fetal growth restriction compared to the controls, while the conventional IVIM parameters based on bi-exponential model using FC-only or NC-only data could not show the group difference.
Introduction
Placenta can influence or even determine the outcome of pregnancy, and its dysfunctions play a key factor in stillbirths, fetal growth restrictions, and preterm births1-3. Intravoxel Incoherent Motion (IVIM) imaging has been used to evaluate the microcirculatory blood flow in capillaries and small vessels of the placenta. However, conventional IVIM based on non-flow-compensated sequence and bi-exponential model include both the pseudo-diffusive flow and the ballistic flow (bulk blood flow)4,5. We previously proposed a joint model combining flow-compensated (FC) and non-compensated (NC) diffusion MRI to access the fraction and velocity of ballistic flow (fb and vb)6. Here, we further evaluated the diagnostic value of the new markers detect maternal and fetal disorders associated with the placenta, compared to the conventional IVIM parameters.Methods
Data acquisition: 46 pregnant women were included in this study under IRB approval, and the patients were diagnosed as maternal hyperglycemia (MH) (n = 15, GA 22-36 weeks), fetal growth restriction (FGR) (n = 12, GA 24-33 weeks) and normal control (n = 19, GA 21-34 weeks). The controls (Control1) were age-matched with MH group, as well as 15 of them (Control2) that age-matched with FGR group. Notably, here the FGR was diagnosed as biparietal diameter (BPD) of the fetal brain < 10 percentile of the normal level according to Doppler ultrasound.All MRI data were acquired on a 1.5T Siemens Aera scanner with an 18-channel body coil. We used a house-made diffusion sequence with the FC and NC gradients6 with the following parameters: diffusion time = 15 ms, 6 diffusion directions, b-values = 0, 10, 20, 50, 100, 150, 200, 300, 400, and 600 s/mm2, 10 slices with a slice thickness = 6 mm, field of view = 350 × 350 mm2, in-plane resolution = 2.73 × 2.73 mm2. The acquisition time was 2.5 mins for FC or NC scan. Diagrams of the FC and NC diffusion-encoding gradients is showed in Figure 1A-B.
Data analysis: We performed iterative registration between diffusion-weighted images (DWIs) for motion correction6. We then performed a joint analysis of FC and NC signals based on Equations (1) and (2), to obtain fb and vb using a nonlinear least-square curve fitting in MATLAB.
NC gradients:$$\begin{equation}\frac{S}{S_{0}}=(1-f_{b})e^{-bD_{t}}+f_{b}e^{-bD_{b}}e^{-\alpha^{2}\nu_b^2}\tag{1}\end{equation}$$
FC gradients:$$\begin{equation}\frac{S}{S_{0}}=(1-f_{b})e^{-bD_{t}}+f_{b}e^{-bD_{b}}\tag{2}\end{equation}$$
where S0 and S are signal intensities of the b0 and DWIs; Dt and Db are the diffusivities of water molecules in the tissue and blood (Db set at 1.5 μm2/ms); $$$\alpha$$$ is the first-order moment of the diffusion-encoding gradient. Conventional IVIM analysis was also performed to obtain perfusion fraction and diffusivities of the tissue and blood components from the FC (fFC, DFC, D*FC) and NC data (fNC, DNC, D*NC).
Statistical analysis: We manually delineated the whole placenta and further separated it into maternal and fetal regions-of-interest (ROIs) (Figure 1C). The ROI-averaged IVIM parameters were compared between MH and Control1, as well as FGR and Control2. Then, we used a linear support vector machines (SVM) to classify the MH, FGR and controls. The significance levels were set to be *P < 0.05 and **P < 0.01.
Results
The fitted fb and vb maps from the FC-NC model were showed in figure 1D-F. It is evident that the MH and FGR patients showed lower vb values than the control, while vb did not show clear difference. Figure 2 shows group comparison between MH, FGR and control groups, for each of the 9 IVIM parameters obtained in the whole-placenta. vb showed significantly lower values in both MH and FGR compared with their control groups, while other parameters could not detect the group differences. No group differences were found for the Doppler ultrasound-based placenta flow measurements-the pulsation index (PI) and systolic/diastolic ratio (SD) of the umbilical cord.We also examined the fetal and maternal sides of the placenta separately in table 1 and 2. vb in whole placenta and in the fetal side was significantly lower than control, respectively.
The classification results demonstrated that the vb had the highest diagnostic accuracy of 70.6% in differentiating MH and Control1 and 63% in separating FGR and Control2 (Figure 3A). We also examined the combination of different parameters, and only the combination of fb and vb showed highest performance, with an accuracy of 73.5% in classifying MH and 66.7% in classifying FGR. The exact classification results in the two-dimensional space of fb - vb were shown in Figure 3B-C.
Discussion
In this work, we used a joint FC-NC model to the fraction and velocity of the ballistic flow in the placenta, and investigated whether the proposed markers can be used to detect maternal and fetal disorders7,8,9. We found that the joint model improved the diagnostic performance in detecting MH and FGR compared to the conventional IVIM model. Particularly, 1) vb was significant reduced in both the whole-placenta and fetal side of placenta in both MH and FGR, while the other IVIM parameters could not tell the group difference; and 2) the combination of vb and fb showed a higher classification accuracy than the other IVIM parameters.Conclusion
In summary, the results revealed that the joint FC-NC model may be useful for prenatal MRI examinations, although larger sample size was needed for further validation.Acknowledgements
This work is supported by the Ministry of Science and Technology of the People’s Republic of China (2018YFE0114600), National Natural Science Foundation of China (61801424 and 81971606).References
- Ananth CV, Friedman AM. Ischemic placental disease and risks of perinatal mortality and morbidity and neurodevelopmental outcomes. Semin Perinatol 2014;38(3):151-158.
- Ptacek I, Sebire NJ, Man JA, Brownbill P, Heazell AE. Systematic review of placental pathology reported in association with stillbirth. Placenta 2014;35(8):552-562.
- Apel-Sarid L, Levy A, Holcberg G, Sheiner E. Term and preterm (<34 and <37 weeks gestation) placental pathologies associated with fetal growth restriction. Arch Gynecol Obstet 2010;282(5):487-492.
- Le Bihan D, Breton E, Lallemand D, Aubin ML, Vignaud J, Laval-Jeantet M. Separation of diffusion and perfusion in intravoxel incoherent motion MR imaging. Radiology 1988;168(2):497-505.
- Ahlgren A, Knutsson L, Wirestam R, Nilsson M, Stahlberg F, Topgaard D, Lasic S. Quantification of microcirculatory parameters by joint analysis of flow-compensated and non-flow-compensated intravoxel incoherent motion (IVIM) data. NMR Biomed 2016;29(5):640-649.
- Jiang L, Sun T, Liao Y, Sun Y, Qian Z, Zhang Y, Wu D. Probing the ballistic microcirculation in placenta using flow-compensated and non-compensated intravoxel incoherent motion imaging. Magn Reson Med 2021;85(1):404-412.
- Derwig I, Lythgoe DJ, Barker GJ, Poon L, Gowland P, Yeung R, Zelaya F, Nicolaides K. Association of placental perfusion, as assessed by magnetic resonance imaging and uterine artery Doppler ultrasound, and its relationship to pregnancy outcome. Placenta 2013;34(10):885-891.
- Shi H, Quan X, Liang W, Li X, Ai B, Liu H. Evaluation of Placental Perfusion Based on Intravoxel Incoherent Motion Diffusion Weighted Imaging (IVIM-DWI) and Its Predictive Value for Late-Onset Fetal Growth Restriction. Geburtshilfe Frauenheilkd 2019;79(4):396-401.
- Moore RJ, Strachan BK, Tyler DJ, Duncan KR, Baker PN,
Worthington BS, Johnson IR, Gowland PA. In utero perfusing fraction maps in
normal and growth restricted pregnancy measured using IVIM echo-planar MRI.
Placenta 2000;21(7):726-732.
Figures
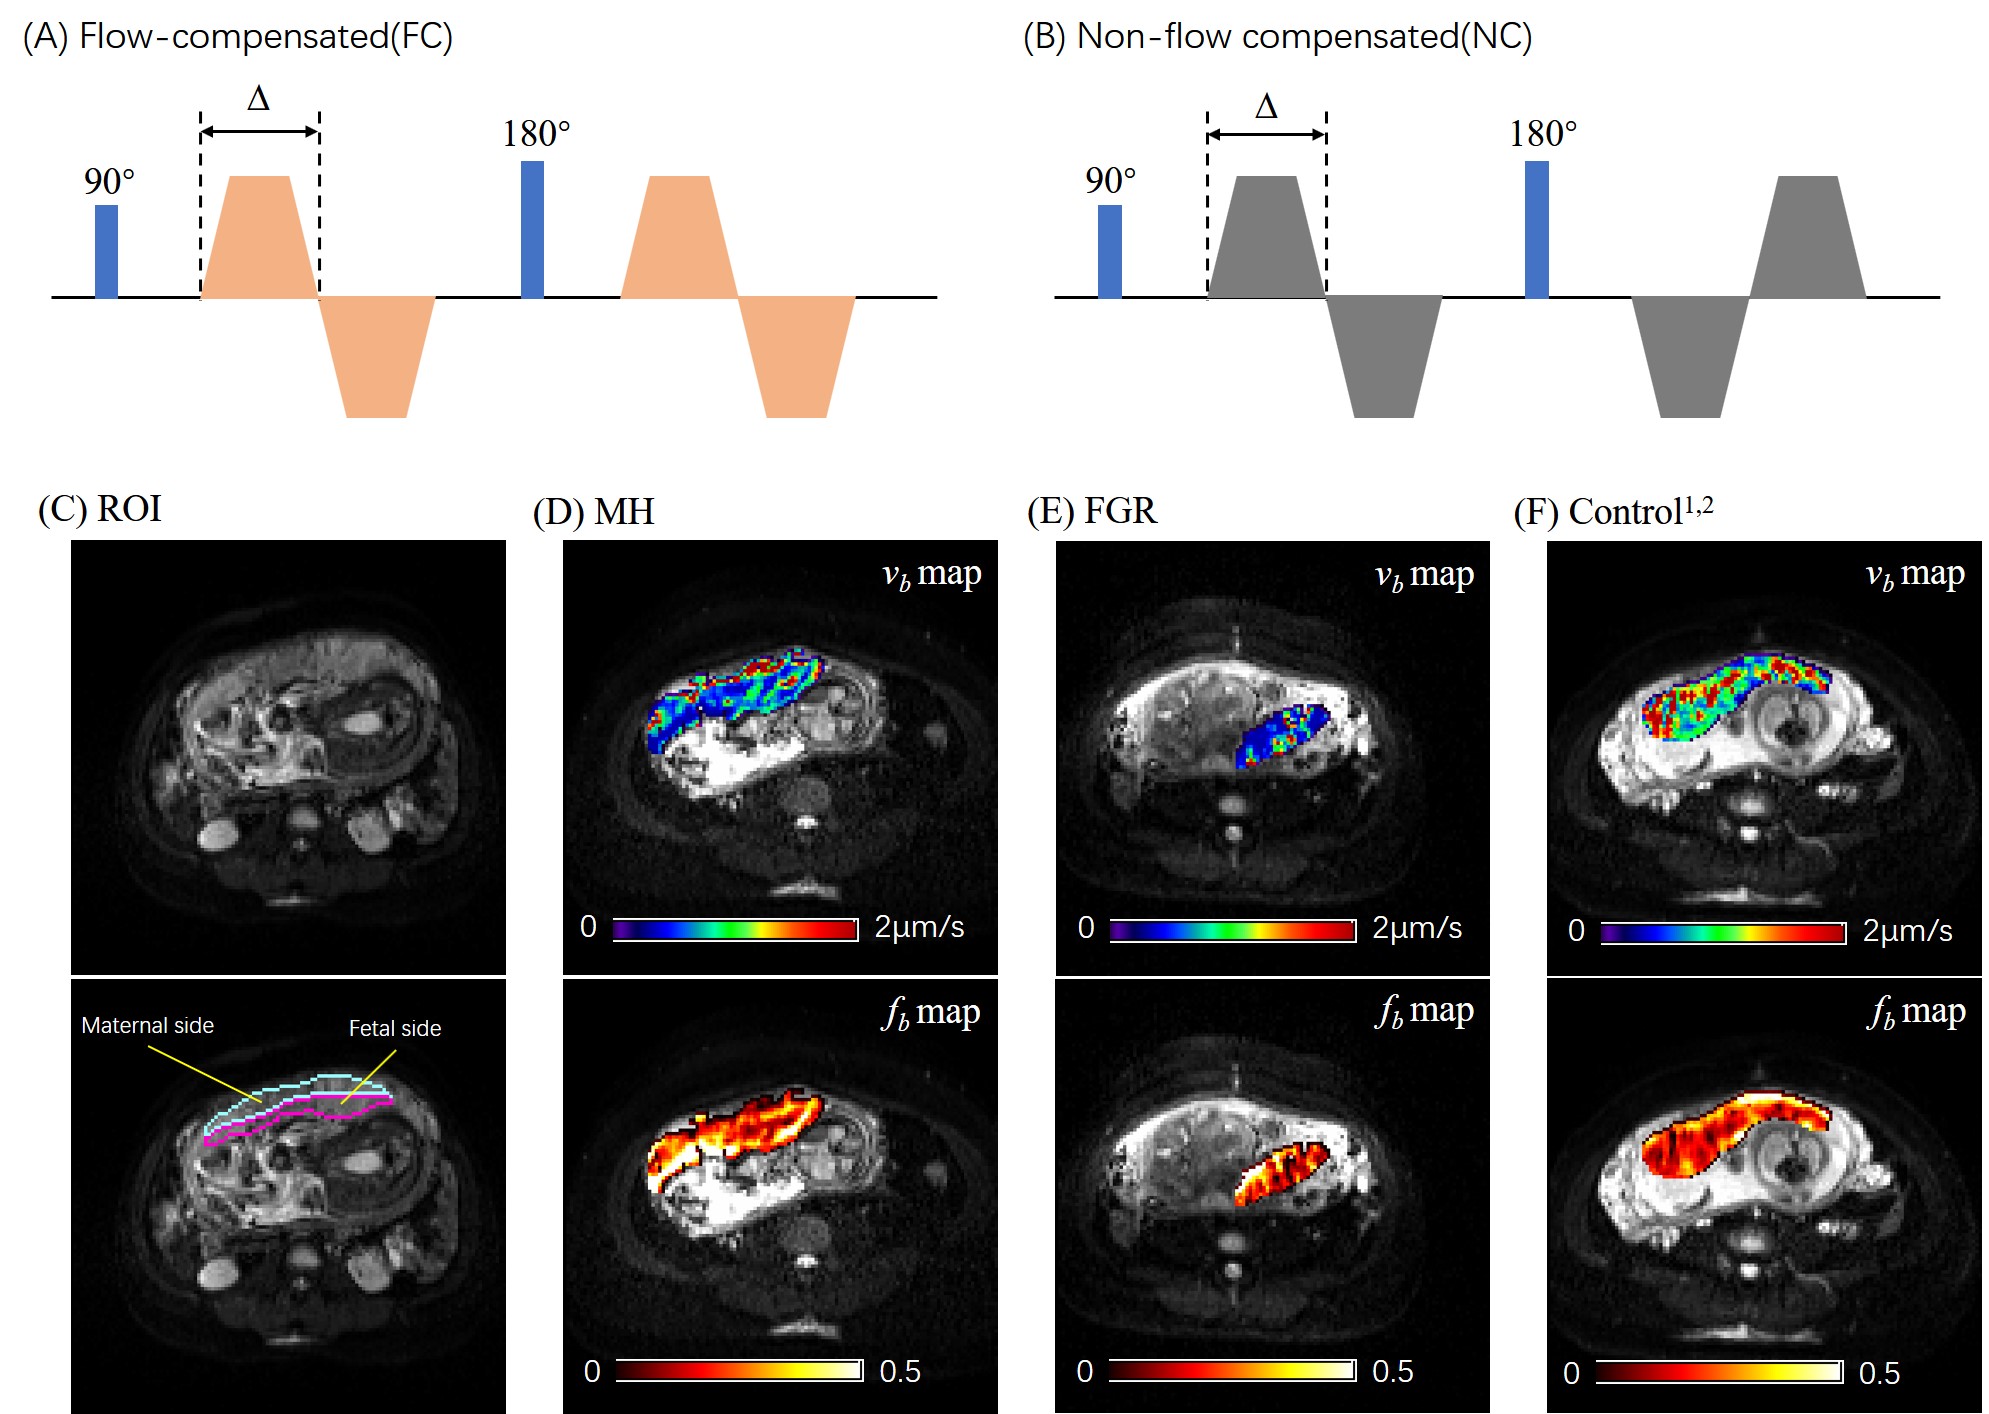
Figure 1. (A-B) Diagrams of the FC and
NC diffusion-encoding gradients with a diffusion duration of ∆. (C) Definition
of the maternal and fetal ROIs of the placenta overlaid on the b0 image. (D-F)
Representative fb and vb maps of the placenta from
a maternal hyperglycemia (MH) patient (D), a fetal growth restriction (FGR)
patient (E), and a normal control (F).
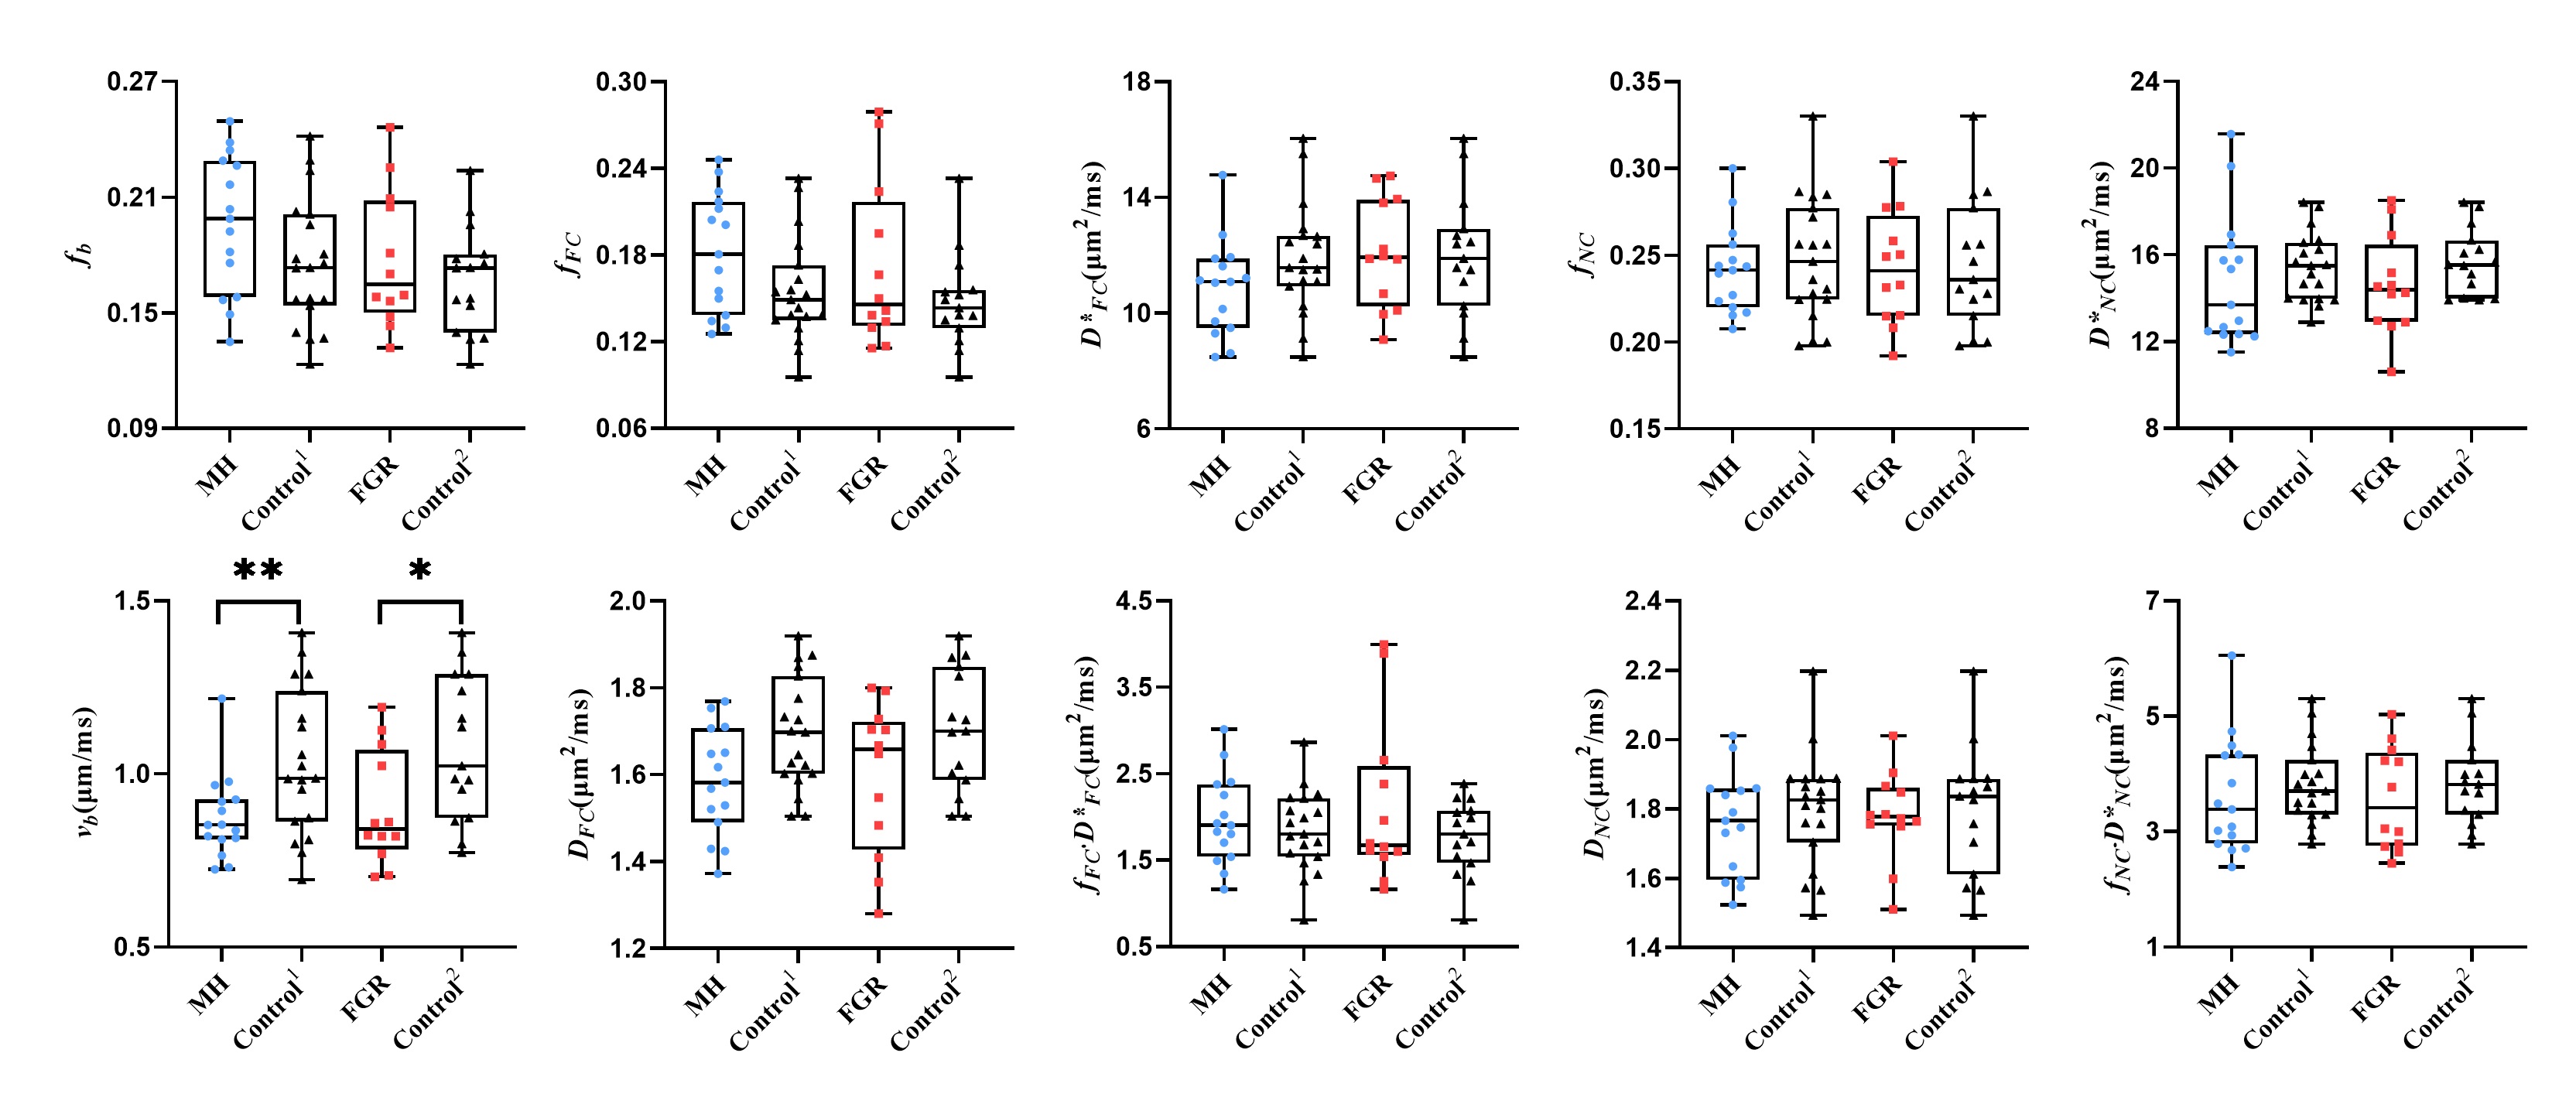
Figure 2.
Group
comparison of the IVIM parameters between MH and Control1 and
between FGR and Control2, including vb and fb
from the FC-NC model, fFC, D*FC,
and fFC·D*FC
from the FC-only data, and fNC,
D*NC, and fNC·D*NC
from NC-only data in whole-placenta.
Blue circle and red square represent samples from MH and FGR groups,
respectively. Control
1 and
2 represent the control group matched the MH and FGR, respectively. *P<0.05; **P<0.01.
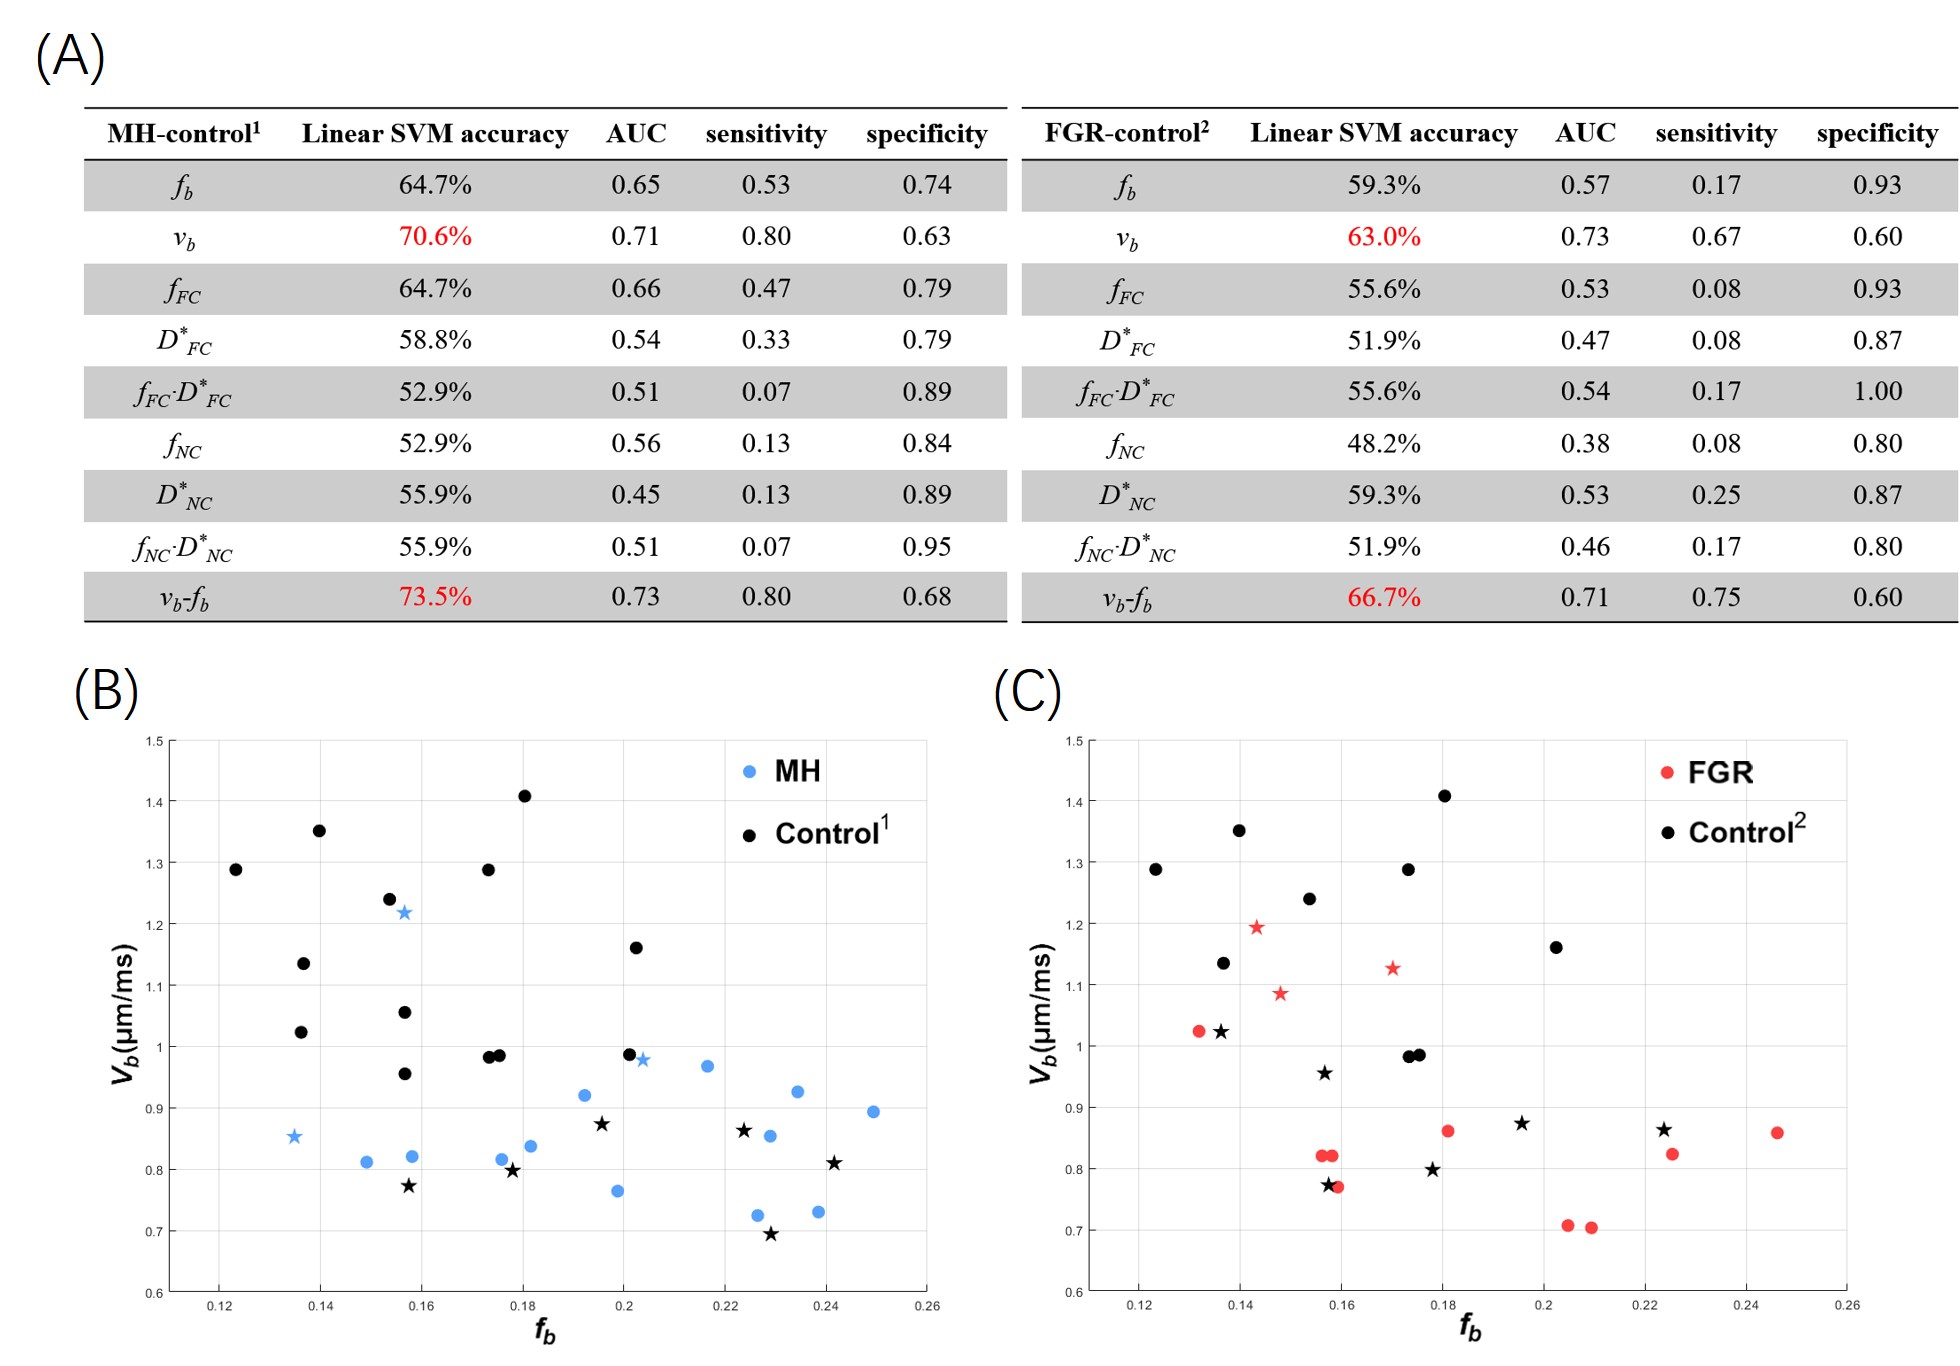
Figure 3. (A) The classification accuracy, AUC, sensitivity, and specificity of each
IVIM parameter and their combinations (as features in classification), based on
a linear SVM with five-fold cross validation. The combination of fb and vb from NC-FC model showed the best performance. (B-C) The
classification between MH and Control1 (B) and between FGR and
Control2 (C) in the two-dimensional feature space of vb-fb. The dots represent correctly identified cases, and
stars represented mis-classified cases by SVM.
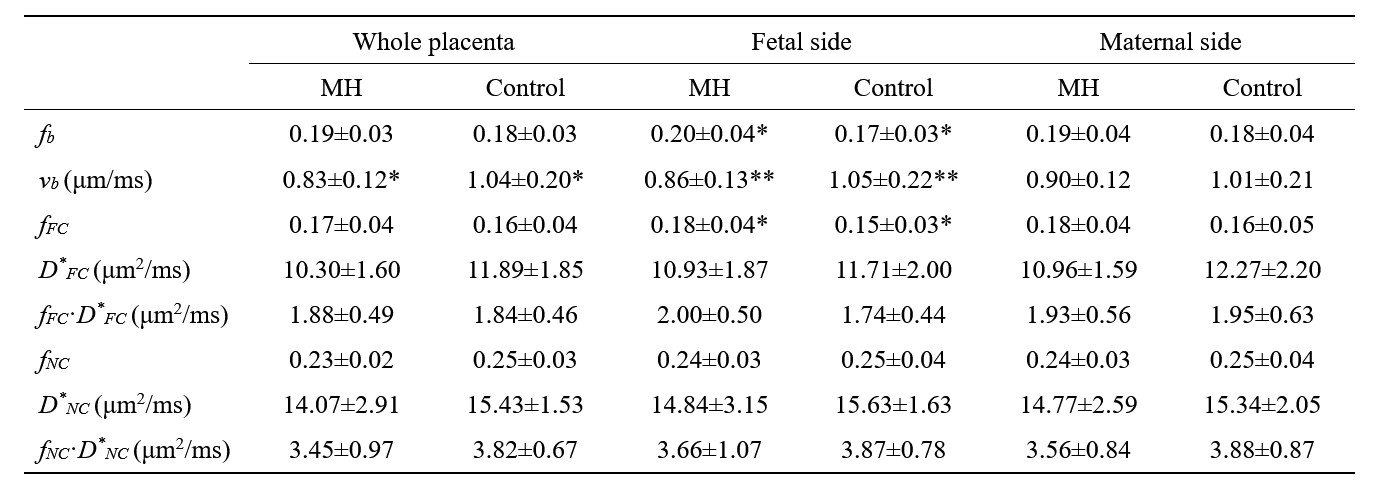
Table 1. Comparisons of
the IVIM parameters in the whole-placenta, fetal side, and maternal side of
placenta between maternal hyperglycemia (MH) and Control1 groups. All values are
expressed as means ± standard deviations. *P<0.05;
**P<0.01 by two-sample t-test after
regressing gestational age (GA). fb, vb and fFC values in the fetal side of placenta showed the
significant differences compared with Control1, while none of
parameters showed difference in the maternal side.
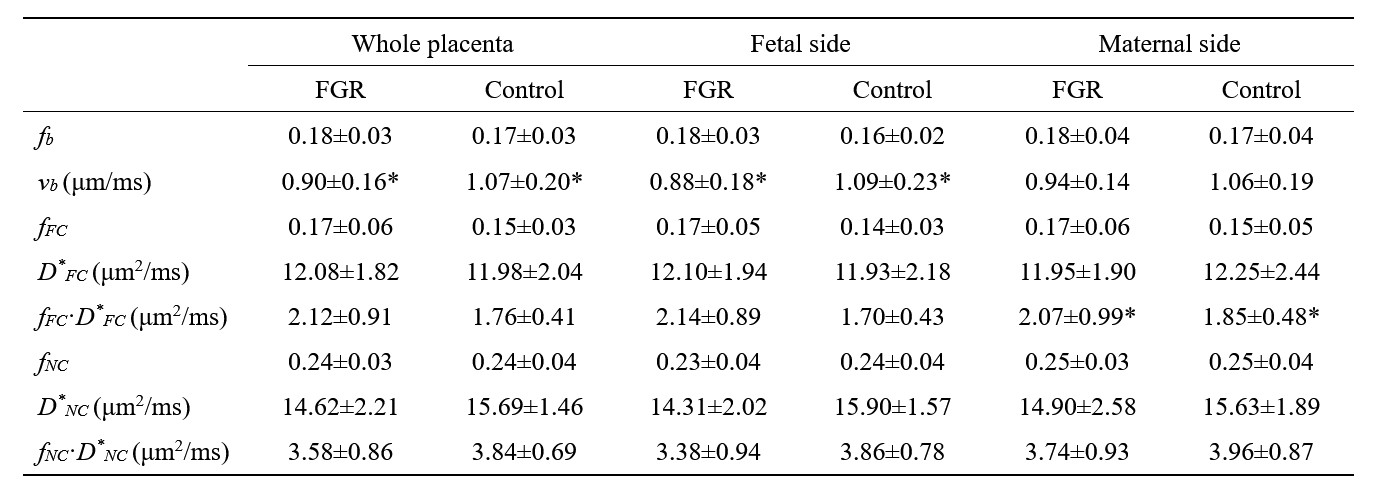
Table 2. Comparisons of the IVIM
parameters in the whole-placenta, fetal side, and maternal side of placenta between
fetal growth restriction (FGR) and Control2 groups.
All values are expressed as means ± standard deviations. *P<0.05 by
two-sample t-test after regressing gestational age (GA).
vb in
fetal side was significantly lower than Control2 and fFC·D*FC in the
maternal side was significantly higher.