0708
Velocity-Selective Arterial Spin Labeling Perfusion Measurements in 2nd Trimester Human Placenta with Varying BMI1Medical Physics, University of Wisconsin-Madison, Madison, WI, United States, 2GE Global Research, Niskayuna, NY, United States, 3Obstetrics and Gynecology, University of Wisconsin-Madison, Madison, WI, United States, 4Radiology, University of Wisconsin-Madison, Madison, WI, United States, 5Biomedical Engineering, University of Madison-Wisconsin, Madison, WI, United States
Synopsis
Proper placental development is crucial to fetal health. To the best of our knowledge, we report the earliest measurement of perfusion in the human placenta using velocity-selective arterial spin labeling (VS-ASL) MRI. Patients were scanned at 14- and 20-weeks gestation (term is 40 weeks) and clinical data was collected. Regression analysis shows no evidence for an increase in placental perfusion with gestational age, but strong evidence of an increase in perfusion with patient body mass index (BMI).
Introduction
Placental health plays a critical role during pregnancy and in the long-term health of the child.1 Maternal obesity is increasingly prevalent and is associated with increased risk of hypertensive disorder/pre-eclampsia2,3 and stillbirth.4 The mechanisms in which obesity affects fetal outcomes are poorly understood. Perfusion MRI using arterial spin labeling (ASL) has recently emerged as a promising method for noninvasive placental assessment and has been used to characterize pregnancy factors such as low birth weight and fetal heart disease.5–8 In this study, we utilize ASL to assess the relationship between maternal body mass index (BMI) and placental perfusion. Specifically, we use a 2D multi-slice velocity selective (VS)-ASL approach9 which aims to mitigate the effects of the long transit times of placenta blood supply.10Methods
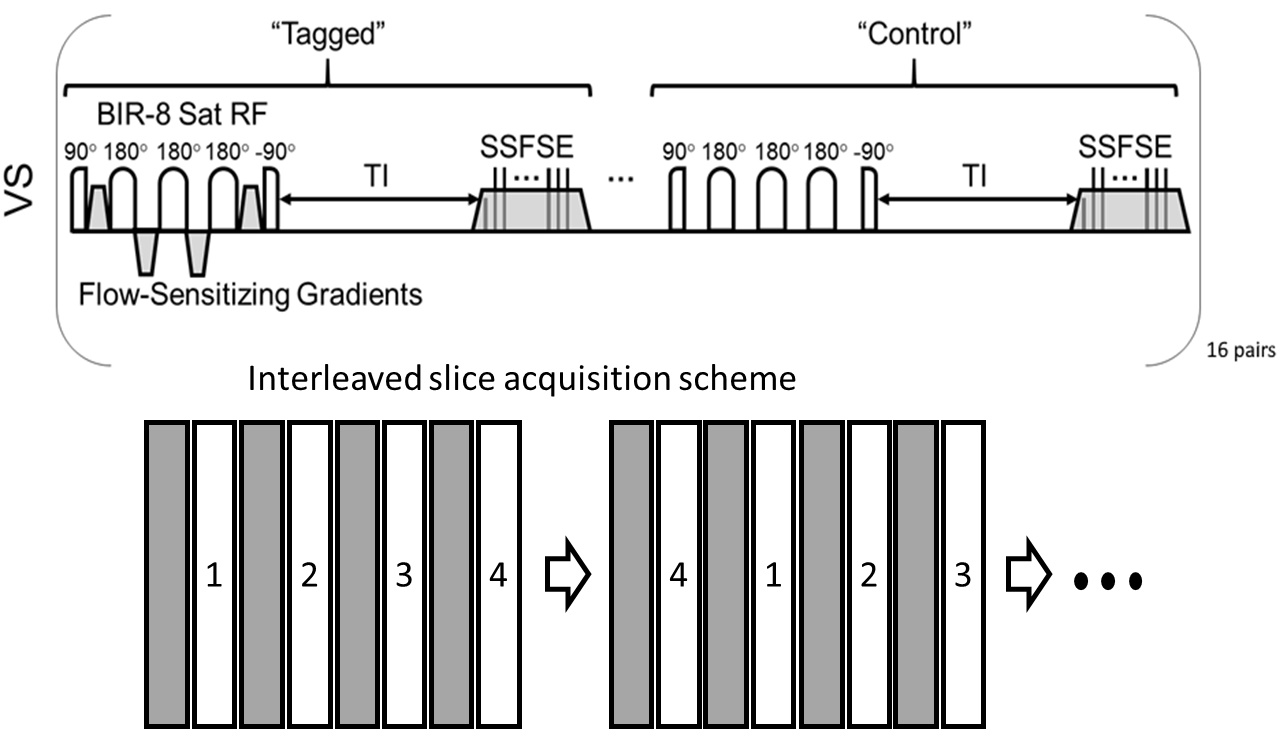
Subjects: A total of 104 pregnant patients (age=29.7±3.5 yrs) were recruited. Clinical data such as BMI, blood pressure, and eventually pregnancy outcomes were tracked. Patients received MRI scans at gestational age (GA) 14- and 20- weeks. After quality assurance and excluding patients only scanned once, a total of 74 patients (age=30.0±2.8 yrs) had useable perfusion data from VSASL scans at both weeks. Of those, 71 patients had BMI recorded at the GA 20 weeks visit.Imaging: MRI was performed on a clinical 1.5T scanner (Optima MR540W, GE Healthcare, Waukesha, WI) with a 48-channel phased array torso coil. Participants were imaged in a supine position. The pulse sequence diagram for the VS-ASL perfusion sequence is shown in Figure 1. Two interleaved acquisitions of four 8 mm sagittal slices each with 16 tag/control pairs using a 2D single-shot fast spin echo (SSFSE) readout were used for full placenta coverage. The acquisition order of the four slices was permuted after each tag/control pair to avoid post label delay bias. Scans used repetition time (TR)=6-7 sec, echo time (TE)=50.1 msec, matrix size=128×64, in-plane spatial resolution=3.28×6.56 mm2 and total scan time of ~7 min 48 sec. VS-ASL imaging9 was performed with a 1.2 sec post label delay, symmetric BIR-8 RF pulses11, a velocity cutoff of Vc=2.4 cm/sec, R/L encoding, and background suppression pulses.
Processing: To calculate placental perfusion, acquired ASL tagged and control images (16 pairs) were averaged and subtracted to create an ASL difference image (∆M). Placental blood perfusion (f, mL/100g/min) was then quantified using Buxton’s general kinetic model.12 The resulting eight images for each case were segmented using an in-house tool that allowed side-by-side comparison of the reference and perfusion data.13 Mean, median, and standard deviation of perfusion in the placenta was recorded.
Statistics: Linear regression was performed to analyze the response of median perfusion to several predictors, including maternal blood pressure, fetal weight, maternal BMI, and placental volume. A paired t-test was used to evaluate change in median perfusion with gestation age. A Wilcoxon rank-sum test was used to compare the distributions of median perfusion between controls and obese subjects at 14 and 20 weeks.
Results
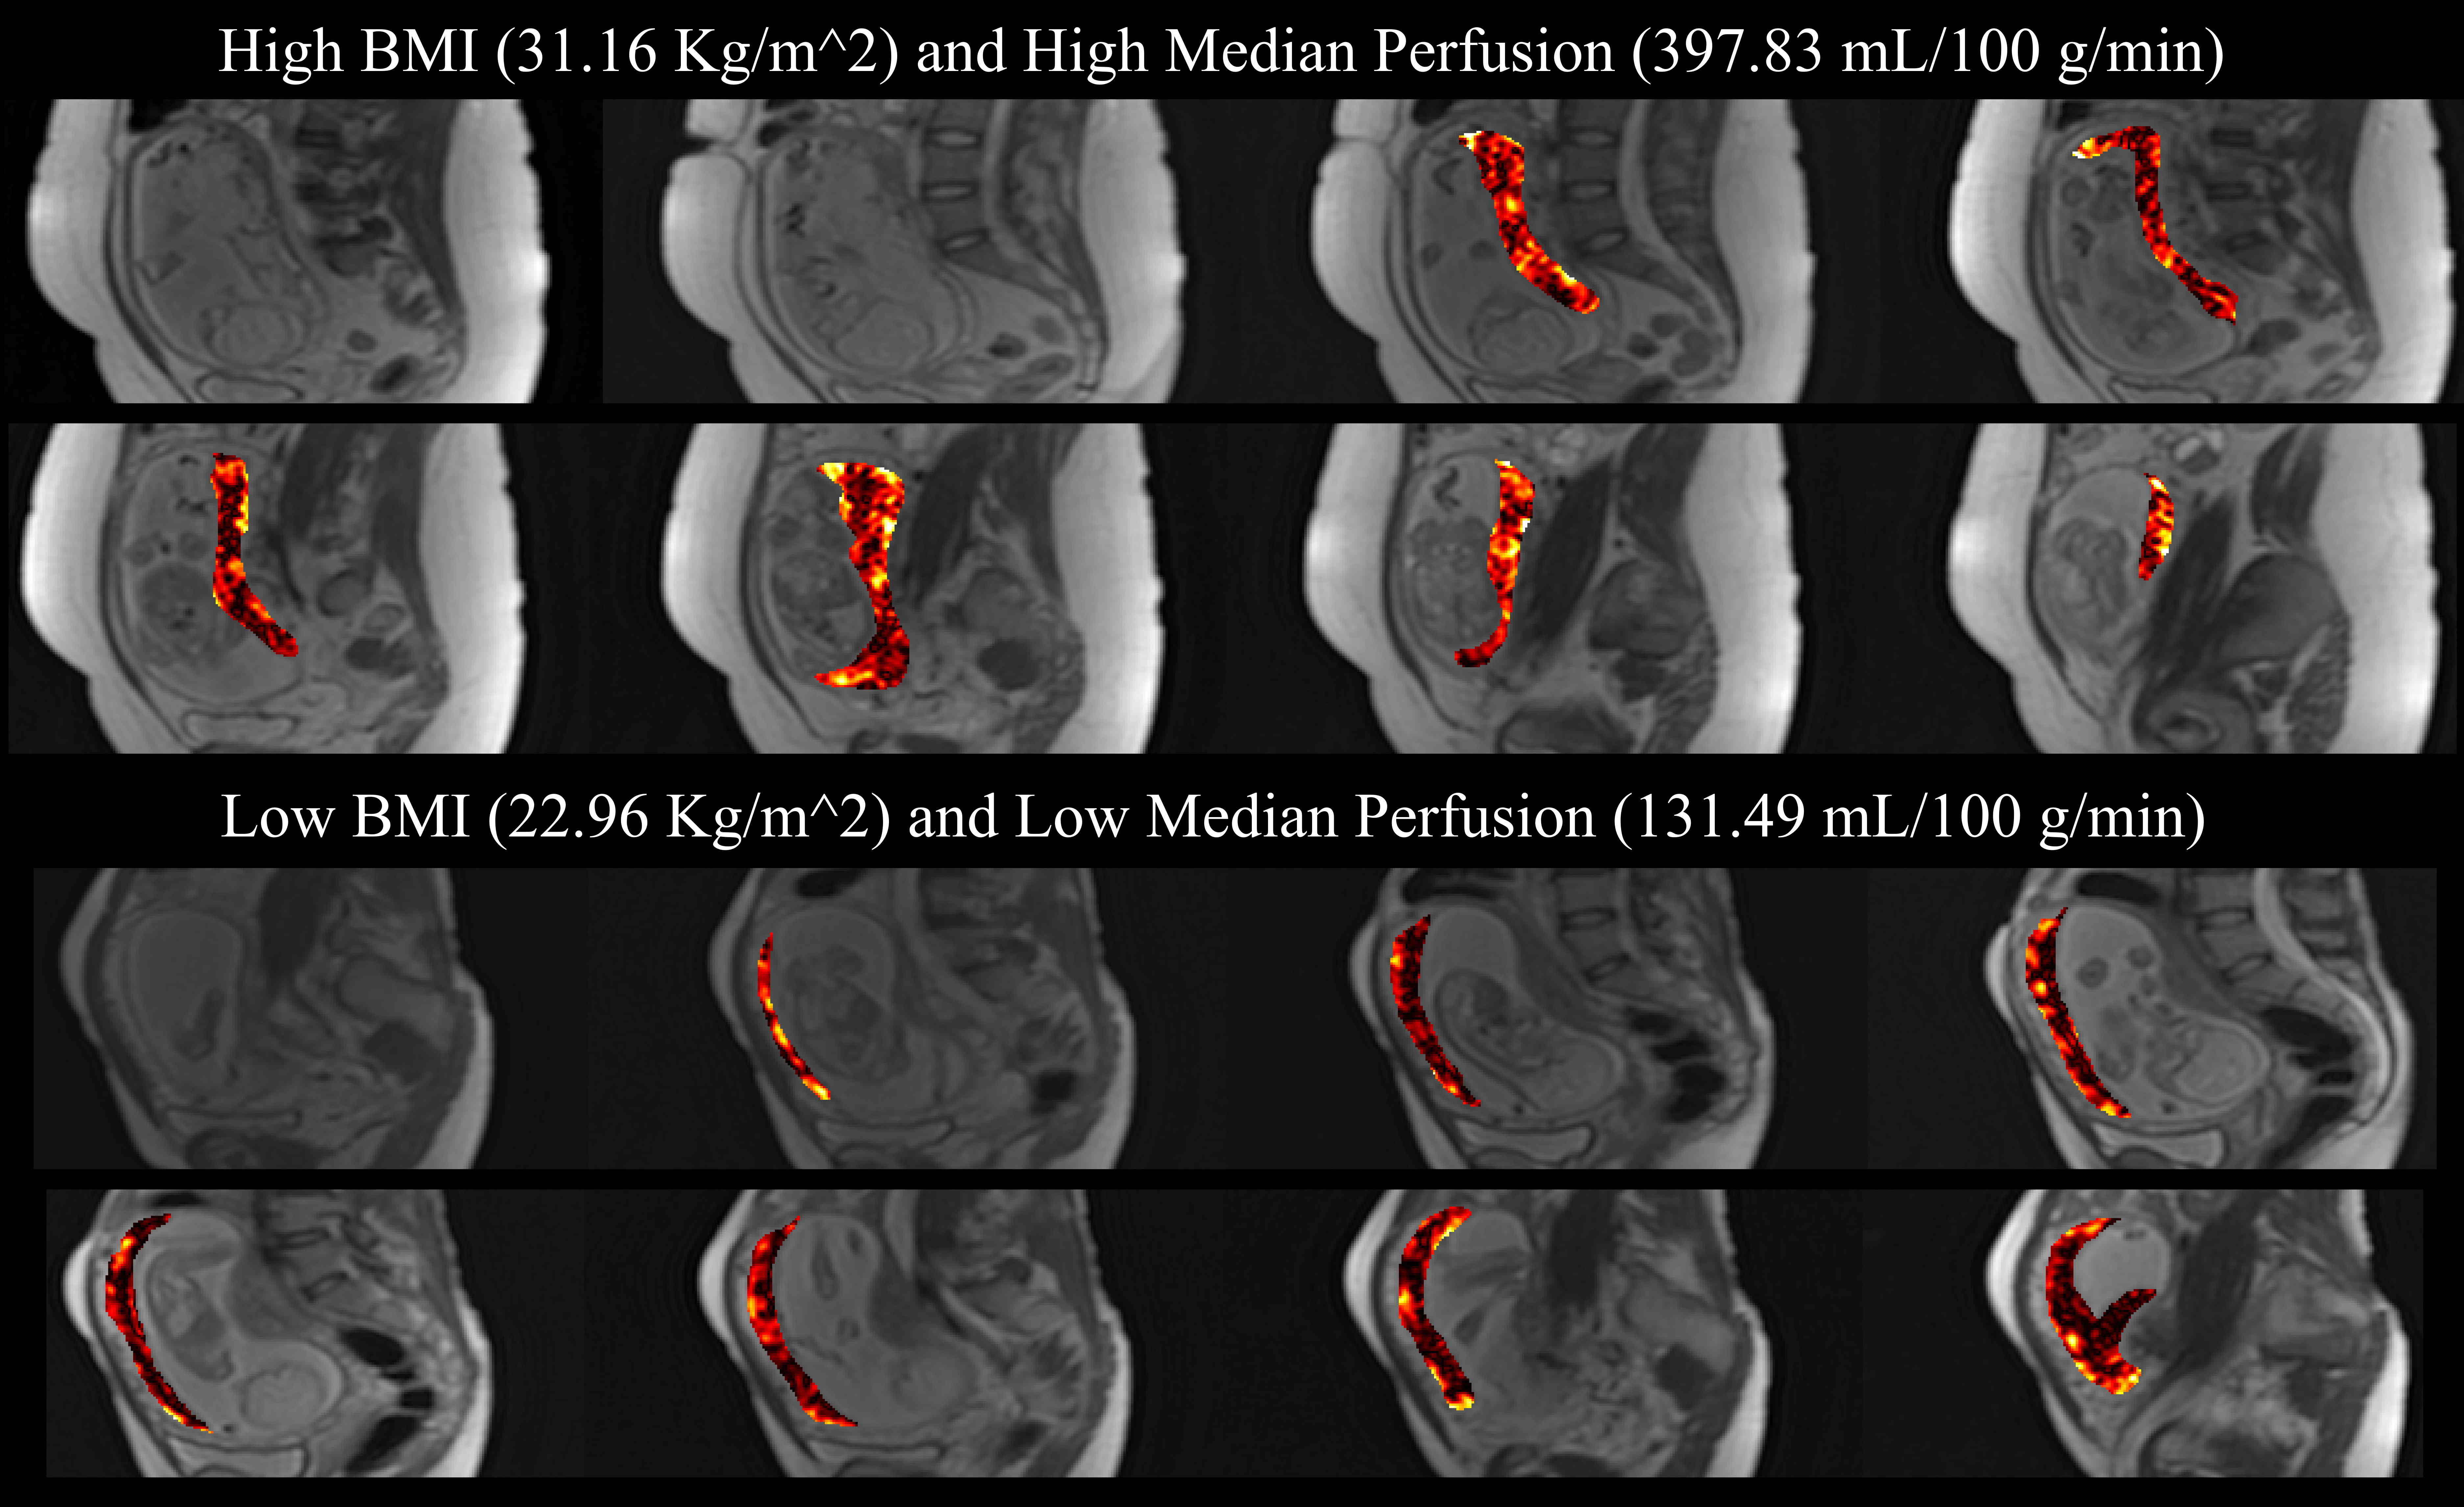
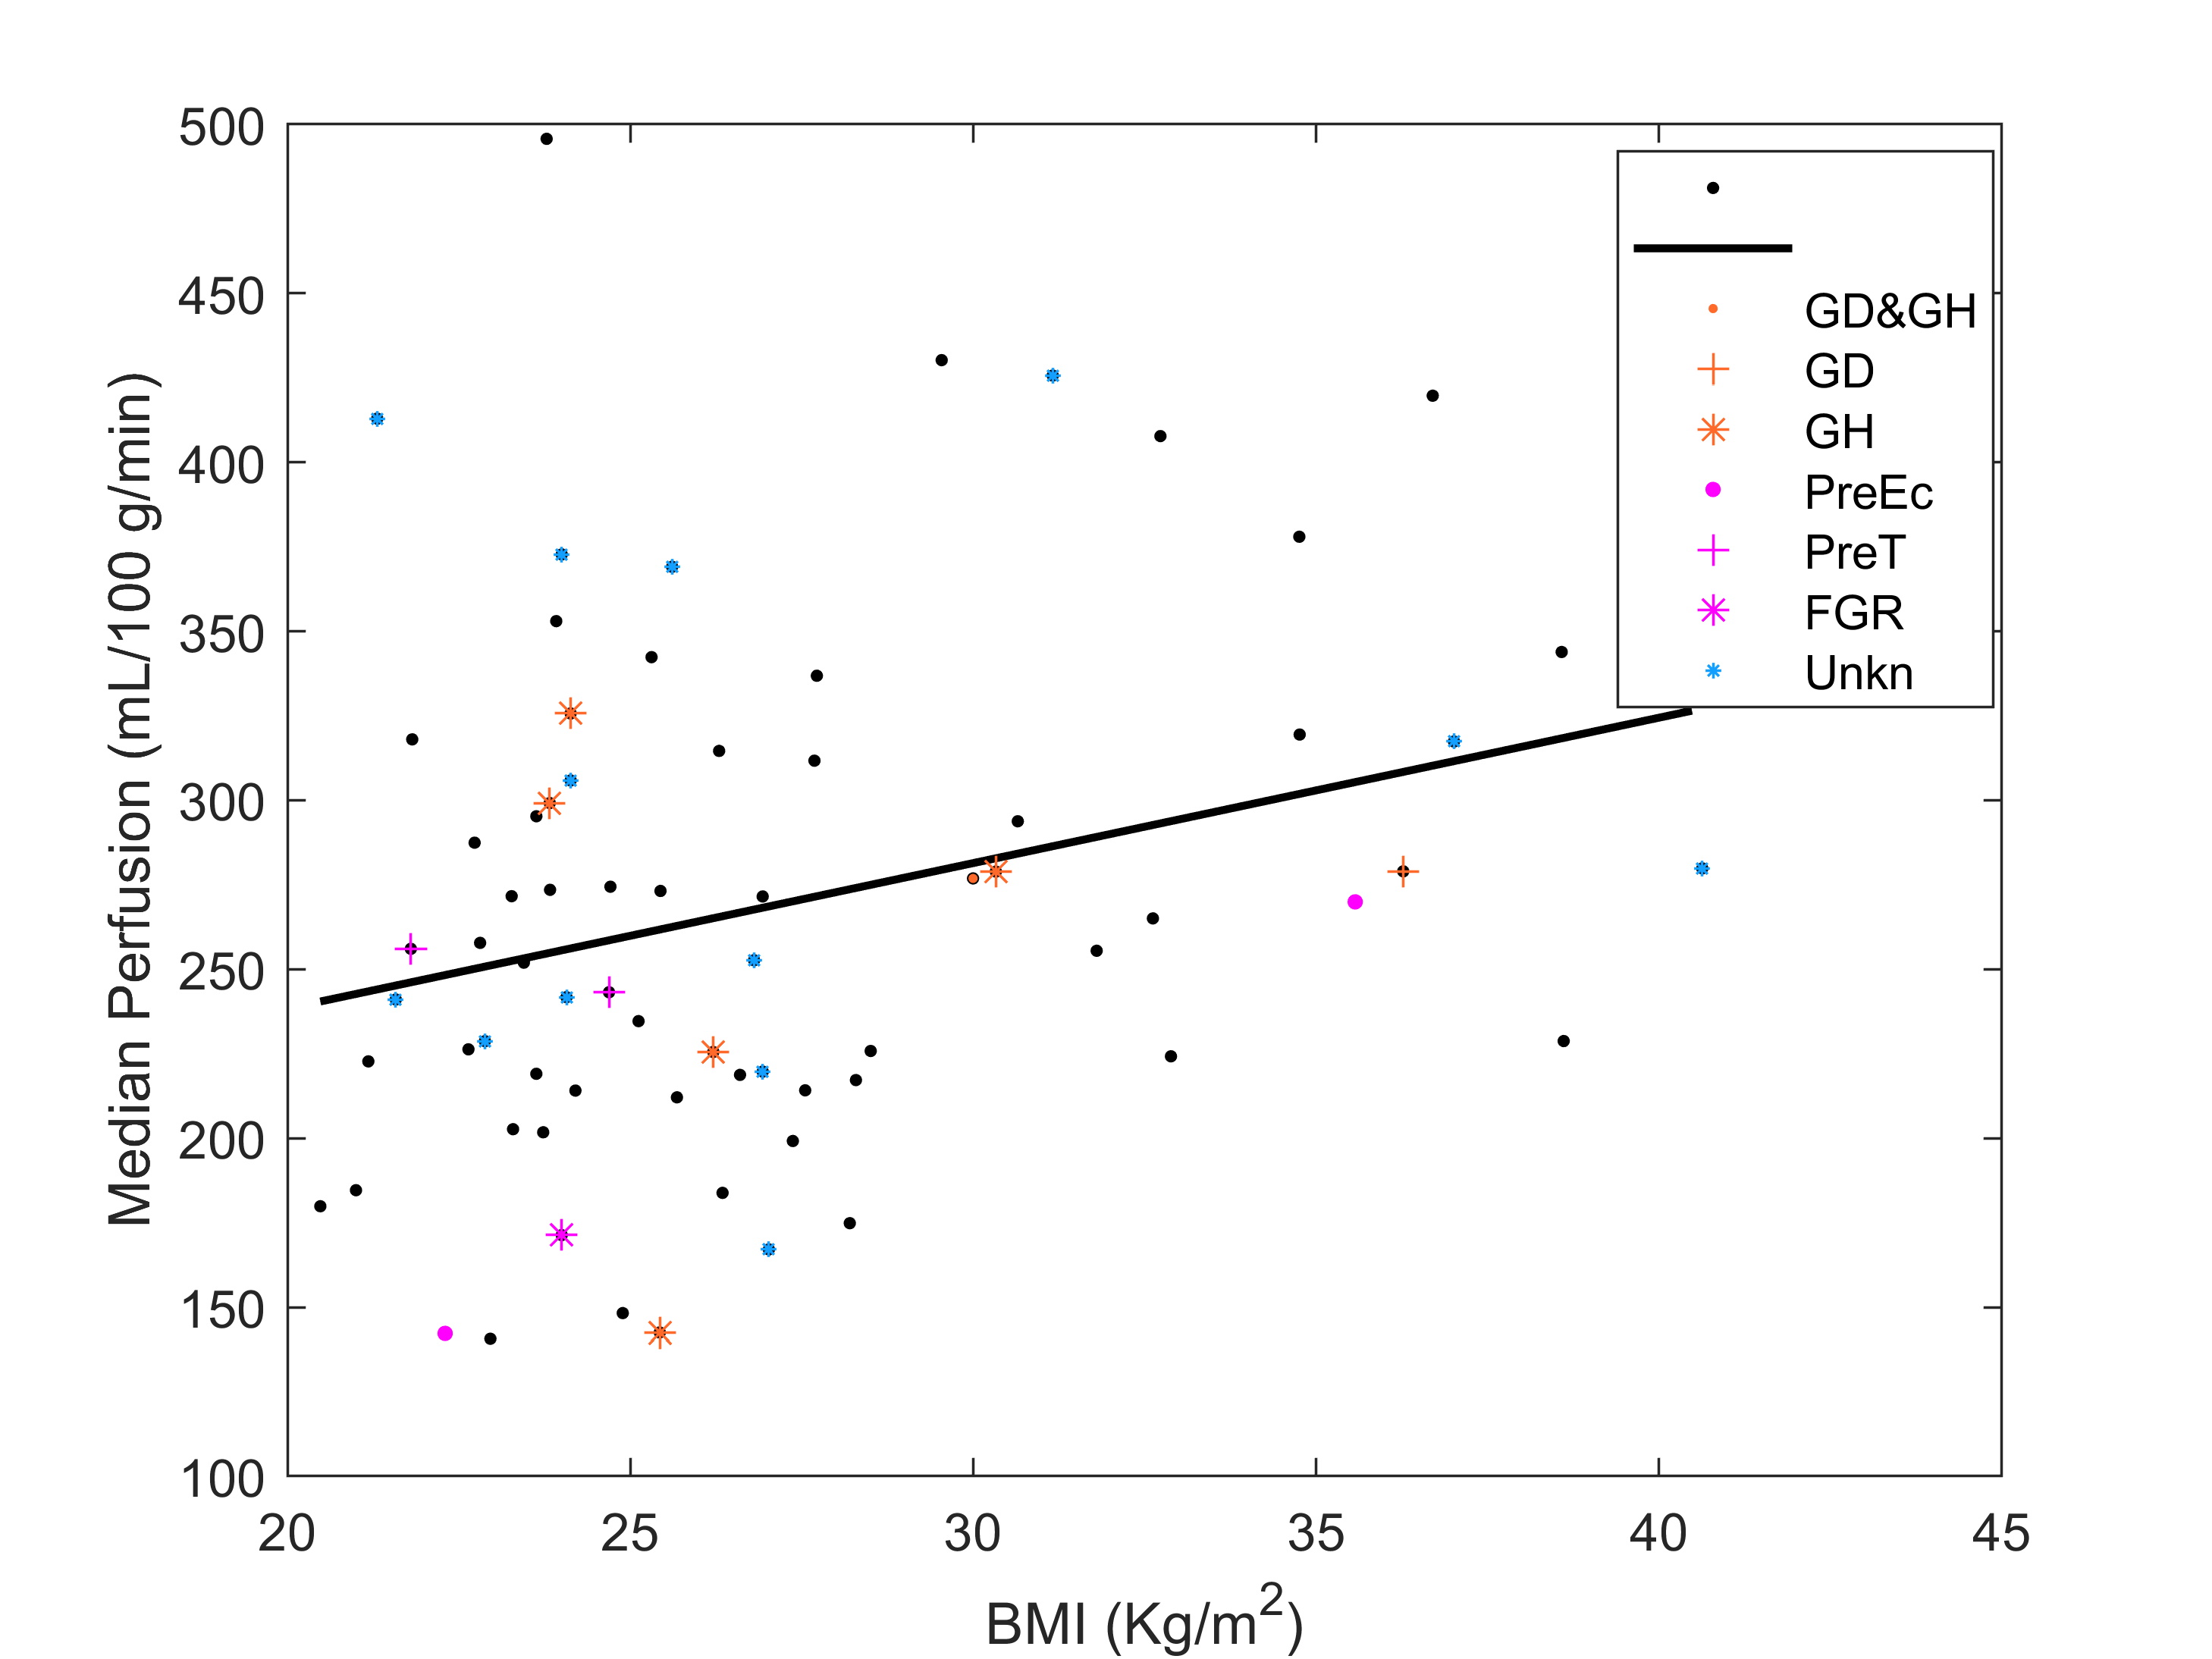
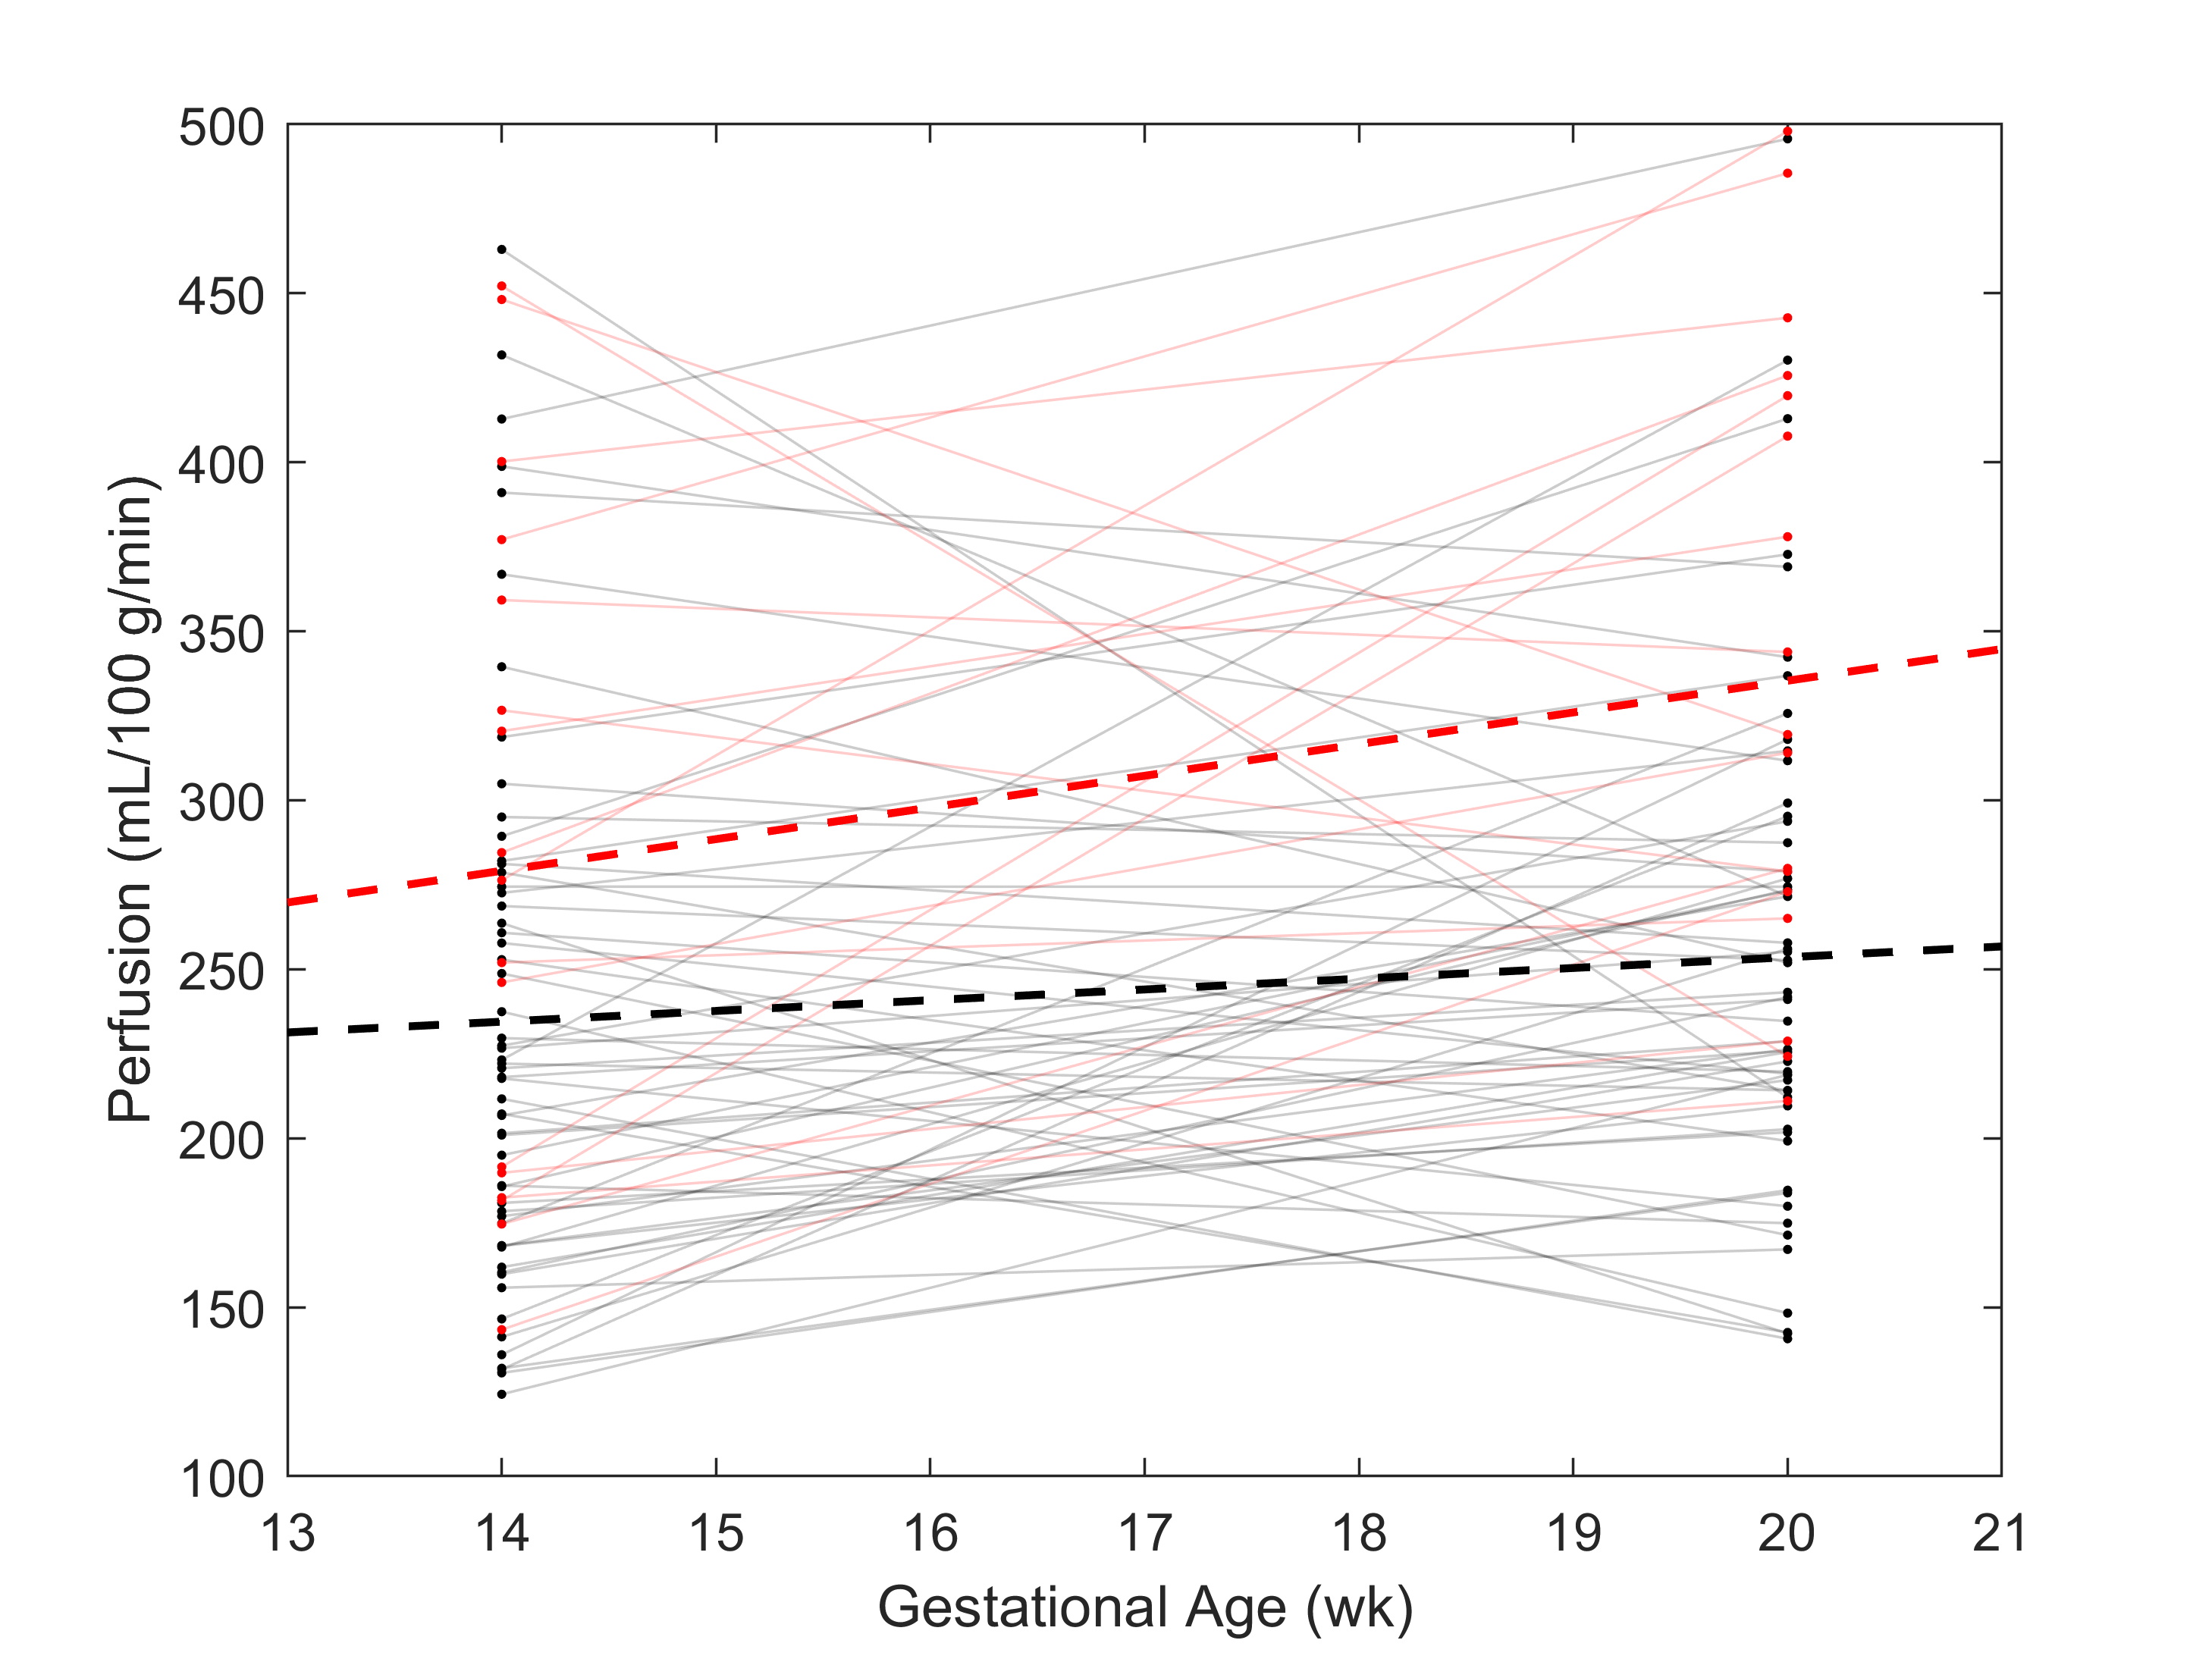
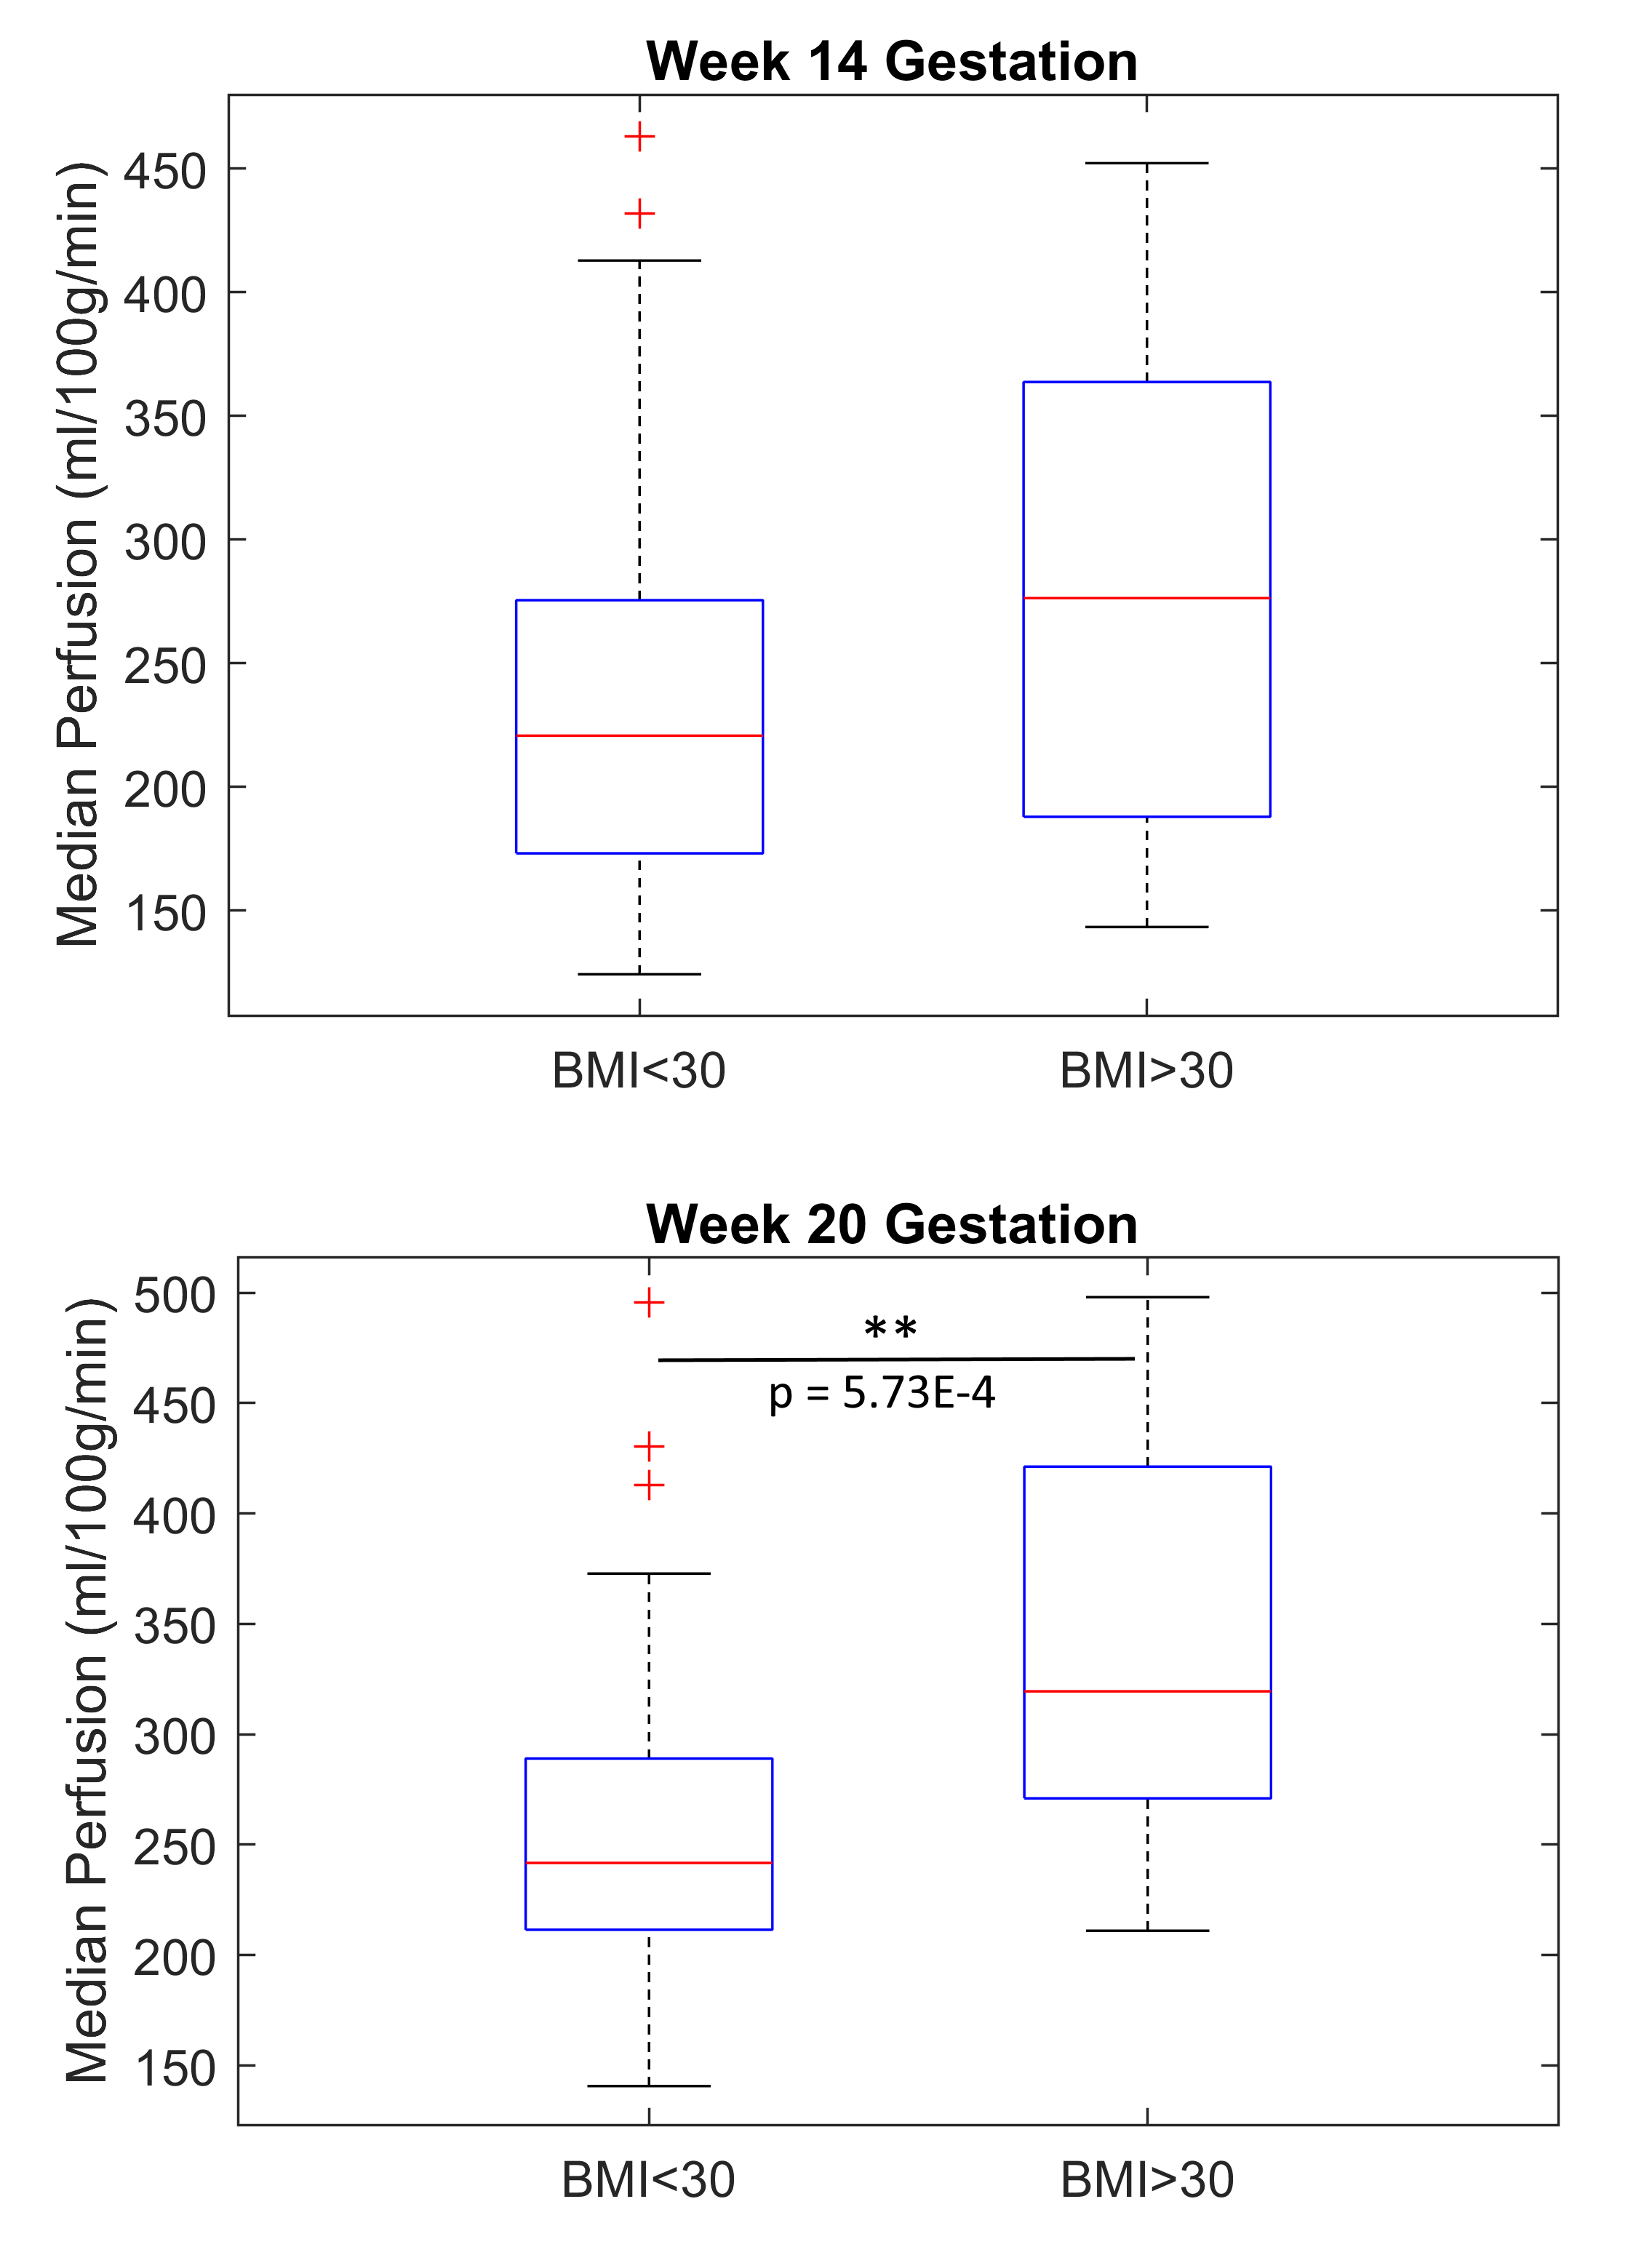
Example perfusion maps overlaid on reference M0 images are shown in Figure 2. Regression analysis revealed a statistically significant positive relationship between perfusion and BMI at 20 weeks, see Figure 3 (R2=0.076, p=0.020). Regression with blood pressure, fetal weight, and placental volume as predictors were not statistically significant. As shown in Figure 4, perfusion did not appear to change significantly between GA 14- and 20- weeks (BMI<30: p=0.094, BMI>30: p=0.067). Box plots of median perfusion for both cohorts at GA 14- and 20- weeks are shown in Figure 5. Strong statistical evidence exists for an increase in placental perfusion with obesity at 20 weeks (p=5.73E-4).Discussion/Conclusion
To our knowledge, this is the earliest measurement of perfusion in the human placenta using VS-ASL. Our analysis provides evidence that median perfusion increases with BMI, suggesting obesity does not result in restricted blood flow to the placenta. There are multiple possible explanations for this including (1) the risk associated with obesity are not vascular but due to other factors (e.g. metabolic); (2) the increase in perfusion is compensatory to other placental restrictions (e.g. oxygen exchange); or (3) the ASL measure itself is biased by body habitus.6Calculated average perfusion values from this study are similar to published literature6,14 and comparable to FAIR ASL in direct comparison.15 While other studies have measured an increase in perfusion with gestational age using VS-ASL, we hypothesize this is due to their use of a larger range of gestational ages and imaging later in pregnancy (weeks 20-40).6
Several ASL approaches remain under investigation for placenta imaging. This study used multislice VS-ASL which has the benefit of tagging the multiple vessels that supply blood to the placenta. VS-ASL removes the need for complicated plane placement and mitigates post label delays.6 Since tagging occurs based on velocity rather than a labeling plane, VS-ASL imaging measures contributions from both maternal and fetal supplies to the placenta. It is possible fetal flow increases to compensate for changes caused by maternal obesity. It is also possible that the VS-ASL is biased by increased noise or B1 variability that occurs in obese subjects. Further work is needed to evaluate these factors and compare to alternative methods, such as DCE-MRI.
Acknowledgements
We gratefully acknowledge GE Healthcare for research support of UW-Madison, and funding support from NIH Human Placenta Project (U01-HD087216).References
1. Degner, K., Magness, R. R., & Shah, D. M. (2017). Establishment of the Human Uteroplacental Circulation: A Historical Perspective. In Reproductive Sciences (Vol. 24, Issue 5, pp. 753–761). SAGE Publications Inc. https://doi.org/10.1177/1933719116669056
2. Mutsaerts, M. A. Q., Groen, H., Buiter-Van Der Meer, A., Sijtsma, A., Sauer, P. J. J., Land, J. A., Mol, B. W., Corpeleijn, E., & Hoek, A. (2014). Effects of paternal and maternal lifestyle factors on pregnancy complications and perinatal outcome. A population-based birth-cohort study: the GECKO Drenthe cohort. Human Reproduction, 29(4), 824–834. https://doi.org/10.1093/humrep/deu006
3. Vinturache, A., Moledina, N., McDonald, S., Slater, D., & Tough, S. (2014). Pre-pregnancy Body Mass Index (BMI) and delivery outcomes in a Canadian population. BMC Pregnancy and Childbirth, 14(1). https://doi.org/10.1186/s12884-014-0422-y
4. Catalano, P. M. (2007). Management of Obesity in Pregnancy. Obstetrics & Gynecology, 109(2, Part 1), 419–433. https://doi.org/10.1097/01.AOG.0000253311.44696.85
5. Derwig, I., Lythgoe, D. J., Barker, G. J., Poon, L., Gowland, P., Yeung, R., Zelaya, F., & Nicolaides, K. (2013). Association of placental perfusion, as assessed by magnetic resonance imaging and uterine artery Doppler ultrasound, and its relationship to pregnancy outcome. Placenta, 34(10), 885–891. https://doi.org/10.1016/j.placenta.2013.07.006
6. Zun, Z., Zaharchuk, G., Andescavage, N. N., Donofrio, M. T., & Limperopoulos, C. (2017). Non-Invasive Placental Perfusion Imaging in Pregnancies Complicated by Fetal Heart Disease Using Velocity-Selective Arterial Spin Labeled MRI. Scientific Reports, 7(1). https://doi.org/10.1038/s41598-017-16461-8
7. Hutter, J., Harteveld, A. A., Jackson, L. H., Franklin, S., Bos, C., van Osch, M. J. P., O’Muircheartaigh, J., Ho, A., Chappell, L., Hajnal, J. V., Rutherford, M., & De Vita, E. (2020). Perfusion and apparent oxygenation in the human placenta (PERFOX). Magnetic Resonance in Medicine, 83(2), 549–560. https://doi.org/10.1002/mrm.27950
8. Liu, D., Shao, X., Danyalov, A., Chanlaw, T., Masamed, R., Wang, D. J. J., Janzen, C., Devaskar, S. U., & Sung, K. (2019). Human Placenta Blood Flow During Early Gestation With Pseudocontinuous Arterial Spin Labeling MRI. Journal of Magnetic Resonance Imaging, jmri.26944. https://doi.org/10.1002/jmri.26944
9. Wong, E. C., Cronin, M., Wu, W.-C., Inglis, B., Frank, L. R., & Liu, T. T. (2006). Velocity-selective arterial spin labeling. Magnetic Resonance in Medicine, 55(6), 1334–1341. https://doi.org/10.1002/mrm.20906
10. Ludwig, K. D., Fain, S. B., Nguyen, S. M., Golos, T. G., Reeder, S. B., Bird, I. M., Shah, D. M., Wieben, O. E., & Johnson, K. M. (2019). Perfusion of the placenta assessed using arterial spin labeling and ferumoxytol dynamic contrast enhanced magnetic resonance imaging in the rhesus macaque. Magnetic Resonance in Medicine, 81(3), 1964–1978. https://doi.org/10.1002/mrm.27548
11. Guo, J., Meakin, J. A., Jezzard, P., & Wong, E. C. (2015). An optimized design to reduce eddy current sensitivity in velocity-selective arterial spin labeling using symmetric BIR-8 pulses. Magnetic Resonance in Medicine, 73(3), 1085–1094. https://doi.org/10.1002/mrm.25227
12. Buxton, R. B., Frank, L. R., Wong, E. C., Siewert, B., Warach, S., & Edelman, R. R. (1998). A general kinetic model for quantitative perfusion imaging with arterial spin labeling. Magnetic Resonance in Medicine, 40(3), 383–396. https://doi.org/10.1002/mrm.1910400308
13. Kim, D., Edjlali, M., Turski, P., & Johnson, K. M. (2020). Composite MRA: statistical approach to generate an MR angiogram from multiple contrasts. Magnetic Resonance in Medicine, 83(3), 830–843. https://doi.org/10.1002/mrm.27966
14. Zun, Z., & Limperopoulos, C. (2018). Placental perfusion imaging using velocity-selective arterial spin labeling. Magnetic Resonance in Medicine, 80(3), 1036–1047. https://doi.org/10.1002/mrm.27100
15. Ludwig, K. D., Adamson, E. B., Fain, S. B., Reeder, S. B., Bird, I. M., Wieben, O. E., Shah, D. M., & Johnson, K. M. (n.d.). Comparison of FAIR and Velocity-Selective ASL Perfusion MRI in the Human Placenta.
Figures