0705
Characterization of placental contractions in healthy pregnancies1Sir Peter Mansfield Imaging Centre, University of Nottingham, Nottingham, United Kingdom, 2Department of Perinatal Imaging and Health, King's College London, London, United Kingdom, 3Life Sciences, University of Nottingham, Nottingham, United Kingdom, 4Division of Child Health, Obstetrics and Gynaecology, University of Nottingham, Nottingham, United Kingdom
Synopsis
Subclinical uterine contractions in the third trimester have been detected with MRI in recent years and we regularly observe these contractions in 10 minute longitudinal scans. We have recently described how placental pump contractions differ from Braxton Hicks contractions, as defined by a reduction in placental volume. In this study, we have observed in detail the effects of 18 contractions on longitudinal single echo-planar imaging T2* weighted scans.
Introduction
In recent years MRI has revealed that subclinical (i.e. undetected by the mother) contractions of the uterus occur during pregnancy1. We have recently described a subset of contractions in which placental volume is reduced by contraction of the placenta and underlying uterine wall independent from the rest of the uterus2. We have named this the placental pump, distinct from Braxton-Hicks contractions which involve the entire uterus.Aim: to further investigate the nature of these subclinical contractions observed on MRI using T2*-weighted imaging.
Methods
Fourty-one healthy pregnant women in the second and third trimester (24-39 weeks) underwent a 10-25 minute repeated, respiratory-gated (10-15 second intervals) single echo-planar imaging (EPI) T2* weighted scan of the uterus and placenta. All participants were recruited from Nottingham University Hospitals NHS Trust and had given informed consent (East Midlands–Leicester Central Research Ethics Committee; 16/EM/0308). Images were characterised by three assessors (NSD, RA, PAG) independently and a consensus reached on the categories given in Fig 1. This analysis is entirely descriptive.Eight of these scans (seven placental pump and one Braxton-Hicks contraction) were included in our previous publication2, here we are expanding our observations for a more thorough description, using scans acquired since analysis for the publication as well as scans where contractions were less obvious or only partially captured on the longitudinal dataset.
Results
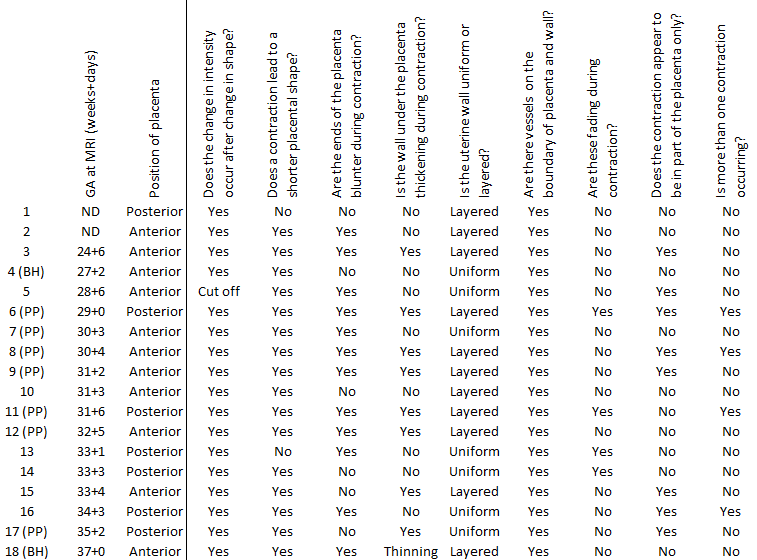
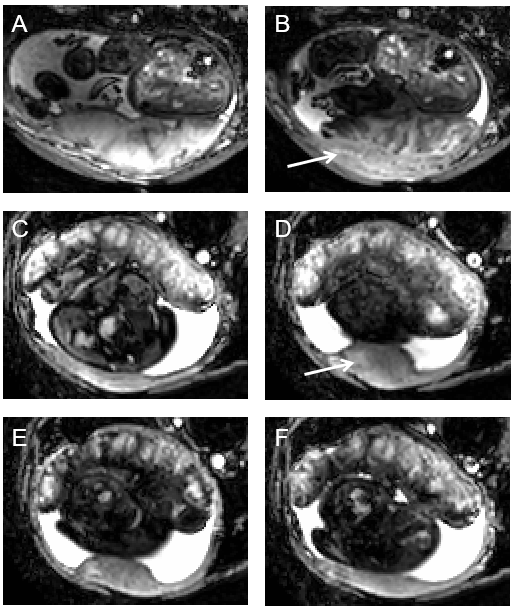
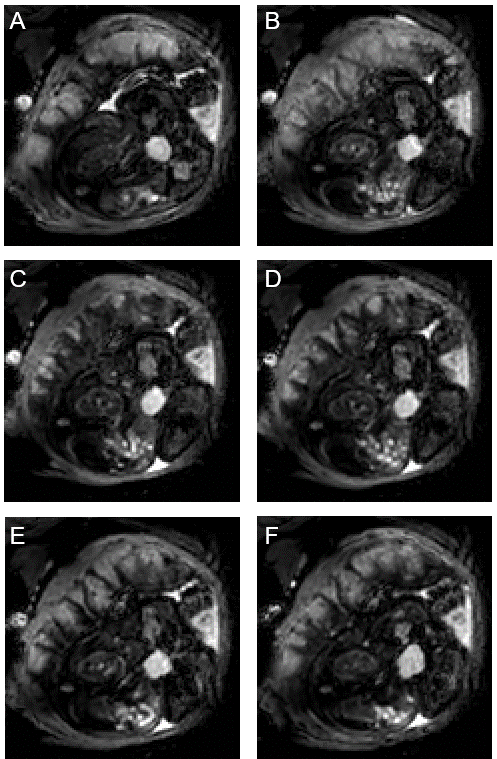
We observed contractions of varying strengths in 18 of 41 healthy pregnancies. In all of these, a reduction in intensity occurred after onset of change in placental shape, with placentas generally becoming shorter (in 16 of 18 scans) with blunter ends (12/18, Fig 1). The general appearance of scans was not obviously different in scans that do not change in placental volume and which we define as Braxton-Hicks contractions (indicated in Fig 1).The wall under the placenta thickened in 8/18 contractions, thinned in 1/18 contraction, and was unchanged in 9/18 contractions. When uterine wall was involved in the contraction, it thickened under the placenta only (Fig 2). When the wall was involved in the contraction, this change occurred at the same time as the change in placental shape. (In one case we noticed an area on the uterine wall opposite the placenta which pulsated rhythmically, at the same times as the apparent placental contraction). In the relaxed state, the uterine wall had a uniform, thin appearance in 7/18 pregnancies and a layered or spongey, thicker appearance in 11/18. Layered walls were more likely to thicken during contraction (7/10 plus one that thinned) and uniform walls were less likely to thicken during contraction (1/7). Of note, in both cases of Braxton-Hicks contractions the wall did not thicken but either stayed the same or became thinner (Fig 1).
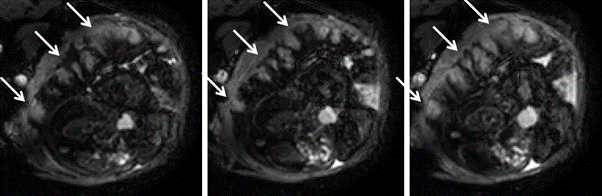
In all cases (18/18) vessels were observed at the boundary between placenta and uterine wall, visible as hypointense dots or short lines, which only collapsed in 4/18 contractions. Often, contractions appeared to be stronger in one part of the placenta and weaker in other areas (8/18, Fig 3).
In 4/18 participants, contractions occurred repeatedly over the duration of the scan. In such repeated contractions, we observed that hypointense patterns occurring during contractions were highly conserved (Fig 4), suggesting that they are prescribed by the tissue structure (arteries and veins, villous trees, cotyledons).
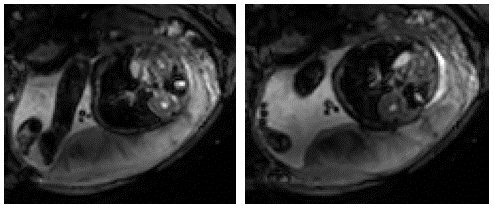
Generally, the signal from the placenta on T2*-weighted scans will be pale and quite smooth when relaxed, and darker during a contraction, becoming more pronounced close to the chorionic plate, with a pattern suggesting draining between cotyledons, before returning to the pale appearance (Fig 5).
Discussion
Here we are investigating subclinical uterine contractions observed on MRI time course data in the second half of pregnancy. We note a recent discovery that the uterine pacemaker is located at the placental/myometrial junction in rats3 and these contractions could relate to contractions of the middle layer of muscle (junctional zone in the uterus containing tightly packed muscle fibres with various orientations). This may explain the observation in about half of cases that the wall under the placenta thickens during the contraction.Secondly we note that these contractions must affect the function of the placenta. They generally cause a reduction in T2* (low intensity) particularly close to the chorionic plate and between the cotyledons. More quantitative analysis is required to determine the net effect on oxygenation but this could reflect ejection of deoxyengated blood from the intervillous space, a reduction in oxygenation, change in blood flow, or a combination of these processes.
We hypothesize that the subclinical contractions observed are localized to the placenta and have the function of mixing of blood in the placenta to aid transport through what is otherwise a low flow system. We will use this characterization of the changes occurring to guide a more quantitative analysis to test this hypothesis.
Acknowledgements
This study was funded by the National Institute of Health.References
1 Sinding M, Peters DA, Frøkjær JB, Christiansen OB, Uldbjerg N, Sørensen A. Reduced placental oxygenation during subclinical uterine contractions as assessed by BOLD MRI. Placenta. 2016;39:16–20.
2 Dellschaft NS, Hutchinson G, Shah S et al. The haemodynamics of the human placenta in utero. PLoS Biol. 2020;18(5):e3000676.
3 Lutton EJ, Lammers WJEP, James S, van den Berg HA, Blanks AM. Identification of uterine pacemaker regions at the myometrial-placental interface in the rat: Myometrial pacemaker. J Physiol. 2018;596(14):2841–2852.
Figures