0703
Relating tumor site-specific volume and ADC changes following neoadjuvant chemotherapy to histopathology in epithelial ovarian cancer1MRI Unit, Royal Marsden NHS Foundation Trust, London, United Kingdom, 2Division of Radiotherapy and Imaging, Institute of Cancer Research, London, United Kingdom, 3Cancer Research UK Cambridge Institute, Cambridge, United Kingdom, 4Addenbrooke’s Hospital, Cambridge University Hospitals NHS Foundation Trust, Cambridge, United Kingdom, 5Department of Oncology, University of Cambridge, Cambridge, United Kingdom, 6Centre for Evolution and Cancer, The Institute of Cancer Research, London, United Kingdom, 7Division of Molecular Pathology, The Institute of Cancer Research, London, United Kingdom, 8Department of Pathology, Royal Marsden NHS Foundation Trust, London, United Kingdom, 9Department of Radiology, Addenbrooke’s Hospital, Cambridge University Hospitals NHS Foundation Trust, Cambridge, United Kingdom, 10Swansea Gynaecological Oncology Centre, Swansea Bay University Health Board, Singleton Hospital, Swansea, United Kingdom, 11Gynaecology Unit, Royal Marsden NHS Foundation Trust, Sutton, United Kingdom, 12Clinical Trials and Statistics Unit, The Institute of Cancer Research, London, United Kingdom, 13Department of Computer Science, University of Warwick, Warwick, United Kingdom
Synopsis
In Epithelial Ovarian Cancer, ADCmedian demonstrates good repeatability at both primary and metastatic sites. After neoadjuvant chemotherapy, a differential increase in ADCmedian at disease sites is seen despite similar tumor shrinkage. The negative correlation between ADCmedian and tumor cell fraction after neoadjuvant chemotherapy, and positive correlation between change in ADCmedian and percentage necrosis, are driven primarily by changes in the peritoneal lesions.
Background
The apparent diffusion coefficient (ADC) derived from diffusion-weighted MRI (DW-MRI) is gaining increased acceptance as a biomarker of response in solid tumors because it demonstrates changes before tumor shrinkage [1]. This is an important advance from RECIST criteria based on size alone, particularly in clinical trials settings, because potentially toxic, ineffective and costly therapies can be avoided sooner.Purpose
To assess site-specific repeatability of baseline volume and ADC measurements in epithelial ovarian cancer (EOC), compare disease site-specific ADC response to neoadjuvant chemotherapy (NAC), and relate these changes to histological metrics (residual tumor and necrosis).Materials and Methods
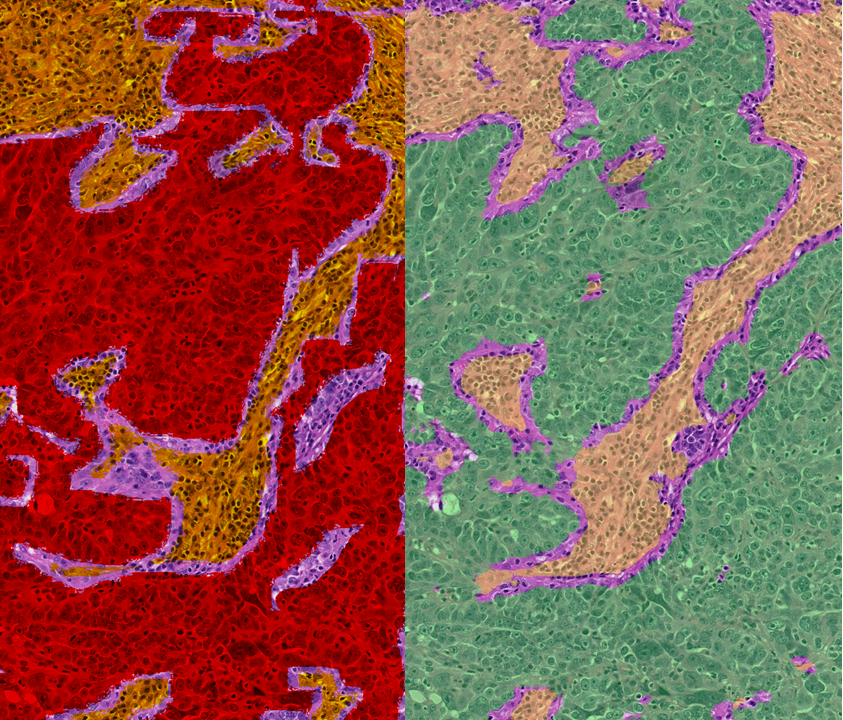
Participants with newly-diagnosed EOC due for platinum-based NAC and interval debulking surgery were recruited prospectively in a multicenter study (ClinicalTrials.gov NCT01505829 [2]). Standardized axial abdomino-pelvic DW-MRI was obtained across multivendor platforms, with two baseline (pre-NAC) examinations to assess site-specific repeatability, and one pre-operative (post-NAC) examination after the third or fourth cycle of neoadjuvant chemotherapy. Regions-of-interest (ROIs) were drawn by region growing on computed b=1000smm-2 images by trained radiologists. ROIs encompassed the whole solid lesion within ovarian, omental, and peritoneal lesions and involved lymph nodes (up to 10 lesions per participant). Lesional solid tumor volume, median apparent diffusion coefficient (ADCmedian), and 25th/75th ADC centiles (ADC25, ADC75) were estimated for each lesion. Linear mixed-effects regression models were used to compare changes in tumor volume and ADCmedian between disease sites, and to compare pre-NAC ADCmedian between lesions that became non-measurable (defined as <10 voxels) post-NAC with those that remained measurable.Anatomical diagrams and marker sutures were used to match surgically-excised lesions (post-NAC) with those identified on DW-MRI. A trained algorithm was used to determine tumor cell, stromal and lymphocyte fraction (defined as the proportion of viable tumor cells, stromal cells, or lymphocytes respectively, to total cells in the sample) on histopathological sections selected by the pathologist to be representative of the whole lesion [3; 4]. Pathologist-determined tumor/necrosis segmentation on a subset of data was used to further train the automated system to >90% accuracy for deriving percentage tumor and percentage necrosis (defined as the ratio of segmented tumor or necrosis, respectively, to the total segmented tissue area) (Figure 1). Whole-lesion pre-NAC ADCmedian and ADC changes were compared with histological parameters (Spearman’s coefficient). Pairwise comparisons between disease sites were adjusted and p-values corrected for multiplicity by Bonferroni.
Results
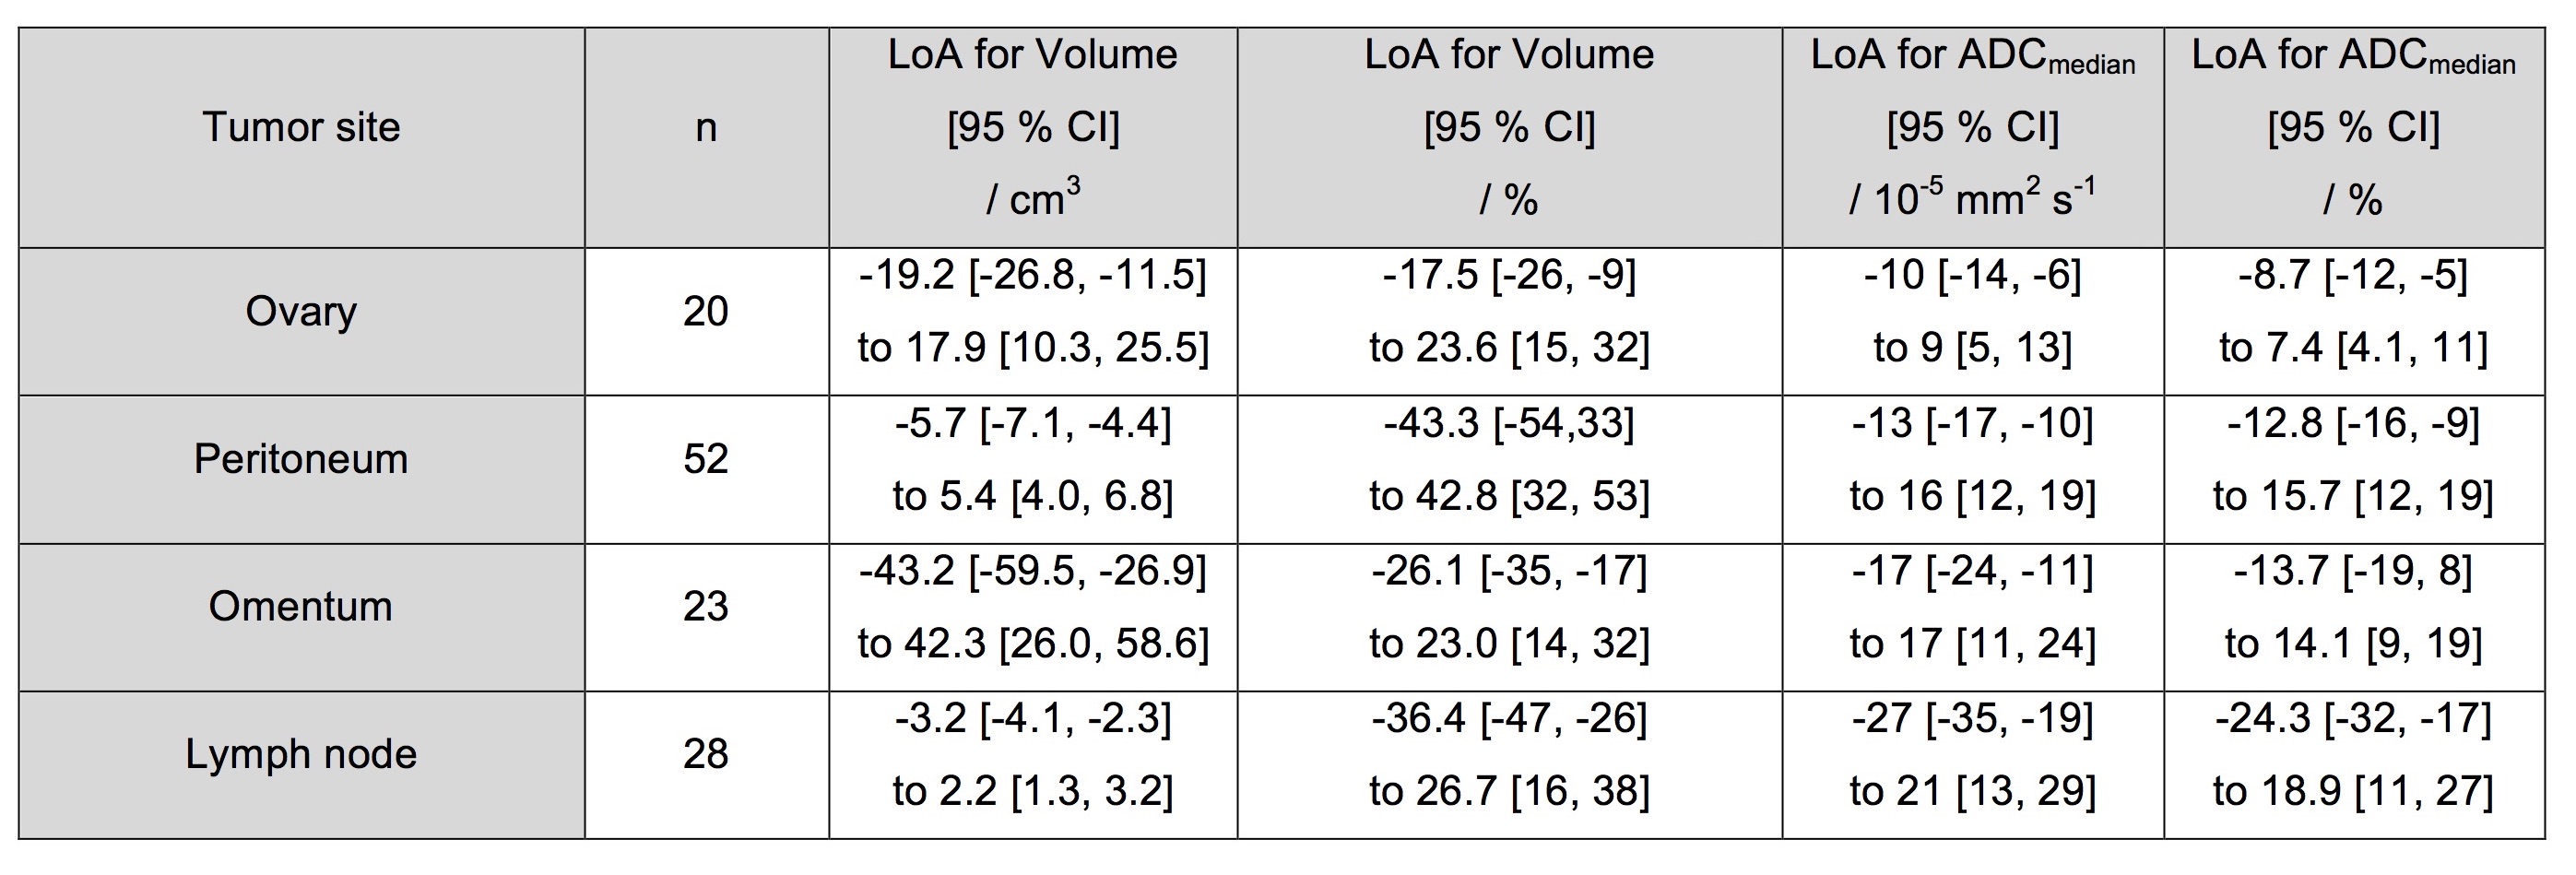
52 participants were recruited, with 47/52 included in the analysis (47 women, median age 61 years, interquartile range 57-70 years). Post-NAC DW-MRI was obtained in 139 lesions, and histopathology data in 99 lesions, with paired DW-MRI/histopathology data in 65 lesions.Limits of agreement (LoA) of ADCmedian were lowest for solid elements of ovary and highest for lymph nodes (Figure 2). Tumor volume reduction (n=139 lesions) was similar across all sites, being >80% in all cases (Figure 3). 28/40 ovarian, 35/50 peritoneal, 19/27 omental and 14/22 lymph node lesions reduced in volume below the lower LoA.
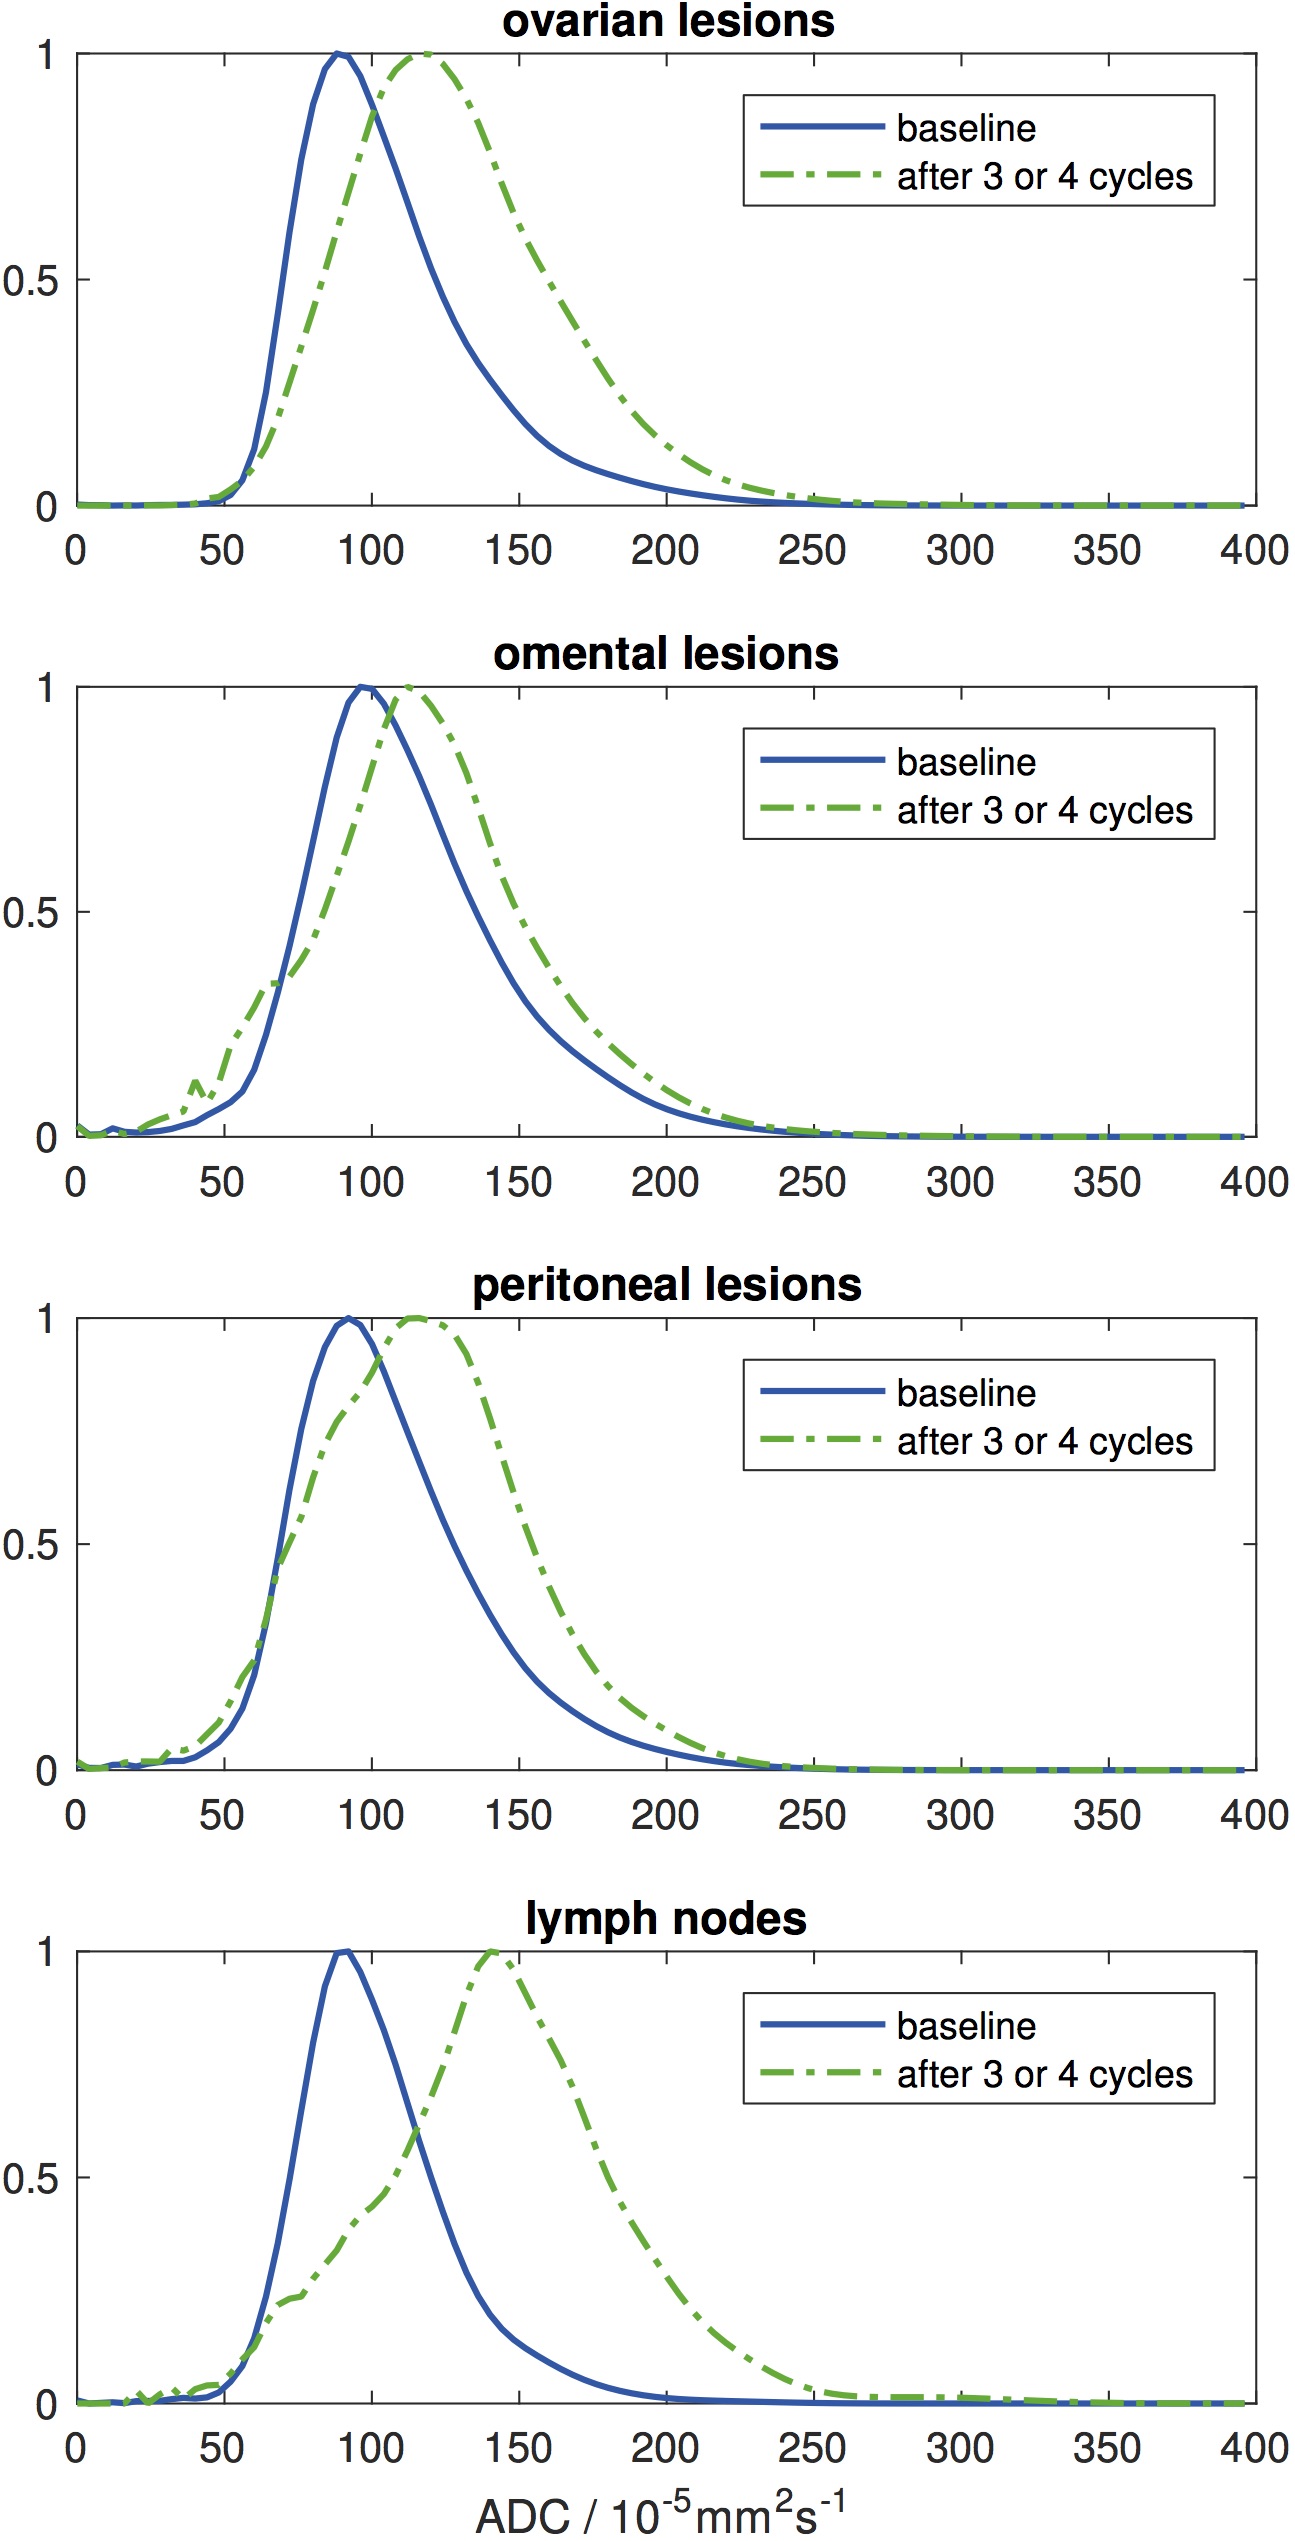
ADCmedian increased at all sites, but was significantly different between them being lowest for omentum and highest for lymph node. 28/40 ovarian, 24/50 peritoneal, 8/27 omental and 17/22 lymph node lesions increased in ADCmedian above the upper LoA. Probability density functions for ADC estimates from all lesions at each anatomic location showed a shift towards higher ADC after treatment (Figure 4). The pre-NAC ADCmedian of lesions that became non-measurable post-NAC was not different from those that remained measurable. On histopathology (n=99 lesions), the tumor cell fraction was higher at the primary site (ovary) than at the metastatic sites (Kruskal-Wallis p=0.02), where it was lower within lymph nodes than in peritoneum or omentum (Figure 3). However the stromal and lymphocyte fractions were not significantly different between disease sites (Kruskal-Wallis p=0.8 and 0.5 respectively).
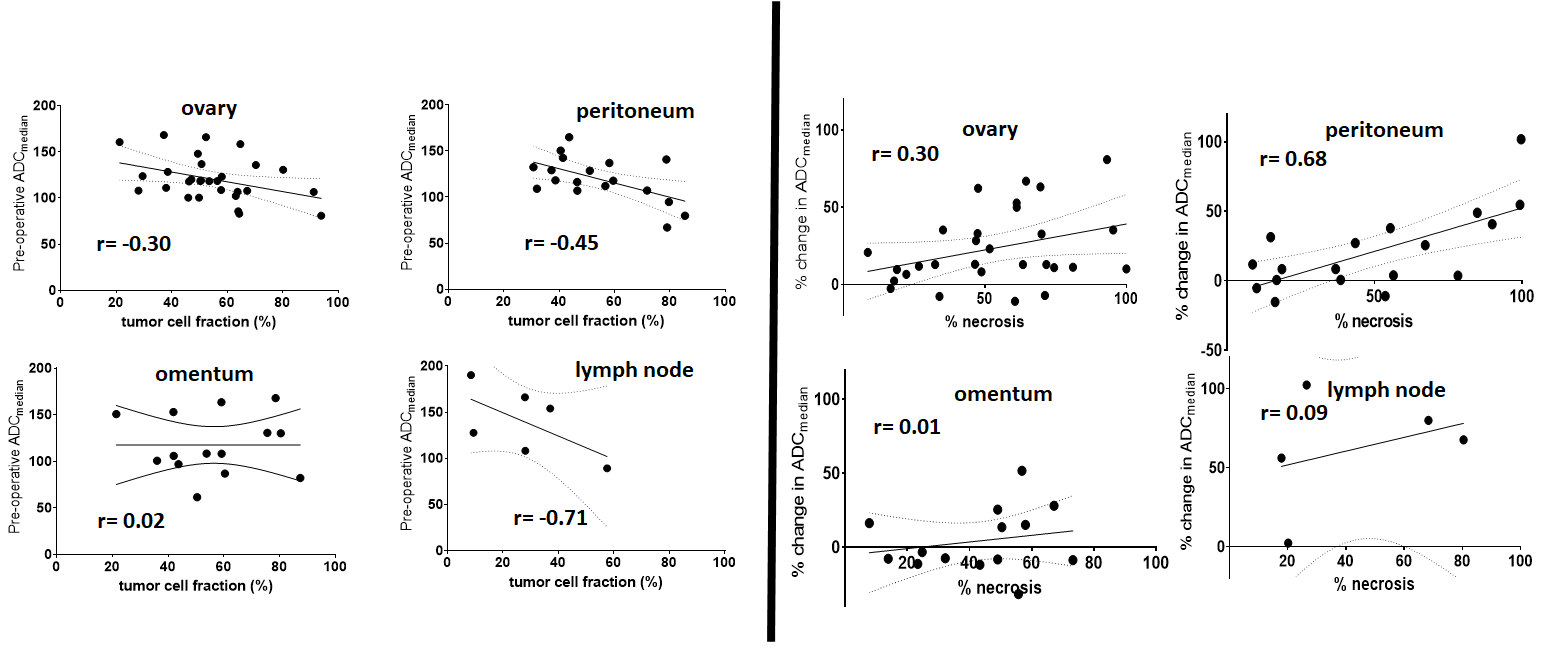
Considering 69 imaging-pathology matched sections (65 lesions in 25 participants: 20 ovarian lesions, 29 peritoneal, 14 omental, 6 lymph node), ADCmedian correlated negatively with tumor cell fraction (r=-0.34, p=0.005) (Figure 5). When considered by disease site, this held true for the peritoneum (r=-0.45, p=0.05) only. Similarly, when all sites were considered together, the change in ADCmedian, ADC25, and ADC75 showed positive correlation with percentage necrosis as measured in relation to the entire cell population (r=0.39, p=0.001; r=0.45, p=0.001; r=0.40, p=0.001 respectively) (Figure 5). However, when considered by disease site this held true for peritoneum only (r=0.68, p=0.001; r=0.71, p=0.001; r=0.61, p=0.005 respectively).
Conclusion
In EOC, ADCmedian demonstrates good repeatability at both primary and metastatic sites. Following NAC, ADCmedian, ADC25, and ADC75 increase differentially at disease sites despite similar tumor shrinkage across sites. After NAC, the residual tumor fraction on pathology is highest at the primary site. There is negative correlation between ADCmedian and tumor cell fraction after NAC, and positive correlation between change in ADCmedian and percentage necrosis, which are driven primarily by the peritoneal lesions. This study also demonstrates the feasibility and value of using machine-learning methods for analysis of histopathology data to biologically validate quantitative MRI biomarkers.Acknowledgements
We acknowledge funding from Cancer Research UK BIDD grant C1353/A12762 and Cancer Research UK and Engineering and Physical Sciences Research Council support to the Cancer Imaging Centre at the Institute of Cancer Research and Royal Marsden Hospital in association with the Medical Research Council and Department of Health C1060/A10334, C1060/A16464 and National Health Service funding to the National Institute for Health Research Biomedical Research Centres at Royal Marsden Hospital/Institute of Cancer Research and Cambridge, Experimental Cancer Medicine Centres, the Clinical Research Facility in Imaging, and the Cancer Research Network. We are also grateful for financial support from Addenbrooke’s Charitable Trust. The views expressed in this publication are those of the author(s) and not necessarily those of the National Health Service, the National Institute for Health Research or the Department of Health.References
1. Taouli B, Beer AJ, Chenevert T et al (2016) Diffusion-weighted imaging outside the brain: Consensus statement from an ISMRM-sponsored workshop. J Magn Reson Imaging 44:521-540. Doi:10.1002/jmri.25196
2. Winfield JM, Wakefield JC, Dolling D et al (2019) Diffusion-weighted MRI in Advanced Epithelial Ovarian Cancer: Apparent Diffusion Coefficient as a Response Marker. Radiology 293:374-383. Doi:10.1148/radiol.2019190545
3. AbdulJabbar K, Raza SEA, Rosenthal R et al (2020) Geospatial immune variability illuminates differential evolution of lung adenocarcinoma. Nat Med 26:1054-1062. Doi:10.1038/s41591-020-0900-x
4. Raza SEA, Cheung L, Shaban M et al (2019) Micro-Net: A unified model for segmentation of various objects in microscopy images. Medical image analysis 52:160-173. Doi:10.1016/j.media.2018.12.003
Figures