0700
Ex vivo and In vivo Diffusion Weighted MRI highlights the Microarchitecture of mouse Pancreatic Intraepithelial Neoplasia1Champalimaud Research, Champalimaud Centre for the Unknown, Lisbon, Portugal, 2Department of Radiology, Champalimaud Clinical Centre, Lisbon, Portugal, 3Department of Pathology, Champalimaud Clinical Centre, Lisbon, Portugal
Synopsis
As current therapeutic options for pancreatic cancer are mostly ineffective, developing diagnostic tools for early detection of precursor lesions (mainly pancreatic intraepithelial neoplasia – PanIN) could change the course of this disease. Here, we investigated Diffusion-MRI (dMRI) contrasts for this purpose, using transgenic mouse models. First, we performed ex vivo dMRI Microscopy at ultrahigh field with histological validation, defining the most sensitive contrasts. Then, we performed in vivo abdominal imaging, demonstrating their applicability in the non-invasive study of PanIN and pancreatic cancer. These findings provide new tools for researching PanIN and hold promise for a future translation to clinical practice.
Introduction
Pancreatic cancer, mainly represented by ductal adenocarcinoma (PDAC), is a leading cause of cancer related-death worldwide, with a 9% survival rate at 5 years, due to late diagnosis and limited efficacy of therapeutic options1-3. Therefore, identifying precursor lesions for PDAC, mainly comprised of pancreatic intraepithelial neoplasia (PanIN), could provide opportunities for earlier and more effective therapies. However, PanINs are not diagnosed by current non-invasive imaging4, which also hinders research on the lesions’ biology and PDAC tumorigenesis.Here, we developed a Diffusion-encoded Susceptibility Perturbation Imaging (DESPI)5 approach for detecting PanIN in Pdx1-Cre;KrasG12D and Ptf1a-Cre;KrasG12D;TP53 mice (well-established models for the development of PanIN and PDAC6), validating our findings with histology. Following previous work7, we first performed ex vivo analyses, for a comprehensive exploration of different contrasts with MR-Microscopy. We than adapted the methodology for in vivo conditions and performed abdominal imaging with diffusion contrast for identifying PanIN associated changes and PDAC.
Methods
Experiments were preapproved by institutional and national authorities, in accordance with European Directive 2010/63. Datasets were analyzed using MATLAB™ (MathWorks Inc., Natick, MA) and ImageJ (US NIH).In vivo anatomical MRI and Tissue extraction
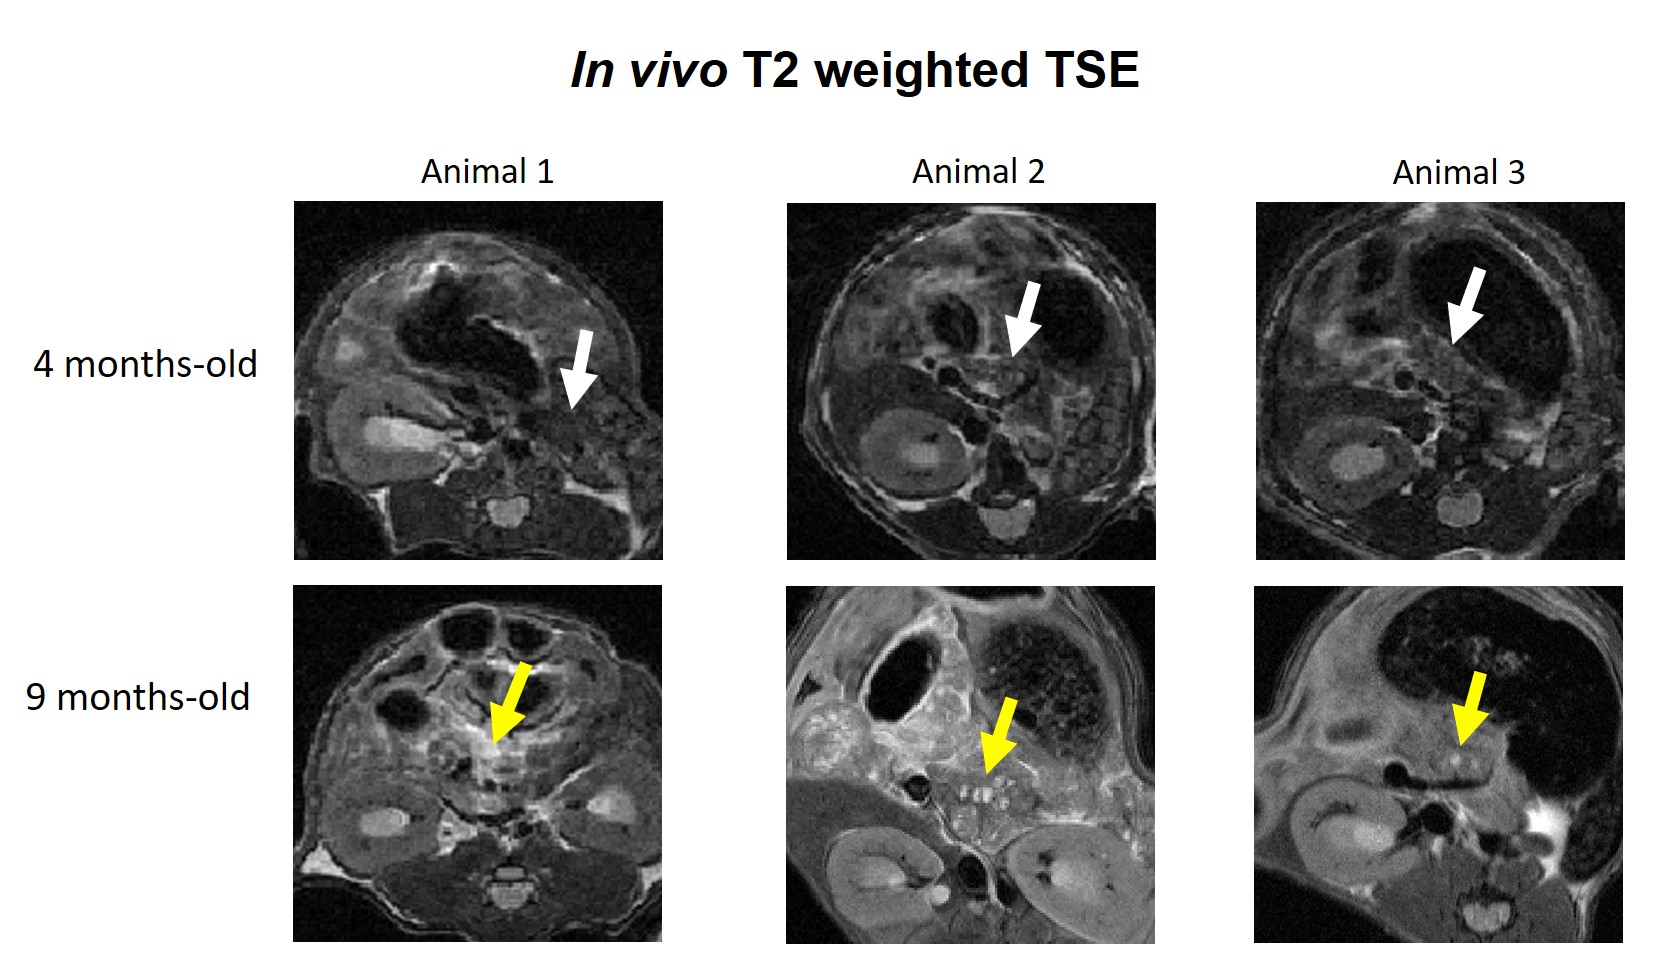
N=6 Pdx1-Cre;KrasG12D mice (C57BL/6J background) underwent abdominal imaging once every 3 weeks from 14-weeks-old, on 1T and 9.4T scanners (IconTM, BioSpecTM, Bruker, Germany) with TSE-T2WI (IconTM: TR/TE = 3825/60ms; RARE-factor = 8; slice thickness = 700µm; resolution = 150x150µm2; BiospecTM: TR/TE = 750/8ms; RARE-factor = 8; slice thickness = 700µm; resolution = 125x125µm2). All animals showed pancreatic abnormalities at 9-months-old (Figure 1) and were sacrificed for post-mortem analyses, along with a similar-aged C57BL/6J control. Pancreases were removed by laparotomy, immersed in 4%-PFA (48 hours), PBS (24 hours) and Flourinert® within a 10mm NMR tube.
Ex vivo MR-Microscopy
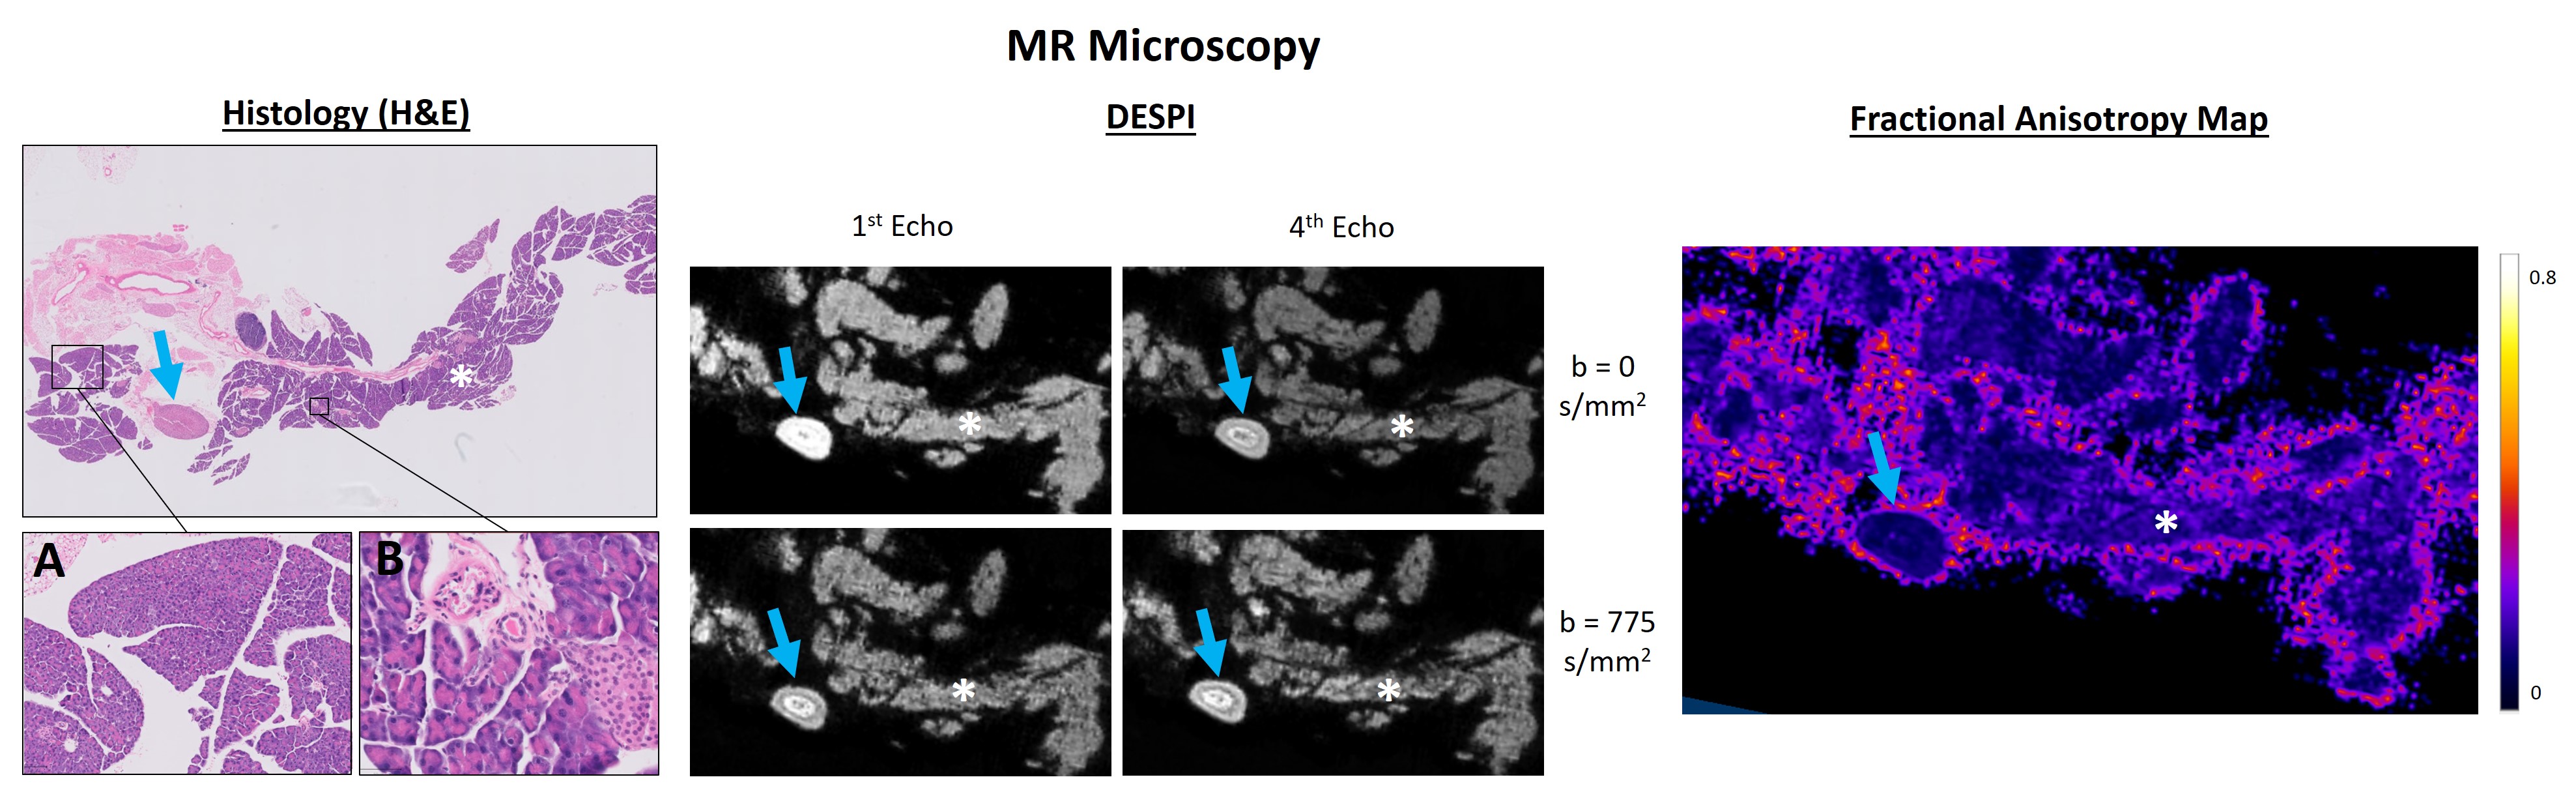
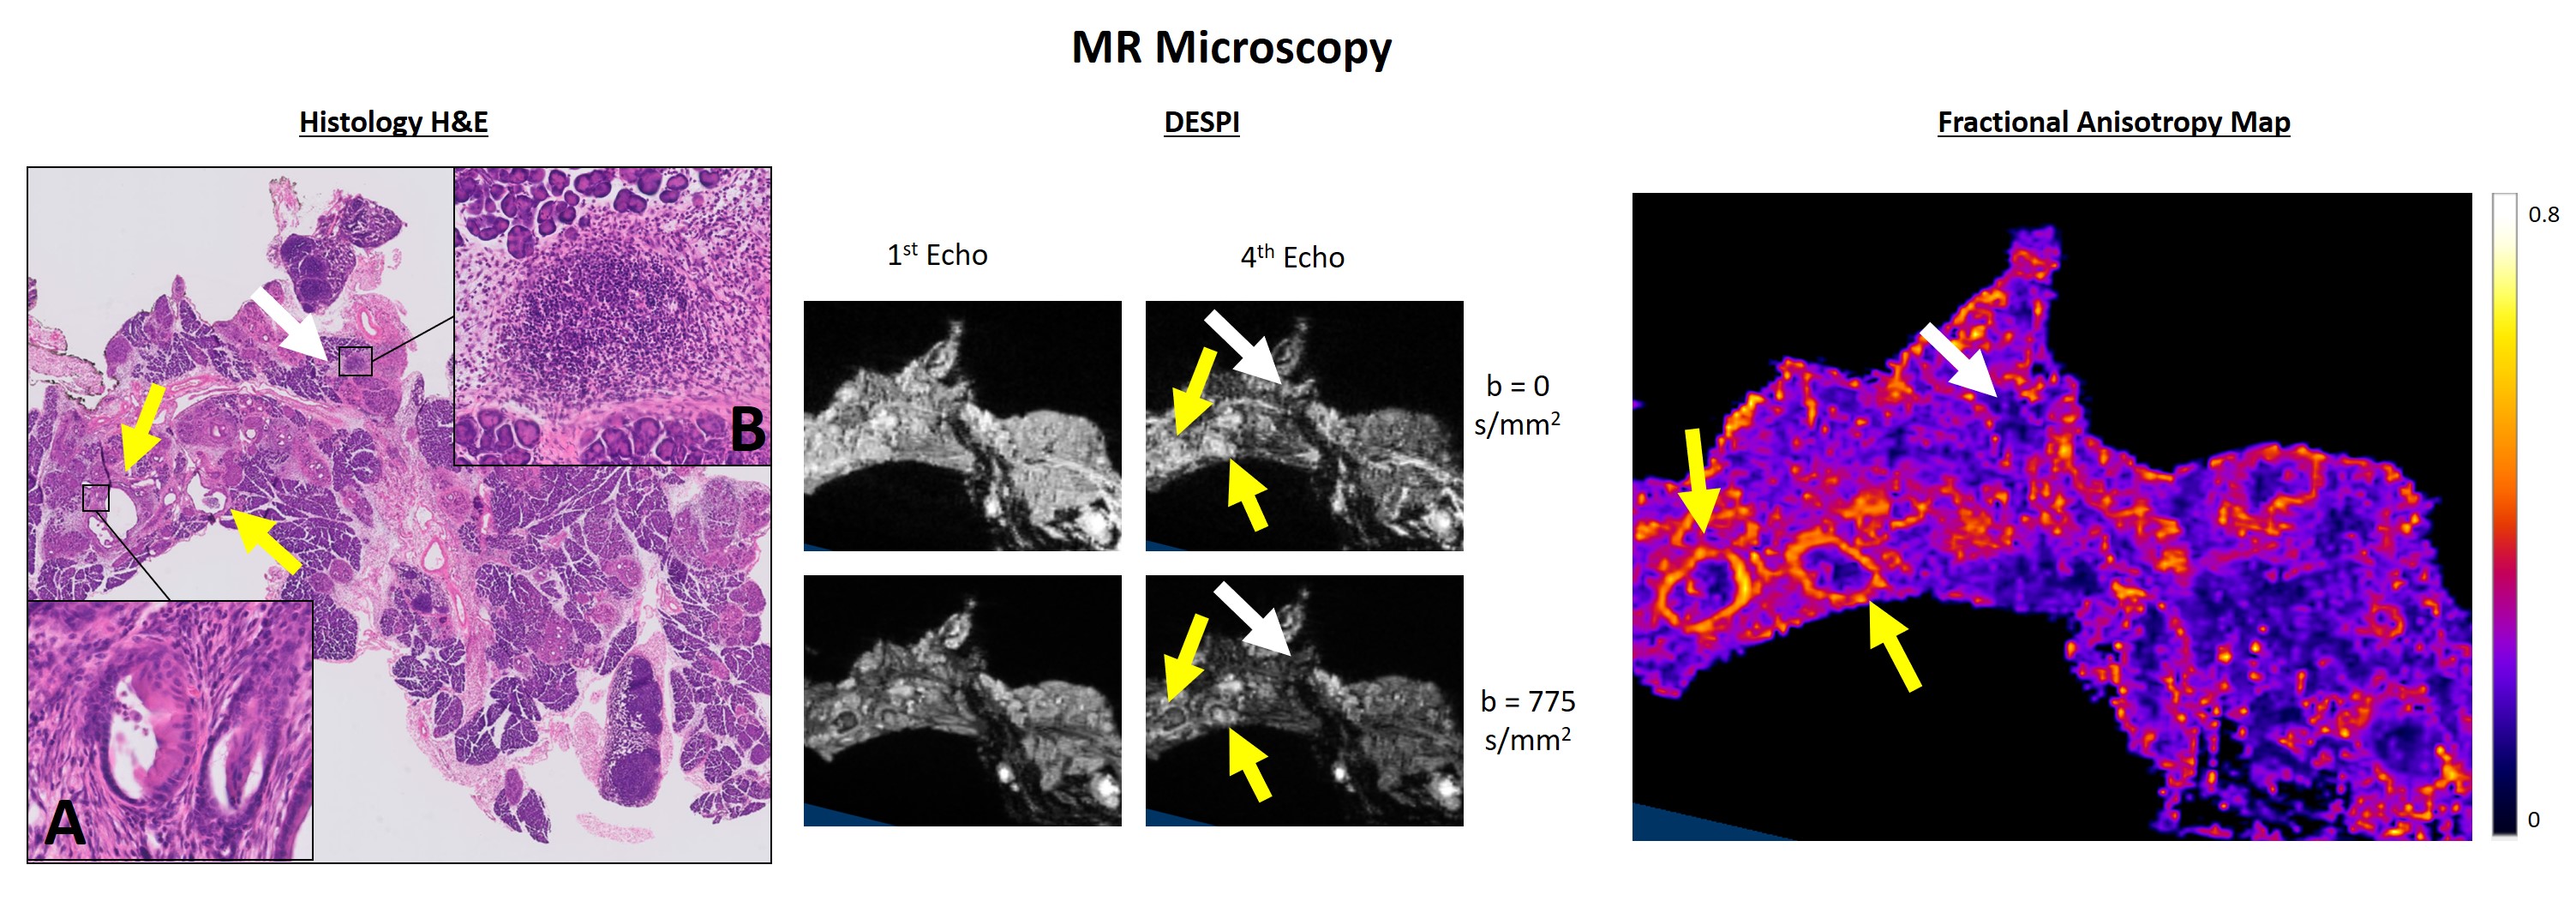
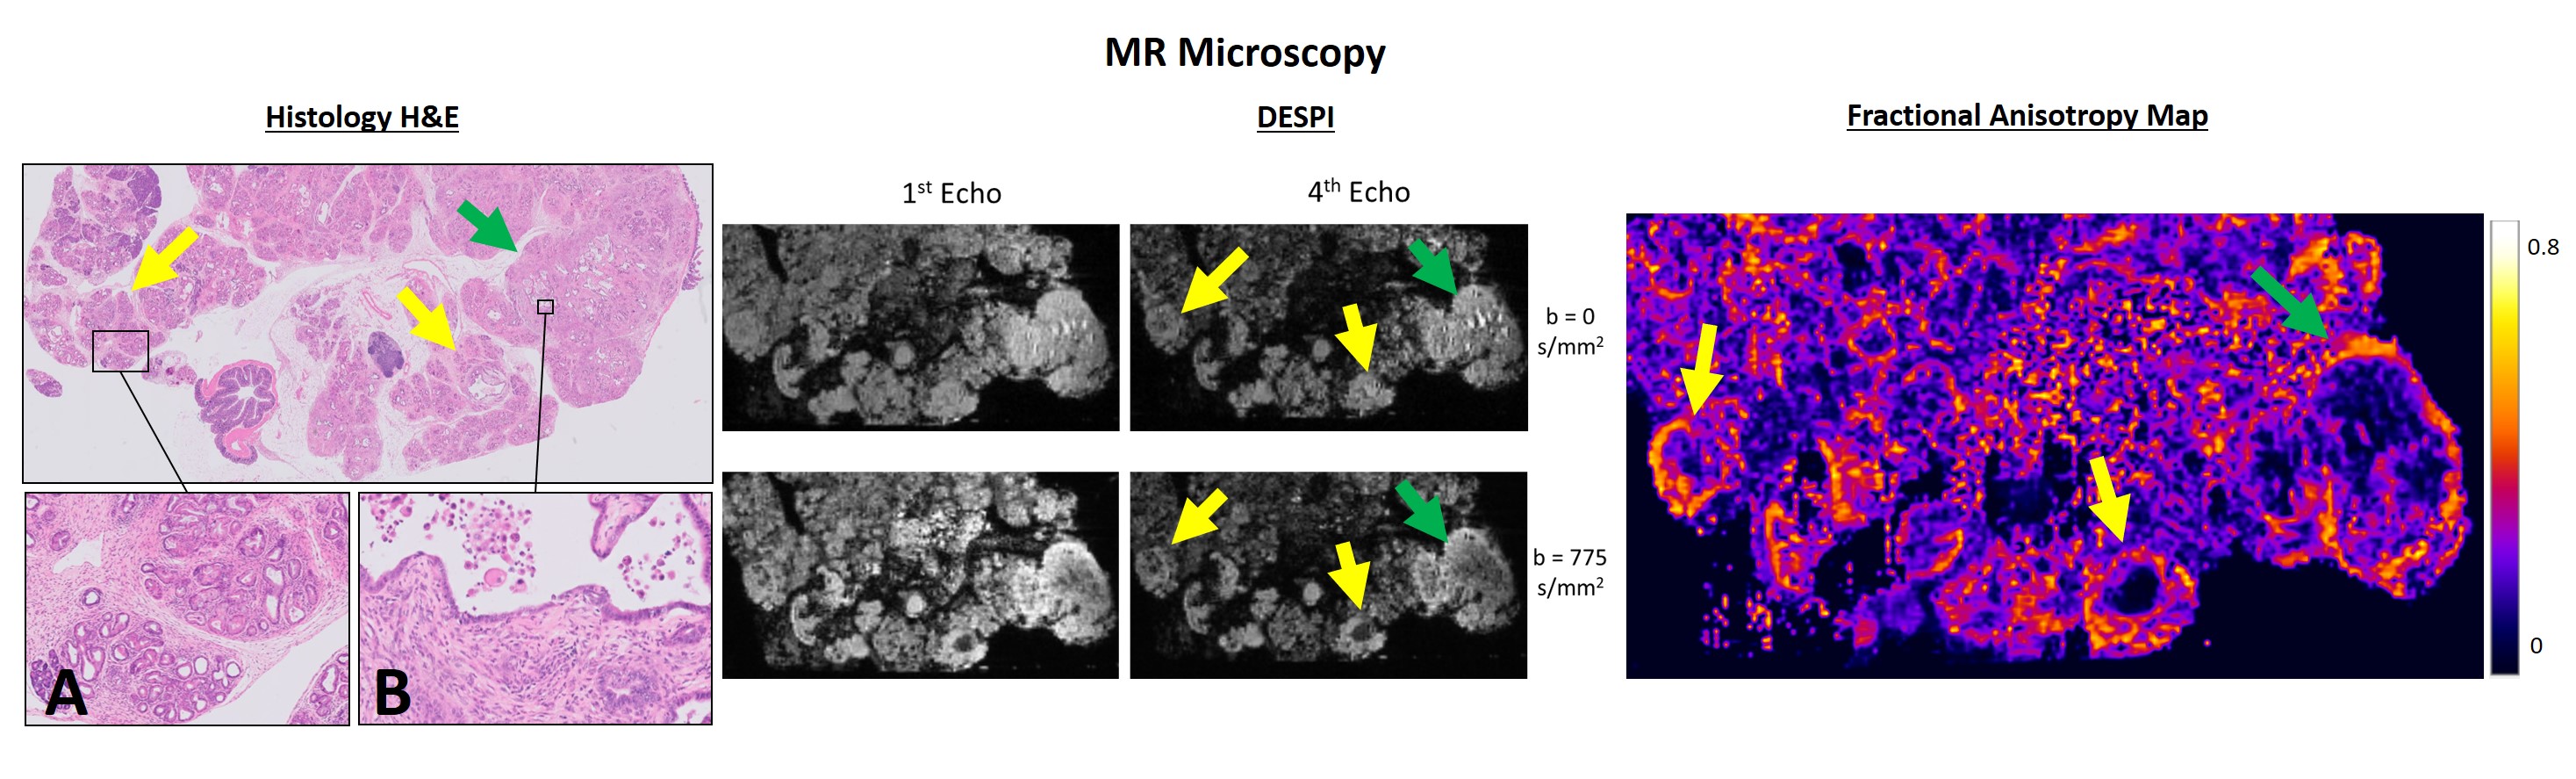
Pancreases were imaged with a 10 mm CryoprobeTM in a 16.4T scanner (Ascend AeonTM, Bruker, Germany). DESPI provided ultrahigh resolution 3D images with both diffusion and T2* contrast (TR/TE = 125/9.2ms; echoes = 4; resolution = (80µm)3; b values = 0 and 775s/mm2; δ= 2ms; Δ = 7ms; 10 diffusion directions).
Histology
Paraffin blocks of the imaged pancreases were sliced with 0.5mm intervals and 5µm thick sections and stained with Hematoxylin and Eosin. Slides were digitalized (Ultra-Fast Scanner™, Philips), evaluated by a gastrointestinal pathologist (18 years of experience) and manually co-registered with MRI by a gastrointestinal radiologist (7 years of experience).
In vivo dMRI
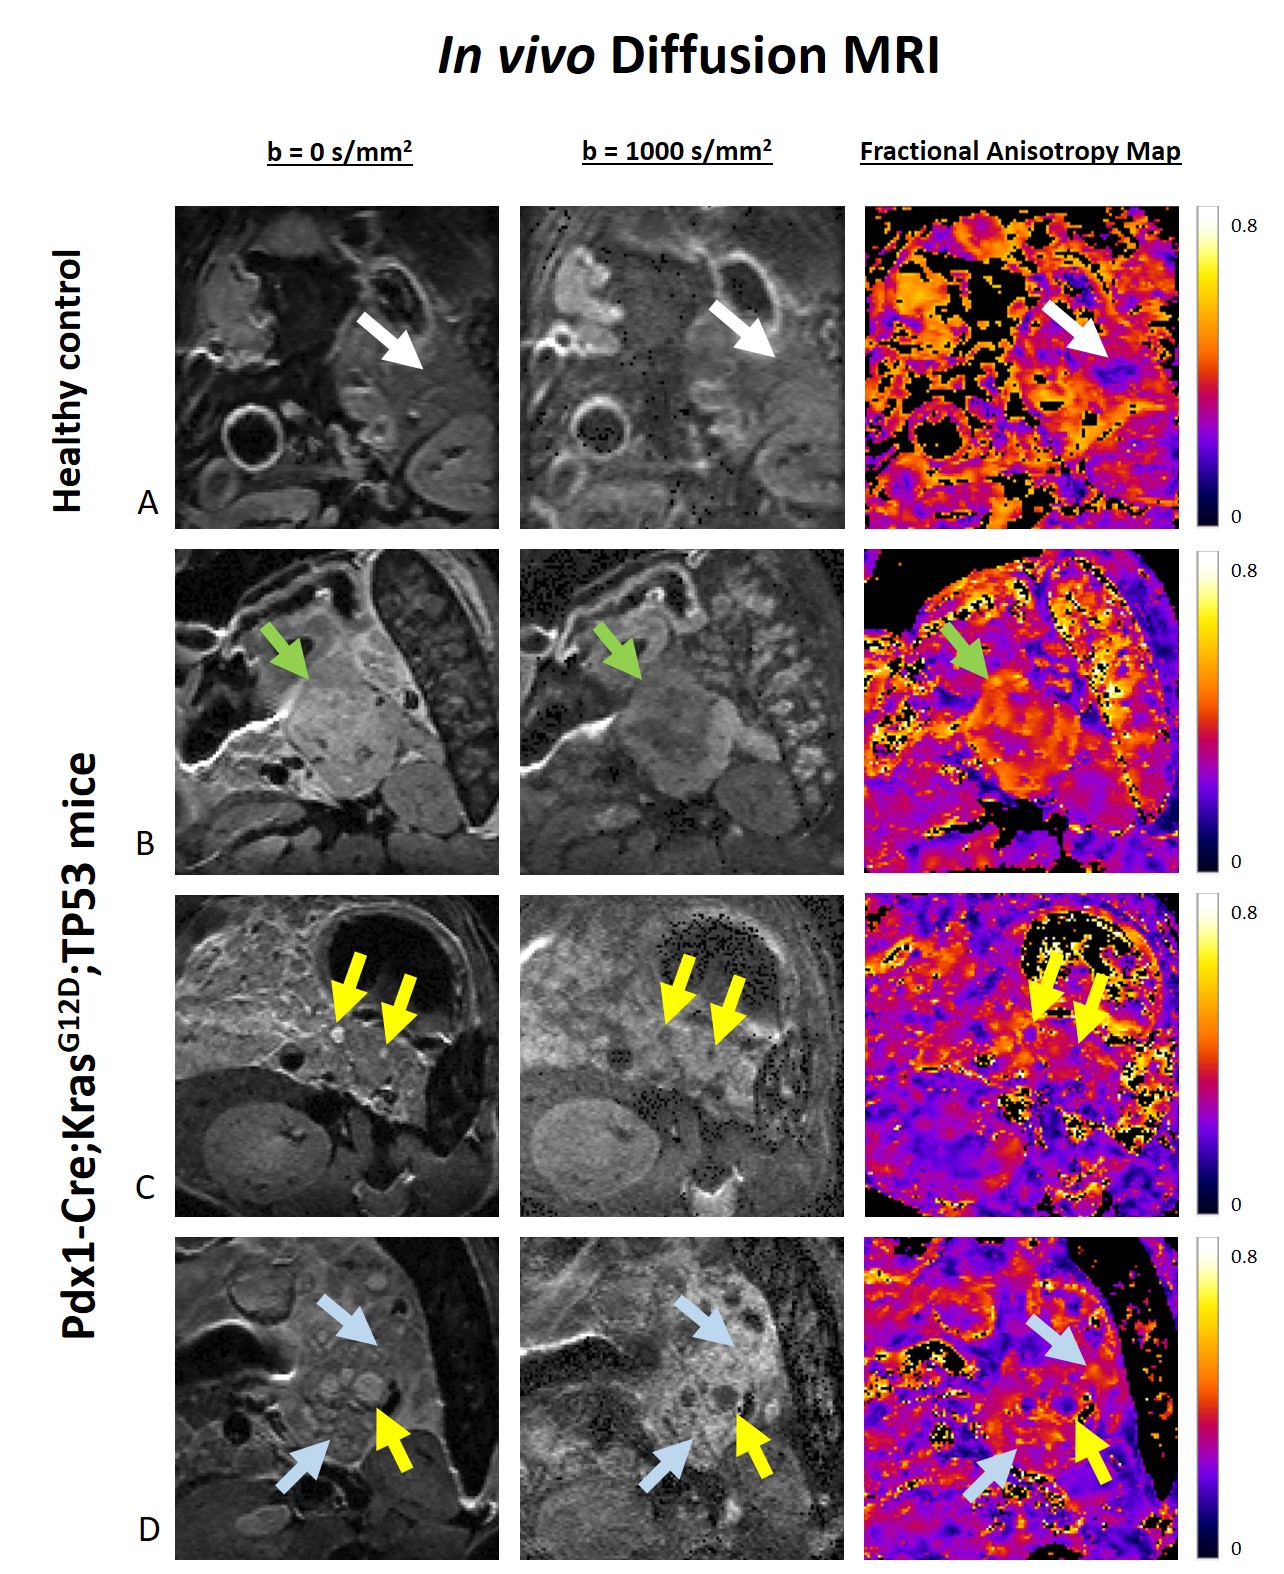
Abdominal MRI was performed in 10-15 weeks-old N=6 Ptf1a-Cre;KrasG12D-TP53 mice (C57BL/6J background) and a healthy 15-weeks-old control, in a 9.4T scanner (BioSpecTM, Bruker, Germany). Hyoscine butylbromide was used for reducing bowel motion (5mg/kg)8. High-resolution DWI-EPI was acquired (TR/TE = 2300/15.6ms; slice thickness = 250µm; resolution = 125x125µm2; 12 diffusion directions; b values = 0 and 1000s/mm2; δ = 3.3ms; Δ = 6ms).
Results
The ex vivo control pancreas presented homogeneous contrast, without any abnormalities (Figure 2). In contrast, transgenic pancreases evidenced multiple nodules with variable size, corresponding to PanINs in a background of acinar-ductal metaplasia (ADM) (Figure 3). Inflammatory infiltrates were also observed, representing acute and chronic pancreatitis.DESPI defined both PanIN and inflammatory infiltrates with high signal intensity in the b=0s/mm2 images, most conspicuous in the 4th echo. Diffusion weighting enabled a clear distinction between PanIN (high signal intensity) and inflammation (low signal intensity). DTI analysis revealed high Fractional anisotropy (FA) at the PanIN periphery, providing even greater contrast with adjacent tissue. PDAC was also detected, producing similar diffusion contrasts to PanIN (Figure 4).
In the in vivo experiments, large lesions were identified in the transgenic pancreases, compatible with PDAC, contrasting with the homogenous pancreas of the control mouse (Figure 5). Similarly to ex vivo findings, these lesions presented high signal intensity in DWI and high anisotropy values. These contrasts could also be observed in much smaller lesions, and diffusely in the pancreatic parenchyma, probably reflecting PanIN in ADM background. Histological validation for these findings is underway.
Discussion
Our results show that PanIN and PDAC can be characterized by dMRI. These contrasts showed high sensitivity for the lesions in ex vivo experiments, and were replicated in vivo.The DESPI contrasts in PanIN and PDAC, especially noticeable ex vivo with mixed T2* contrast and longer echo times, could be explained by high cellularity and fibrotic tissue (restricting diffusion) and increased cellular volumes with intracellular accumulation of mucin (increasing T2* values)5,9. The high FA values in the lesion periphery, correlating with regions with high fibrotic content, could be attributed to a mostly organized deposition of fibrosis in these areas10.
Distinguishing tumoral lesions from inflammation non-invasively has been challenging in clinical practice11, and these contrasts could also provide specific biomarkers for this purpose.
The abdominal MRI experiments revealed that the application of DWI and DTI for characterizing PanIN and PDAC in vivo is feasible. These represent new tools to characterize PanIN and PDAC in transgenic animals, allowing researchers to non-invasively study the tumors’ biology and holding promise for a future translation to clinical practice.
Conclusion
PanIN and PDAC can be characterized in the mouse pancreas with dMRI, both ex vivo and in vivo with excellent contrast, allowing the detection of these lesions and distinction from inflammation. Further development of these findings may establish early biomarkers in pancreatic cancer.Acknowledgements
The authors would like to acknowledge:
Dr. Kevin Harkins and Prof. Mark Does (Institute of Imaging Science, Vanderbilt University, USA), for developing DESPI (https://github.com/remmi-toolbox/remmi-matlab, NIH EB019980);
The Vivarium from Champalimaud Foundation (CONGENTO, Lisboa-01-0145-FEDER-022170);
The Histopathology Platform from Champalimaud Foundation;
Funding: Champalimaud Research and H2020-MSCA-IF-2018, ref:844776.
References
1 - Siegel RL, Miller KD, Jemal A. Cancer statistics, 2020. CA Cancer J Clin 2020;70:7-30.
2 - European Commission. (2018). European Cancer Information System. Available: https://ecis.jrc.ec.europa.eu/explorer.php?$1-AE28$2-All$4-1,2$3-All$6-0,14$5-2008,2008$7-7$0-0$CEstByCancer$X0_8-3$CEstRelativeCanc$X1_8-3$X1_9-AE28. Last accessed November 18, 2020.
3 - Sohn TA, Yeo CJ, Cameron JL, et al. Resected adenocarcinoma of the pancreas-616 patients: results, outcomes, and prognostic indicators. J Gastrointest Surg 2000;4:567–579.
4 - Vullierme M-P, Menassa L, Couvelard A, et al. Non-branched microcysts of the pancreas on MR imaging of patients with pancreatic tumors who had pancreatectomy may predict the presence of pancreatic intraepithelial neoplasia (PanIN): a preliminary study. Eur Radiol 2019;29:5731-5741.
5 - Santiago I, Santinha J, Ianus A, et al. Susceptibility Perturbation MRI Maps Tumor Infiltration into Mesorectal Lymph Nodes. Cancer Res 2019;79:2435-2444.
6 - Colvin EK, Scarlett CJ. A historical perspective of pancreatic cancer mouse models. Semin Cell Dev Biol 2014;27:96-105.
7 – Bilreiro C, Simões R, Fernandes F, et al. Identification of pancreatic intraepithelial neoplasia in the mouse pancreas with MR Microscopy. ISMRM 2020 Virtual Meeting, Communication number 0133.
8 - Bilreiro C, Fernandes F, Andrade L, et al. Hyoscine butylbromide for bowel motion reduction in mouse abdominal MRI. 2020 (Preprint), arXiv:2007.04282.
9 - Kartalis N, Lindholm TL, Aspelin P, Permert J, Albiin N. Diffusion-weighted magnetic resonance imaging of pancreas tumours. Eur Radiol. 2009;19:1981-1990.
10 - Ianuş A, Santiago I, Galzerano A, et al. Higher-order diffusion MRI characterization of mesorectal lymph nodes in rectal cancer. Magn Reson Med 2020;84:348-364.
11 - Barral M, Taouli B, Guiu B, et al. Diffusion-weighted MR imaging of the pancreas: Current status and recommendations. Radiology. 2015;274:45-63.
Figures