0699
DR-HIGADOS: a new diffusion-relaxation framework for clinically feasible microstructural imaging of the liver1Radiomics Group, Vall d'Hebron Institute of Oncology, Vall d'Hebron Barcelona Hospital Campus, Barcelona, Spain, 2NMR Lab, Vall d'Hebron Institute of Oncology, Vall d'Hebron Barcelona Hospital Campus, Barcelona, Spain, 3Prostate Cancer Translational Research Group, Vall d'Hebron Institute of Oncology, Vall d'Hebron Barcelona Hospital Campus, Barcelona, Spain, 4Cellular Plasticity and Cancer Group, Vall d'Hebron Institute of Oncology, Vall d'Hebron Barcelona Hospital Campus, Barcelona, Spain, 5IDI (Institut de Diagnòstic per la Imatge), Catalonia, Spain, 6Department of Radiology, Hospital Universitari Vall d'Hebron, Barcelona, Spain, 7Siemens Healthineers, Madrid, Spain, 8Hospital Universitari de Bellvitge, L'Hospitalet de Llobregat, Spain, 9Molecular Oncology Group, Vall d'Hebron Institute of Oncology, Vall d'Hebron Barcelona Hospital Campus, Barcelona, Spain
Synopsis
Liver cancer is a leading cause of cancer-related death, and new quantitative MRI (qMRI) techniques are needed to inform treatment selection and monitor disease progression. We propose a new technique, Diffusion-Relaxation Hepatic Imaging via Generalisable Assessment of DiffusiOn Simulations (DR-HIGADOS), with the aim of improving sensitivity and biological specificity of liver qMRI. DR-HIGADOS is a diffusion-relaxation method that uses information from Monte Carlo simulations to map parameters of an extended intra-voxel incoherent motion model to microstructural indices (e.g. cell size, cellularity). DR-HIGADOS is demonstrated on multi-vendor clinical data, and its histological correlates are investigated on preclinical high-field scans.
Introduction
Magnetic Resonance Imaging (MRI) plays an increasingly crucial role in the detection, staging and monitoring of liver cancer1,2, a leading cause of cancer-related death3,4. Nonetheless, the latest quantitative MRI (qMRI) approaches lack of sensitivity and specificity to early microscopic tumorigenic processes, and as a result invasive biopsies are still routine5. New non-invasive imaging assays are urgently required to optimise the use of biopsies, which have complications, and to better inform clinical management and treatment selection.In this work we propose a new microstructural imaging framework, Diffusion-Relaxation Hepatic Imaging via Generalisable Assessment of DiffusiOn Simulations (DR-HIGADOS), with the aim of improving the sensitivity and biological specificity of liver qMRI. DR-HIGADOS provides indices of average cell size and density, potentially useful in oncology, in clinical feasible scan times. We provide a clinical demonstration of the technique and investigate its histological correlates on preclinical data.
Methods
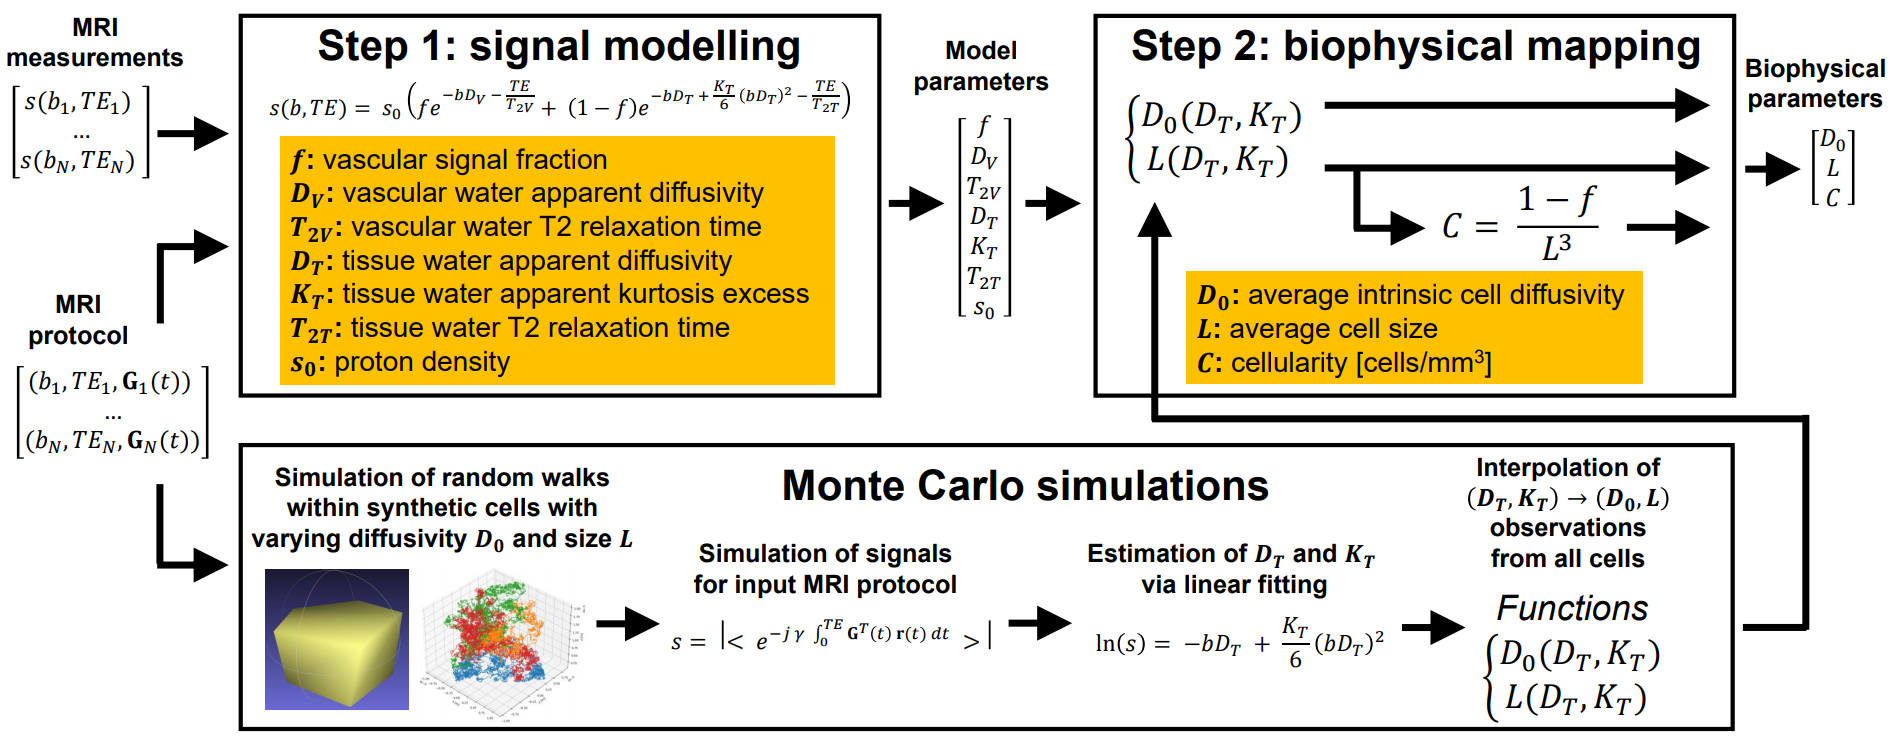
FrameworkDR-HIGADOS is a two-step framework (Figure 1).
- Step 1: MRI signal modelling
The signal at b-value $$$b$$$ and echo time $$$TE$$$ is modelled as:
$$
s(b,TE)\,\,\,=\,\,\,s_0\left(\,fe^{\,-\,bD_V \,\,-\,\frac{TE}{T_{2V}}} \,\,+\,\,(1-f)e^{\,-\,bD_T\,\,+\,\frac{K_T}{6}(bD_T)^2 \,\,-\,\frac{TE}{T_{2T}}} \right).\,\,\,\,[Eq.\,1]
$$
Eq. 1 unifies the T2-IVIM6 and IVIM-Kurtosis7 extensions of the intra-voxel incoherent motion (IVIM) model8. Parameters are: $$$s_0$$$ (proton density); $$$f$$$ (vascular signal fraction); $$$T_{2V}/T_{2T}$$$ (vascular/tissue water T2, s.t. $$$T_{2V}>T_{2T}$$$ ); $$$D_{V}/D_{T}$$$ (vascular/tissue apparent diffusivity, s.t. $$$D_{V}>D_{T}$$$, $$$D_{V} \geq D_{\mathrm{Free\,water}}$$$); $$$K_T$$$ (tissue apparent kurtosis). These are estimated from measurements performed at varying $$$(b,TE)$$$ using deep neural networks (qMRI-Net toolbox9), which enable fast and robust computation10.
- Step 2: biophysical mapping
Model parameters from Eq. 1 are mapped to cell-specific biophysical properties11,12, deriving voxel-wise average cell diffusivity $$$D_0$$$, average cell size $$$L$$$ and cellularity
$$
C \,\,\,=\,\,\, \frac{\,\,1 - f\,\,}{L^3}\,\,\,\,[Eq.\,2]
$$
in [cells/mm3].
Specifically, a mapping $$$(D_T,K_T) \rightarrow (D_0,L)$$$ is established using two functions derived from Monte Carlo simulations as follows.
• Random walks $$$\mathrm{\mathbf{r}}(t)$$$ are simulated with the MCDC simulator13 within synthetic cells (cell size $$$L \in [11; 60]$$$ μm; cell diffusivity $$$D_0 \in [0.20; 2.40]$$$ μm2 ms–1; cell shapes modelled by 15 perturbations of regular prisms with square/pentagonal/hexagonal bases).
• Synthetic signals are computed for the DW protocol of interest, featuring a diffusion gradient waveform $$$\mathrm{\mathbf{G}}(t)$$$, as the ensemble average
$$
s\,\,\,=\,\,\, \left | \, < e^{-j\gamma \int_{0}^{TE} \mathrm{\mathbf{G}}^T(t)\,\mathrm{\mathbf{r}}(t)\,dt} > \, \right |\,\,\,\,[Eq.\,3]
$$
over random walks at fixed $$$(D_0,L)$$$.
• $$$D_T$$$ and $$$K_T$$$ are estimated from synthetic signals by linear fitting of
$$
\mathrm{ln}(s)\,\,\,=\,\,\, -\,b\,D_T \,\,+\,\, \frac{K_T}{6}(b\,D_T)^2.\,\,\,\,[Eq.\,4]
$$
• Interpolation of observations $$$(D_T,K_T) \rightarrow (D_0,L)$$$ from all cells estimates the $$$D_0(D_T,K_T)$$$ and $$$L(D_T,K_T)$$$ functions.
Clinical demonstration
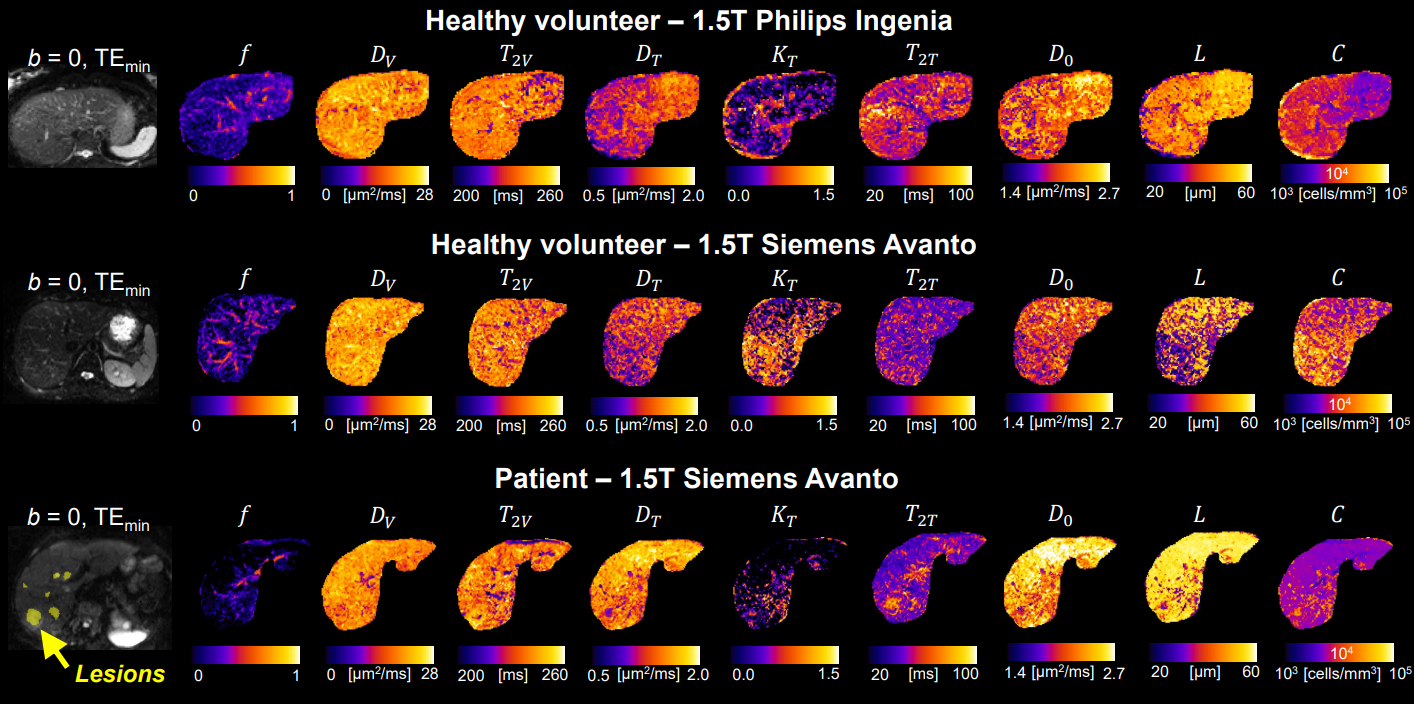
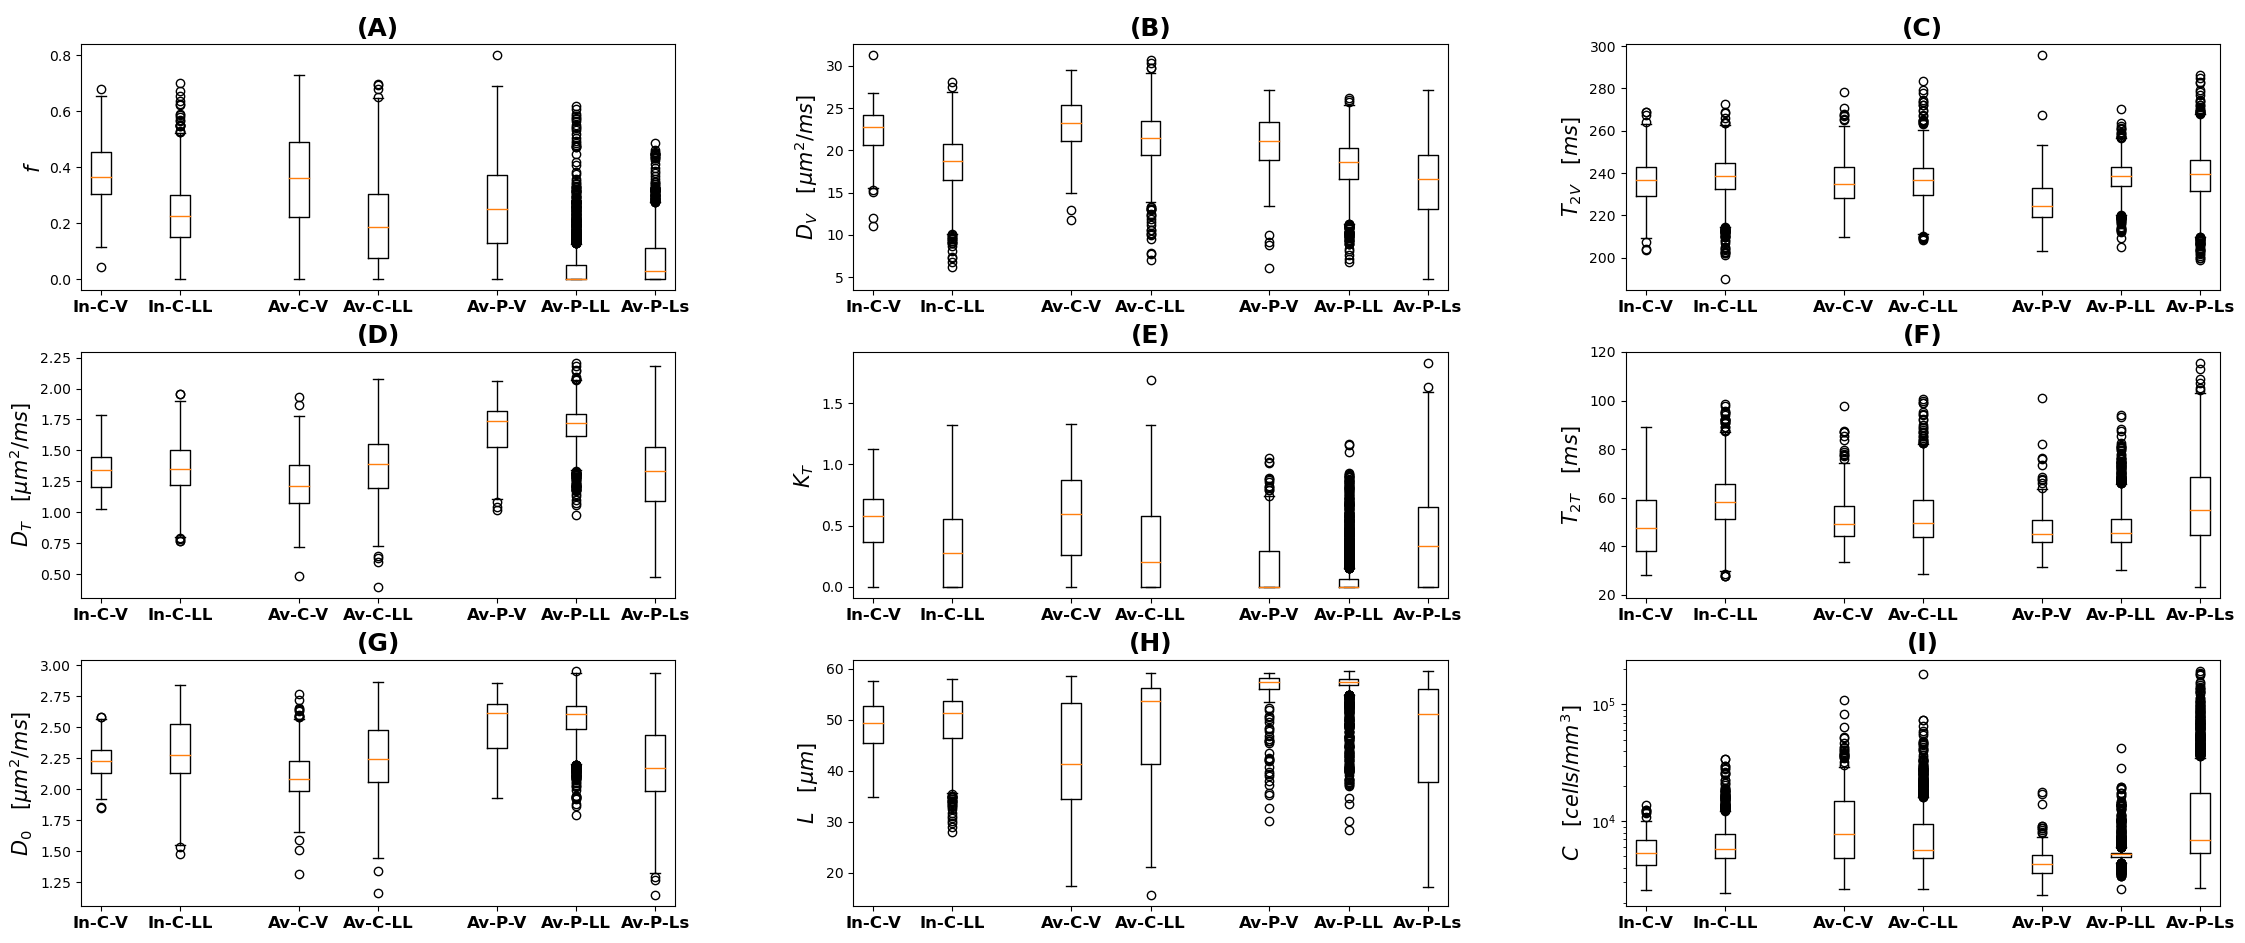
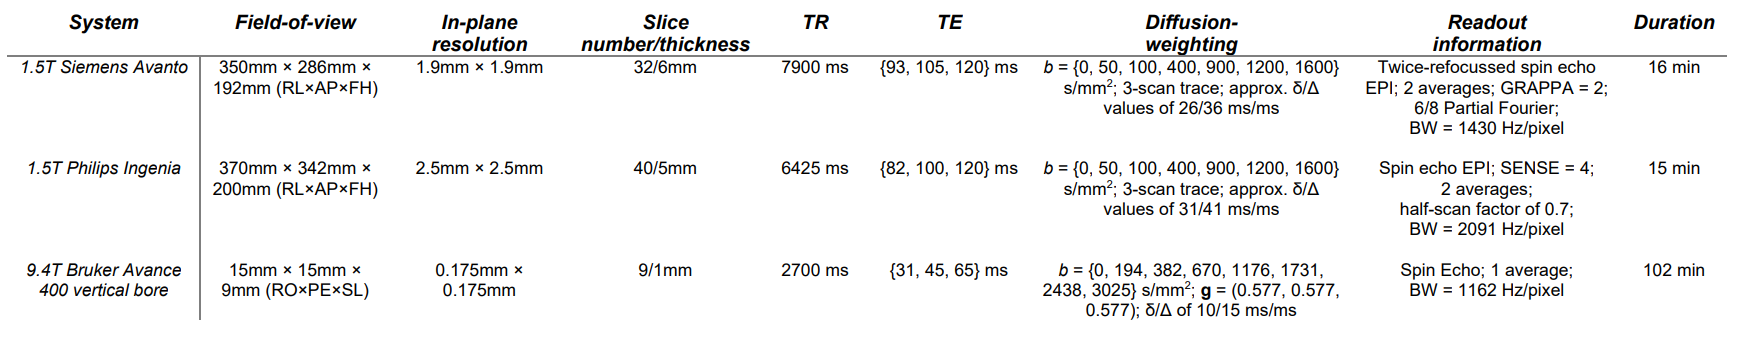
We demonstrate DR-HIGADOS on two healthy volunteers (24 y.o. male, 37 y.o. female) and on one female patient (84 y.o., metastatic disease), who were scanned on two MRI machines (1.5T Siemens Avanto, male volunteer, patient; 1.5T Philips Ingenia, female volunteer; protocols: Table 1). Scans were post-processed (denoising14; Rician bias mitigation15; Gibbs unringing16; motion correction) and DR-HIGADOS metrics computed. Regions-of-interest (ROIs) were manually drawn (V: large vessels; LL: left lobule, normal-appearing in the patient; Ls: patient's lesions) to characterise metric distributions.
Preclinical validation
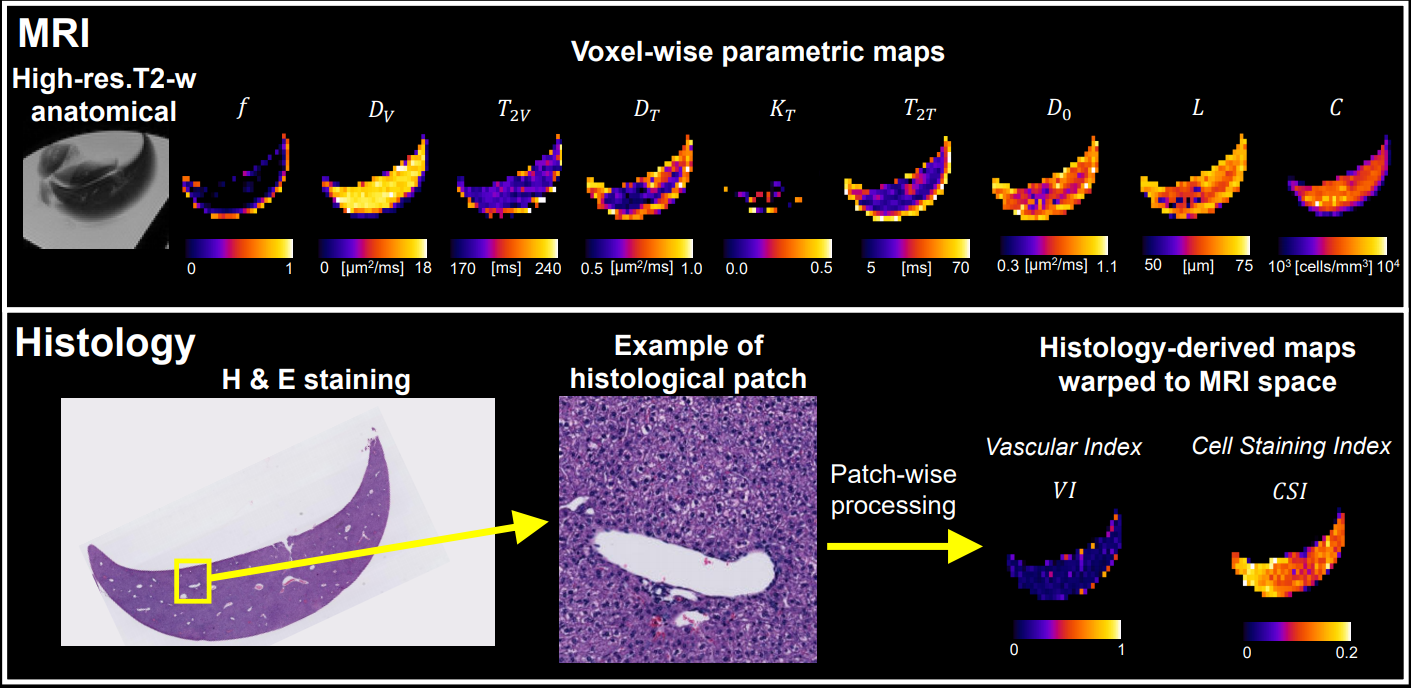
We scanned fixed livers from two non-pathological C57BL/6J mice at room temperature in PBS on a 9.4T Bruker Avance 400 vertical-bore system (protocol: Table 1). Scans were post-processed (denoising14; Rician bias mitigation15; Gibbs unringing16) and DR-HIGADOS metrics computed. Digital images of HE-stained histological sections were obtained at known radiographic position from one liver and analysed with k-means17, obtaining a vascular index ($$$VI$$$) and a cell staining fraction ($$$CSI$$$) within patches matching the MRI resolution. These were co-registered to MRI and related to DR-HIGADOS metrics within ROIs, drawn manually away from edges.
Results and discussion
Clinical demonstrationFigure 2 shows examples of DR-HIGADOS metrics in humans, while Figure 3 reports distributions of the metrics within different ROIs as box plots. Maps from the two vendors are qualitatively similar and demonstrate known anatomical features, e.g. a rich vascular network across the whole organ. We observe non-zero tissue kurtosis $$$K_T$$$ , evidence of non-Gaussian diffusion. In the patient, tumours feature smaller cell sizes and higher cellularity as compared to normal-appearing tissue, in line with known histopathology18. Metrics values in patient's normal-appearing ROIs (Av-P-LL) exhibit qualitative differences as compared to the corresponding ROI in the control scanned on the same system (Av-C-LL). Overall, cell size is on the order of 35-55µm in healthy volunteers, at the upper part of the spectrum of known hepatic cell size19. This is expected given the stronger signal contribution of the largest cells20.
Preclinical validation
Figure 4 shows examples of DR-HIGADOS and histological metrics from preclinical data. The vascular fraction captures partial volume with PBS, while the estimated cell sizes (of the order of 65µm) are larger than values observed in humans, in line with known inter-species differences19,21,22. Histology-derived $$$VI$$$ and $$$CSI$$$ show similar qualitative contrasts as $$$f$$$ and $$$C$$$. $$$VI$$$ correlates with $$$f$$$ (r=0.73, p=0.002) and $$$CSI$$$ with $$$C$$$, albeit not significantly (r=0.41, p=0.13).
Conclusions
DR-HIGADOS holds promise for clinically-relevant microstructural imaging of the liver in oncology, showing robust histological translation. Future work is warranted to characterise the clinical utility of the framework in larger cohorts and to expand the MRI-histology comparison.Acknowledgements
This project was supported by the investigator-initiated PREdICT study at the Vall d'Hebron Institute of Oncology (Barcelona) funded by AstraZeneca. FG is funded by PREdICT. KB is funded by a Beatriu de Pinós post-doctoral grant (2019BP/00182). RPL is supported by a CRIS Foundation Talent Award (TALENT19-05), the Instituto de Salud Carlos III-Investigación en Salud (PI18/01395) and the Prostate Cancer Foundation Young Investigator Award. The authors are thankful to the volunteers and to all technicians, clinical fellows and research nurses for their help. The authors acknowledge the support of Siemens Healthineers and Philips Healthcare for assistance in protocol development.References
[1] W. A. Curtis, T. J. Fraum, H. An, Y. Chen, A. S. Shetty, and K. J. Fowler, “Quantitative MRI of Diffuse Liver Disease: Current Applications and Future Directions”, Radiology, vol. 290, no. 1, pp. 23–30, Jan. 2019, doi: 10.1148/radiol.2018172765.
[2] J. S. Witt, S. A. Rosenberg, and M. F. Bassetti, “MRI-guided adaptive radiotherapy for liver tumours: visualising the future”, Lancet Oncol., vol. 21, no. 2, pp. e74–e82, Feb. 2020, doi: 10.1016/S1470-2045(20)30034-6.
[3] A. Forner, M. Reig, and J. Bruix, “Hepatocellular carcinoma”, Lancet, vol. 391, no. 10127, pp. 1301–1314, Mar. 2018, doi: 10.1016/S0140-6736(18)30010-2.
[4] L. Li and H. Wang, “Heterogeneity of liver cancer and personalized therapy”, Cancer Lett., vol. 379, no. 2, pp. 191–197, Sep. 2016, doi: 10.1016/j.canlet.2015.07.018.
[5] E. B. Tapper and A. S. F. Lok, “Use of Liver Imaging and Biopsy in Clinical Practice”, N. Engl. J. Med., vol. 377, no. 8, pp. 756–768, Aug. 2017, doi: 10.1056/NEJMra1610570.
[6] N. P. Jerome et al., “Extended T2-IVIM model for correction of TE dependence of pseudo-diffusion volume fraction in clinical diffusion-weighted magnetic resonance imaging”, Phys. Med. Biol., vol. 61, no. 24, pp. N667–N680, Dec. 2016, doi: 10.1088/1361-6560/61/24/N667.
[7] Y. Liu et al., “Comparative Study of Monoexponential, Intravoxel Incoherent Motion, Kurtosis, and IVIM-Kurtosis Models for the Diagnosis and Aggressiveness Assessment of Prostate Cancer”, Front. Oncol., vol. 10, Sep. 2020, doi: 10.3389/fonc.2020.01763.
[8] D. Le Bihan, E. Breton, D. Lallemand, P. Grenier, E. Cabanis, and M. Laval-Jeantet, “MR imaging of intravoxel incoherent motions: application to diffusion and perfusion in neurologic disorders”, Radiology, vol. 161, no. 2, pp. 401–407, Nov. 1986, doi: 10.1148/radiology.161.2.3763909.
[9] F. Grussu, M. Battiston, M. Palombo, T. Schneider, C. A. M. Gandini Wheeler-Kingshott, and D. C. Alexander, “Deep learning model fitting for diffusion-relaxometry: a comparative study”, Proc of Computational Diffusion MRI 2020 (in production).
[10] S. Barbieri, O. J. Gurney‐Champion, R. Klaassen, and H. C. Thoeny, “Deep learning how to fit an intravoxel incoherent motion model to diffusion‐weighted MRI”, Magn. Reson. Med., vol. 83, no. 1, pp. 312–321, Jan. 2020, doi: 10.1002/mrm.27910.
[11] E. Fieremans, J. H. Jensen, and J. A. Helpern, “White matter characterization with diffusional kurtosis imaging”, Neuroimage, vol. 58, no. 1, pp. 177–188, Sep. 2011, doi: 10.1016/j.neuroimage.2011.06.006.
[12] M. Palombo et al., “New paradigm to assess brain cell morphology by diffusion-weighted MR spectroscopy in vivo”, Proc. Natl. Acad. Sci., vol. 113, no. 24, pp. 6671–6676, Jun. 2016, doi: 10.1073/pnas.1504327113.
[13] J. Rafael-Patino, D. Romascano, A. Ramirez-Manzanares, E. J. Canales-Rodríguez, G. Girard, and J.-P. Thiran, “Robust Monte-Carlo Simulations in Diffusion-MRI: Effect of the Substrate Complexity and Parameter Choice on the Reproducibility of Results”, Front. Neuroinform., vol. 14, Mar. 2020, doi: 10.3389/fninf.2020.00008.
[14] J. Veraart, D. S. Novikov, D. Christiaens, B. Ades-aron, J. Sijbers, and E. Fieremans, “Denoising of diffusion MRI using random matrix theory”, Neuroimage, vol. 142, pp. 394–406, Nov. 2016, doi: 10.1016/j.neuroimage.2016.08.016.
[15] C. G. Koay and P. J. Basser, “Analytically exact correction scheme for signal extraction from noisy magnitude MR signals”, J. Magn. Reson., vol. 179, no. 2, pp. 317–322, Apr. 2006, doi: 10.1016/j.jmr.2006.01.016.
[16] E. Kellner, B. Dhital, V. G. Kiselev, and M. Reisert, “Gibbs-ringing artifact removal based on local subvoxel-shifts”, Magn. Reson. Med., vol. 76, no. 5, pp. 1574–1581, Nov. 2016, doi: 10.1002/mrm.26054.
[17] F. Grussu et al., “Neurite dispersion: A new marker of multiple sclerosis spinal cord pathology?”, Ann. Clin. Transl. Neurol., 2017, doi: 10.1002/acn3.445.
[18] N. Terayama, T. Terada, and Y. Nakanuma, “Histologic growth patterns of metastatic carcinomas of the liver”, Jpn. J. Clin. Oncol., 1996, doi: 10.1093/oxfordjournals.jjco.a023174.
[19] N. Kruepunga, T. B. M. Hakvoort, J. P. J. M. Hikspoors, S. E. Köhler, and W. H. Lamers, “Anatomy of rodent and human livers: What are the differences?”, Biochim. Biophys. Acta - Mol. Basis Dis., vol. 1865, no. 5, pp. 869–878, May 2019, doi: 10.1016/j.bbadis.2018.05.019.
[20] J. Veraart et al., “Noninvasive quantification of axon radii using diffusion MRI”, Elife, vol. 9, Feb. 2020, doi: 10.7554/eLife.49855.
[21] H. Imamura, S. Kawasaki, J. Shiga, Y. Bandai, K. Sanjo, and Y. Idezuki, “Quantitative evaluation of parenchymal liver cell volume and total hepatocyte number in cirrhotic patients”, Hepatology, vol. 14, no. 3, pp. 448–453, Sep. 1991, doi: 10.1002/hep.1840140308.
[22] N. C. Martin, C. T. McCullough, P. G. Bush, L. Sharp, A. C. Hall, and D. J. Harrison, “Functional analysis of mouse hepatocytes differing in DNA content: Volume, receptor expression, and effect of IFN”, J. Cell. Physiol., vol. 191, no. 2, pp. 138–144, May 2002, doi: 10.1002/jcp.10057.
Figures