0698
Evaluate the micro-vascular invasion in HCC with a Fractional Order Calculus DWI Model1Zhongshan Hospital affiliated to Fudan University, Shanghai, China, 2Central Research Institute, United Imaging Healthcare, Shanghai, China
Synopsis
The determination of micro-vascular invasion (MVI) in patients with hepatocellular carcinoma (HCC) is significant for prognostic prediction. However, histologic assessment is the gold standard for evaluating the MVI, which is accompanied with many disadvantages including invasiveness, potential sampling bias and so forth. DWI MRI has shown clinical potential for assessing the MVI. However, some recently-developed non-gaussian DWI techniques have hardly been applied for predicting the MVI. This research, hence, sought to evaluate the MVI with a Fractional Order Calculus DWI Model (FROC-DWI). The results indicated that FROC-derived parameters were valuable for accurately identifying the MVI in patients with HCC.
Introduction
Because of the high incidence and mortality, accurate prognostic prediction plays the significant role in the clinical management of HCC. During the past few decades, MVI has been broadly regarded as an important risk factor closely associated with the prognosis of HCC.1 However, current gold standard for assessing the MVI has many insurmountable disadvantages containing invasiveness, time consumption and potential sampling bias. Imaging techniques with complementary advantages, thus, have attracted innumerable attention. As a powerful functional MRI technique, DWI has been widely applied in hepatic imaging with capability of noninvasively providing the characterization of cellularity, vascularity and micro-structural heterogeneity.2 For instance, apparent diffusion coefficient (ADC) calculated with conventional mono-exponential DWI can be utilized to quantify the cellularity. Kurtosis coefficient derived from diffusion kurtosis imaging (DKI) is able to characterize the heterogeneity. Recently, a non-gaussian DWI technique, Fractional Order Calculus DWI Model (FROC-DWI) was developed and applied in tumor grading, lesion differentiation, therapeutic efficacy evaluation.3-5 There are three parameters derived from FROC-DWI including the fractional order derivative in space (β), the diffusion coefficient (D) and the spatial parameter (μ). Nevertheless, hardly has FROC-DWI been applied in hepatic imaging. This research, thus, aims to evaluate the MVI in HCC with FROC-DWI. To the best of our knowledge, FROC-DWI has never been utilized for predicting the MVI in HCC.Methods
From November 2019 to August 2020, 56 patients with HCC were enrolled into this prospective study. All the MRI examinations were carried out with a commercial 3.0 T scanner. (uMR 770, United Imaging Healthcare). FROC-DWI was based a spin echo (SE) echo planner imaging (EPI) sequence with following detained parameters: TE/TR/Flip angle: 70 ms/ 4000 ms/ 90°, matrix: 300×380, Field of view: 300×380 mm2, b values: 0, 100, 200, 500, 800, 1500 and 2000 s/mm2. The parametric maps were calculated according to the previous research. The region of interest (ROI) was defined by two experienced abdominal radiologists. Then the Shapiro-Wilk test was performed to evaluate the data normality. The student t test was conducted to evaluate whether there were significant differences of different FROC-DWI parameters in various subgroups. Receiver operative characteristics (ROC) analysis was then utilized to quantify the diagnostic performance of FROC-derived parameters for diagnosing the patients with MVI.Results
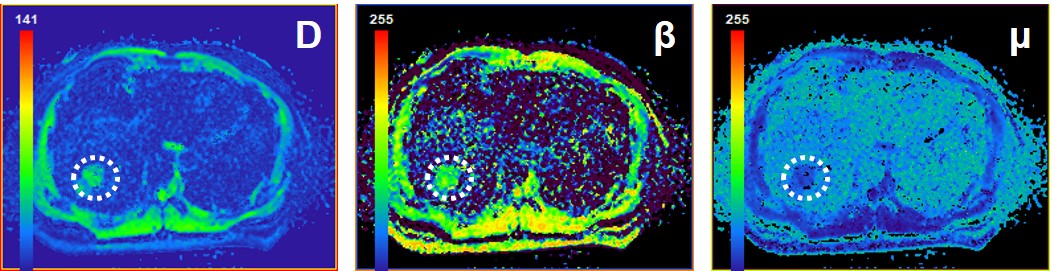
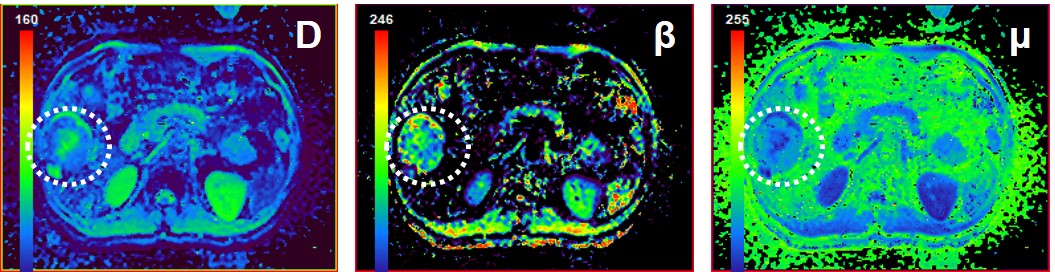
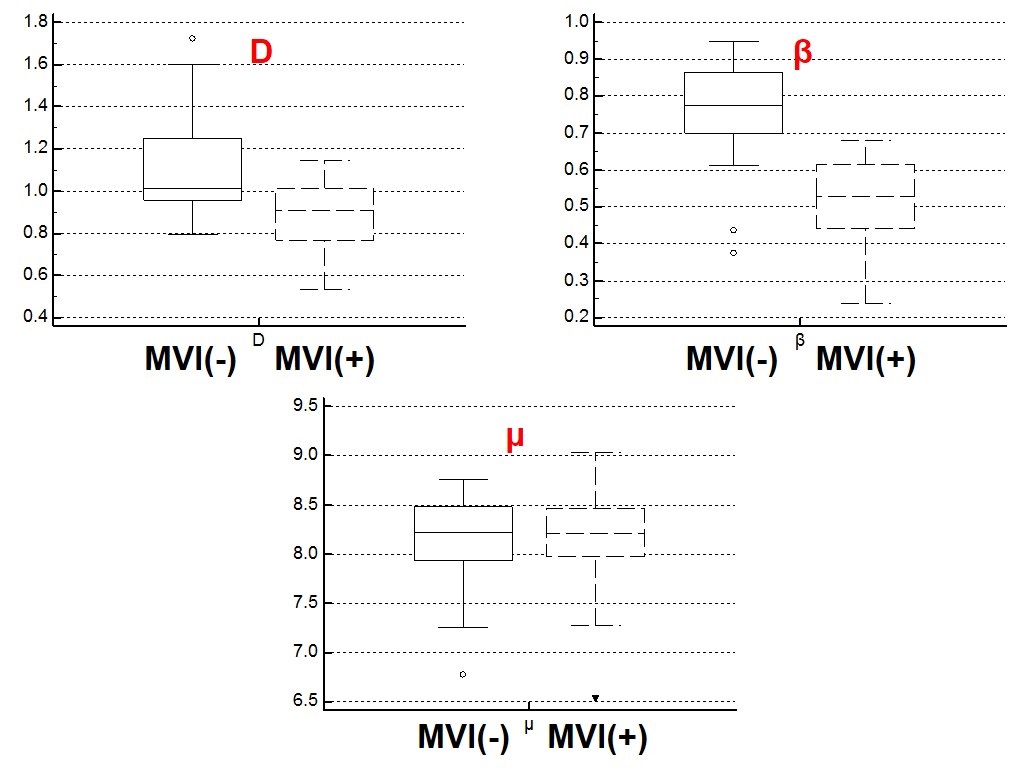
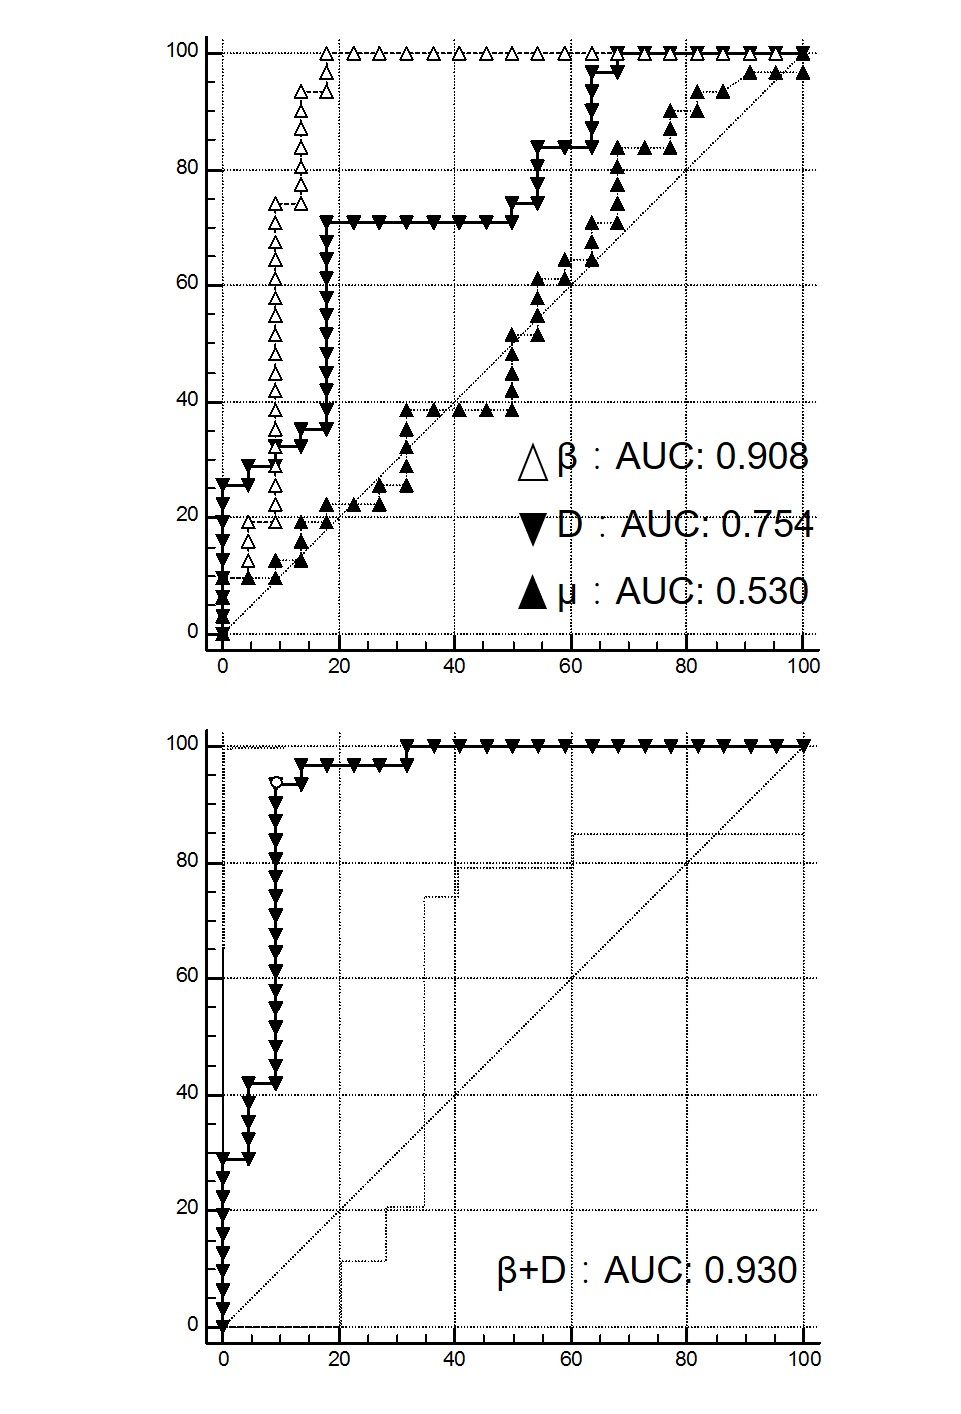
Representative FROC-derived parametric images of one patient without MVI and another patient with MVI were displayed in Figure 1 and Figure 2, respectively. As Figure 3 shows, the significantly lower β value and D value were observed in the patients with MVI with regard to those in patients without MVI. (DMVI(-): 1.12±0.26 ×10⁻³ mm2/s, DMVI(+): 0.89±0.16 ×10⁻³ mm2/s, p < 0.05; βMVI(-): 0.75±0.14, βMVI(+): 0.51±0.12, p < 0.05; ) There was no significant difference of μ in the two subgroups (p > 0.05). The β value showed an area under the ROC curve of 0.908. The D value showed an area under the ROC curve of 0.754 (Figure 4). The combination of D and β yielded an area under the ROC curve of 0.930 (Figure 4).Discussion
The highlights of this research are as the followings: 1) This is the first example of utilizing the FROC-DWI for assessing the MVI in HCC. 2) The results indicated that FROC-derived parameters may serve as valuable diagnostic markers for predicting the MVI in HCC, which holds great potential in guiding the clinical management of HCC. The results showed that lower D and β were observed in the patients with MVI. Potential causes were as followings: 1) FROC-derived D value has similar biological insights to the ADC value calculated from the conventional DWI. Thus, D indirectly characterizes the cellular density.4 Low D values indicate there is a highly-restricted diffusion caused by increased cellular density. Previous studies indicated that positive MVI is much common in malignant HCC with increased cellular density and nucleo-cytoplasmic ratio. 2) FROC-derived β provides a quantification of heterogeneity.3 Specifically, β displays a negative correlation with the heterogeneity. The decreased β values suggested that there was an increased heterogeneity. Plenty of researchers have concluded that positive MVI is much common in malignant HCC with increased heterogeneity.6 Furthermore, the combination of D and β resulted in the better diagnostic performance, which can be explained by the followings: The combination of D and β may lead to a more comprehensive characterization of tumor from both the perspectives of cellular density and heterogeneity.Conclusion
This research suggested that FROC-DWI holds huge potential in noninvasively assessing the MVI in HCC.Acknowledgements
NoneReferences
1. Suh YJ, Kim MJ, Choi JY, Park MS, Kim KW. Preoperative prediction of the microvascular invasion of hepatocellular carcinoma with diffusion‐weighted imaging. Liver Transplant 2012;18(10):1171-1178.
2. Tang L, Zhou XJ. Diffusion MRI of cancer: From low to high b‐values. Journal of Magnetic Resonance Imaging 2019;49(1):23-40.
3. Sui Y, Wang H, Liu G, et al. Differentiation of low-and high-grade pediatric brain tumors with high b-value diffusion-weighted MR imaging and a fractional order calculus model. Radiology 2015;277(2):489-496.
4. Bickelhaupt S, Steudle F, Paech D, et al. On a fractional order calculus model in diffusion weighted breast imaging to differentiate between malignant and benign breast lesions detected on X-ray screening mammography. PloS one 2017;12(4):e0176077.
5. Tang L, Sui Y, Zhong Z, et al. Non‐Gaussian diffusion imaging with a fractional order calculus model to predict response of gastrointestinal stromal tumor to second‐line sunitinib therapy. Magnetic resonance in medicine 2018;79(3):1399-1406.
6. Wang WT, Yang L, Yang ZX, et al. Assessment of Microvascular Invasion of Hepatocellular Carcinoma with Diffusion Kurtosis Imaging. Radiology 2018;286(2):571-580.
Figures