0697
Biomimetic phantoms of impeded diffusion in prostate cancer using lipid nanoparticles1Department of Radiology, University of Michigan, Ann Arbor, MI, United States, 2CIRS, Norfolk, VA, United States
Synopsis
PI-RADS guidelines use quantitative mono-exponential apparent diffusion coefficient (ADC) for risk stratification of small potentially aggressive prostate cancer (PCa). Inherently, multi-exponential diffusion in complex tumor microenvironment, limits accuracy of ADC-based thresholds and clinical utility of DWI acquisition protocols. Biomimetic phantoms that provide ground-truth diffusion parameters help establish accuracy of advanced multi-b DWI protocols and parametric diffusion models in prostate tumors. This work demonstrates development of stable phantoms based on lipid nanoparticles that provide diffusion parameter ranges typical of PCa.
Introduction
The typical 2x2x4 mm3 voxel of a clinical prostate cancer (PCa) MRI scan contains ~1020 water molecules in multiple, micro-scale tissue compartments possessing complicated diffusive motions. The probability distribution function of all water in the prostate tissue voxel is often modeled by non-Gaussian dispersion (1,2) and/or multiple diffusion compartments (2,3). Wide clinical adoption of quantitative diffusion metrics derived from these advanced diffusion models (3,4) requires protocol optimization and accuracy assessment (5) based on ground-truth parameter values provided by phantoms (6). Such phantoms would also help evaluate acquisition and analysis protocol bias for mono-exponential (ME) apparent diffusion coefficient (ADC) measurements utilized by current prostate imaging-reporting data system (PI-RADS) (7,8). We present here studies of stable lipid nanoparticles with diameters and concentrations tuned to mimic apparent diffusion (Da) and kurtosis (Ka) values observed in different PCa stages.Methods
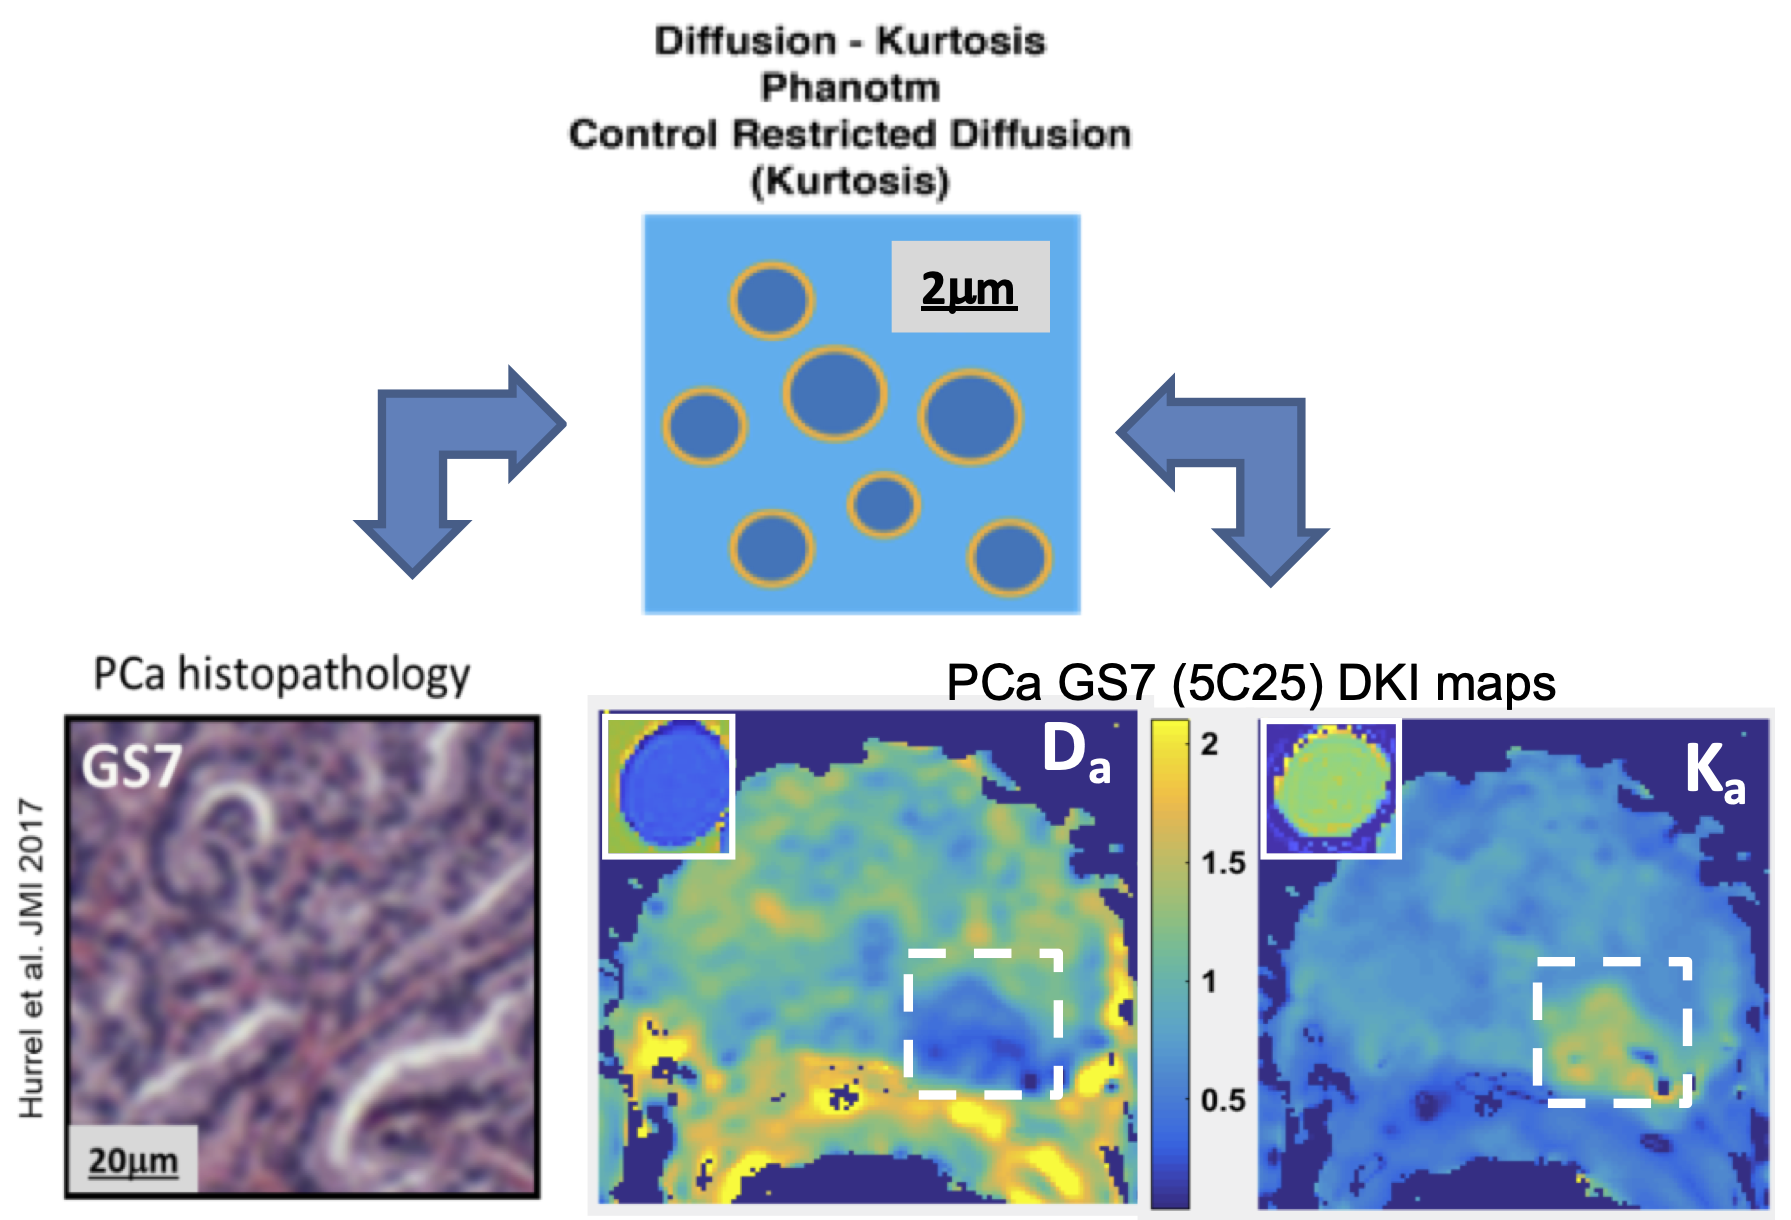
Biomimetic phantom: The phantom components, lipid nanoparticles made with high-molecular weight alcohols and surfactants, combine to provide regions of relatively freely diffusing water and water restricted to the nanoparticle interior. The diameters and concentrations of the nanoparticles can be tuned to generate a broad range of desirable diffusion parameters. Here we target Da and Ka values similar to different stages of PCa tissues, but other values are possible, as previously discussed (6,9). Eleven distinct phantom samples were manufactured from cetearyl alcohol (CA), behentrimethyl ammonium chloride (BTAC), stearylamidoproply dimethylamine (SD) and cetyltrimethyl ammonium bromide (CTAB). CA:SD:BTAC lipid nanoparticles were made with 7:1:1 molar ratios and total solid concentrations between 0.5% and 2.0% (w/w). CA:CTAB molar ratios were between 5:1 and 2:1 and solid concentrations between 0.5% and 2.5%(w/w).Phantom and in vivo DWI: The phantom DWI were acquired using b-values between 0 and 3 ms/μm2, TR/TE (10/0.105 s), and 1.7x1.7x5 mm3 voxels. In vivo multi-b DWI prostate cancer (PCa) data sets were shared by University of Wisconsin Quantitative Imaging Network (QIN) team through The Cancer Imaging Archive (TCIA) as de-identified DICOM. The corresponding PCa DWI were acquired (8) using 15 b-values between 0 and 2 ms/μm2, TR/TE (4/0.068 s) and 1.5x1.5x4 mm3 voxels. The PCa tumor lesion labels were assigned from deep annotation histopathology (8). DWI for six prostates that had both Gleason score 6 (GS6) and GS7 lesions >1cm3 in peripheral zone (PZ) were used for the PCa diffusion parameter estimates. A schematic representation of the phantom vesicles, their correspondence to histology for multi-compartment modeling, and MRI parametric maps of Da and Ka in PCa GS7 is shown in Figure 1.
Data analysis: The phantom DWI parameters were compared to PCa for conventional ADC and isotropic kurtosis model parameters: apparent diffusion, Da ,and kurtosis, Ka . Linear least squares fits were performed for log-signal of DWI voxels according to mono-exponential (ME): log(FADC) - b x ADC; and diffusion kurtosis: -Dab + Ka(Dab)2/6; models. The maximum b-value constraint bmax< 3/(DaKa) was implemented for DK model by iterative fitting, using b > 0.1 ms/μm2 (1,6). Data analysis utilized MATLAB R2015b curve-fitting toolboxes (Mathworks, Natick MA).
Results and Discussion
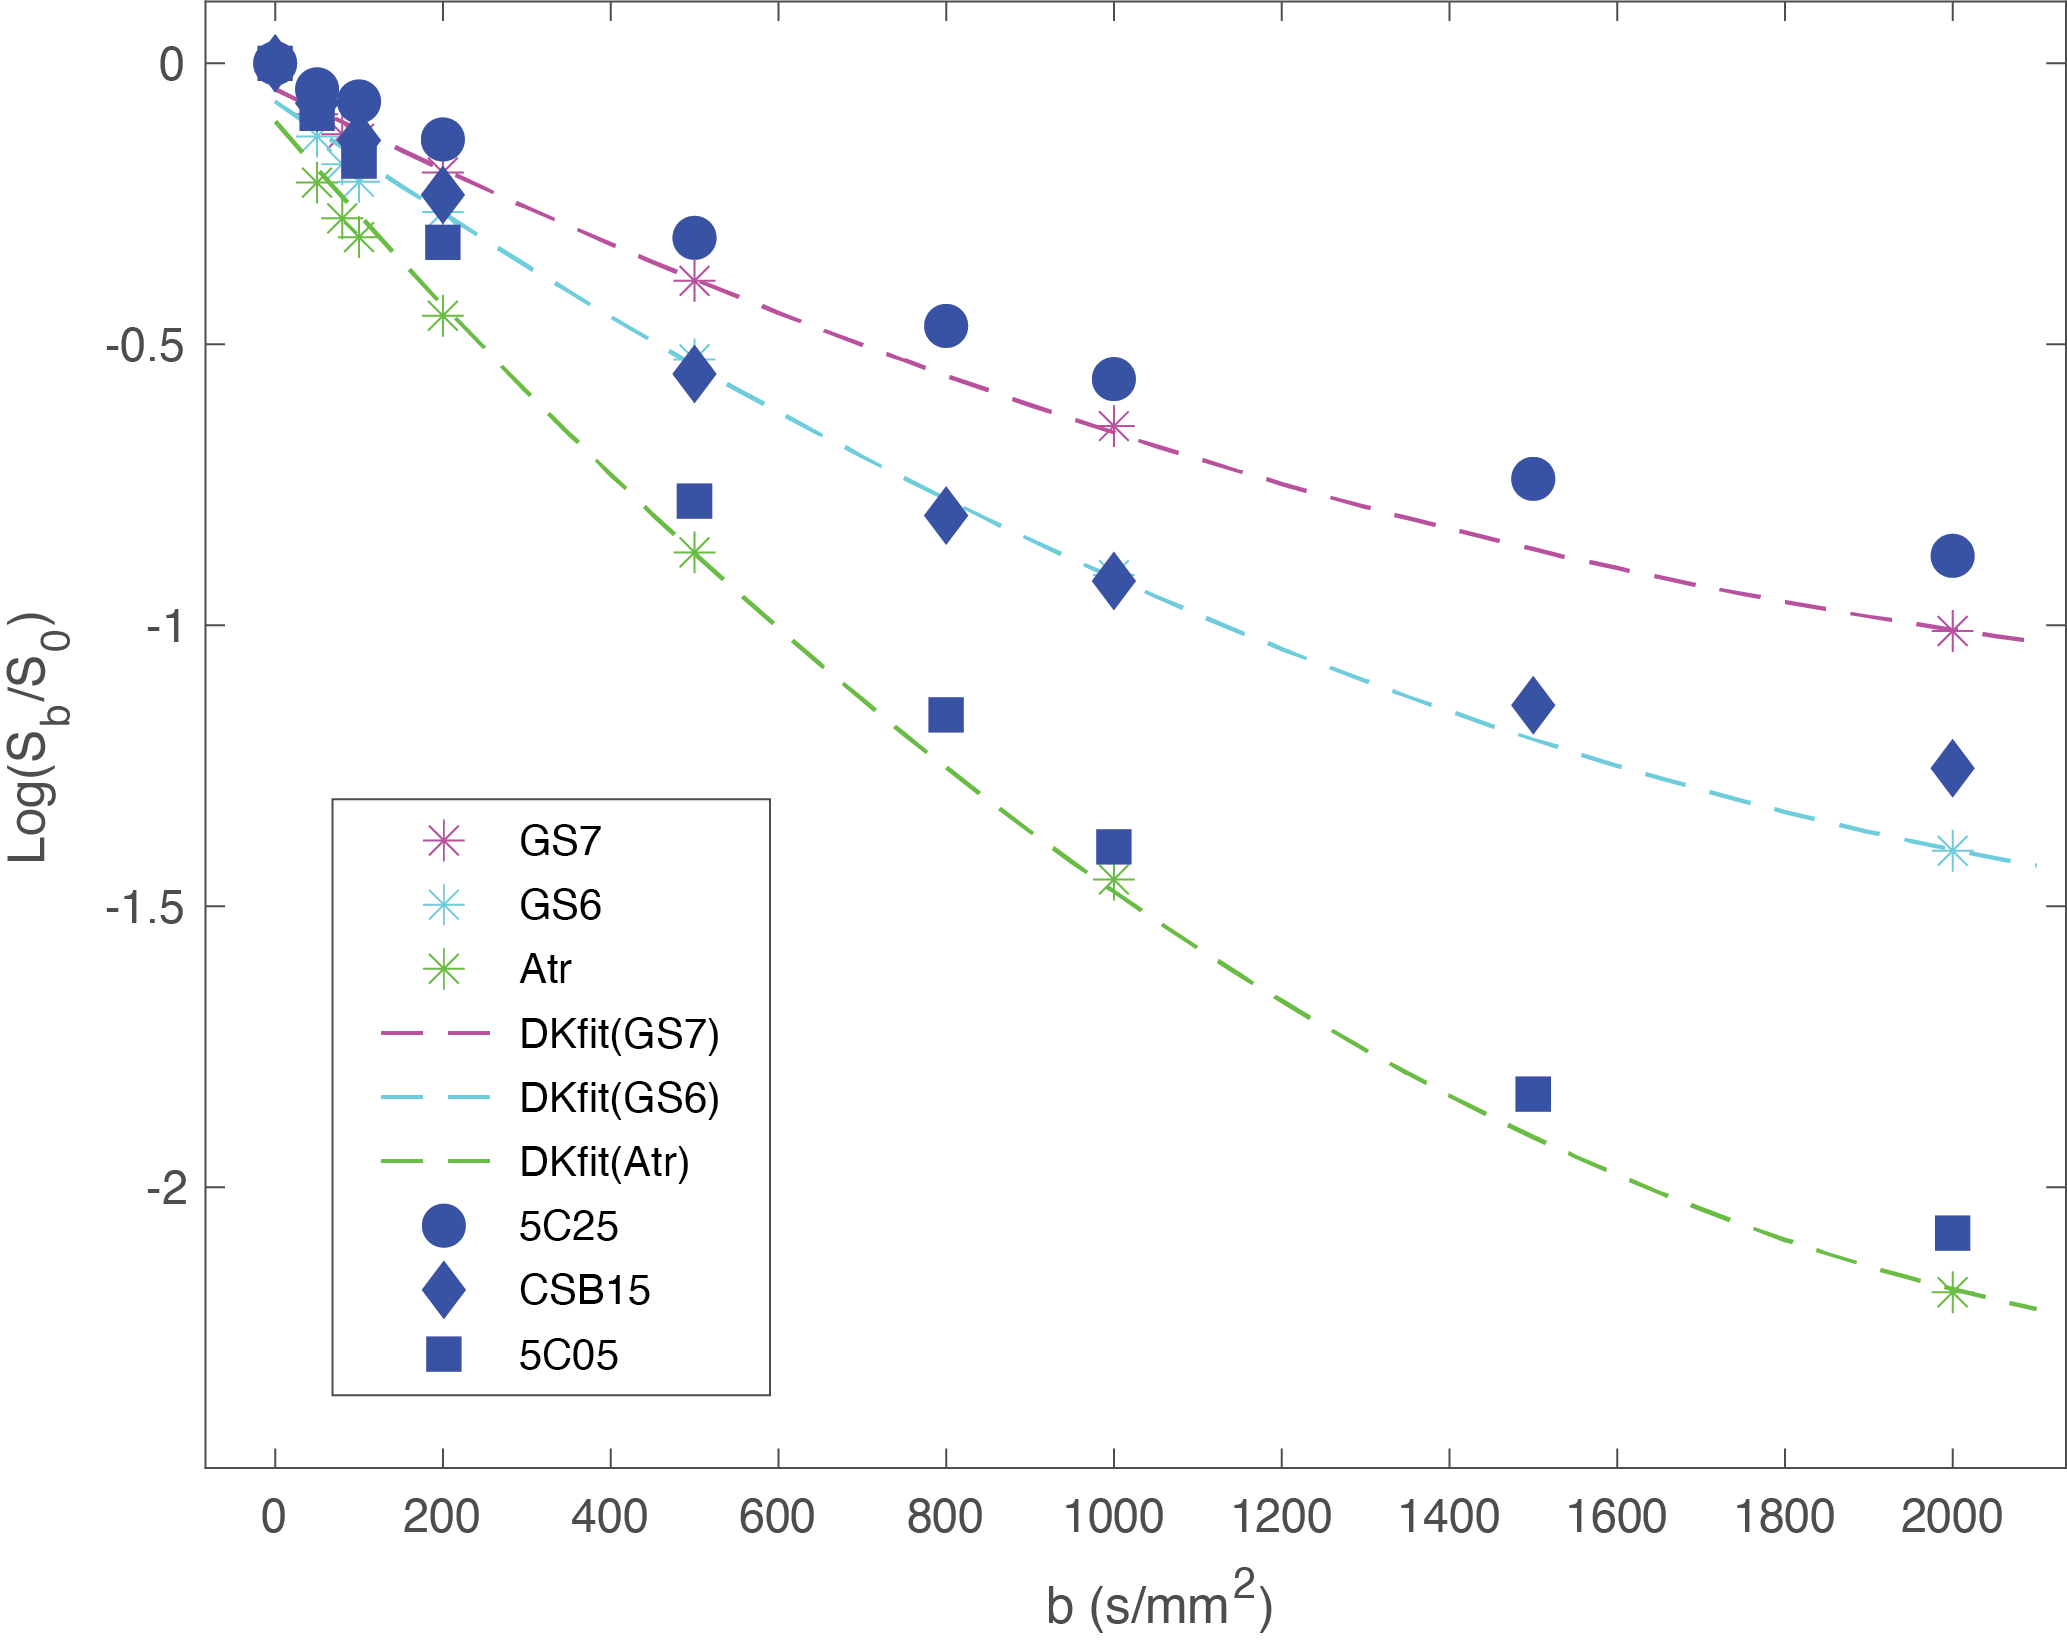
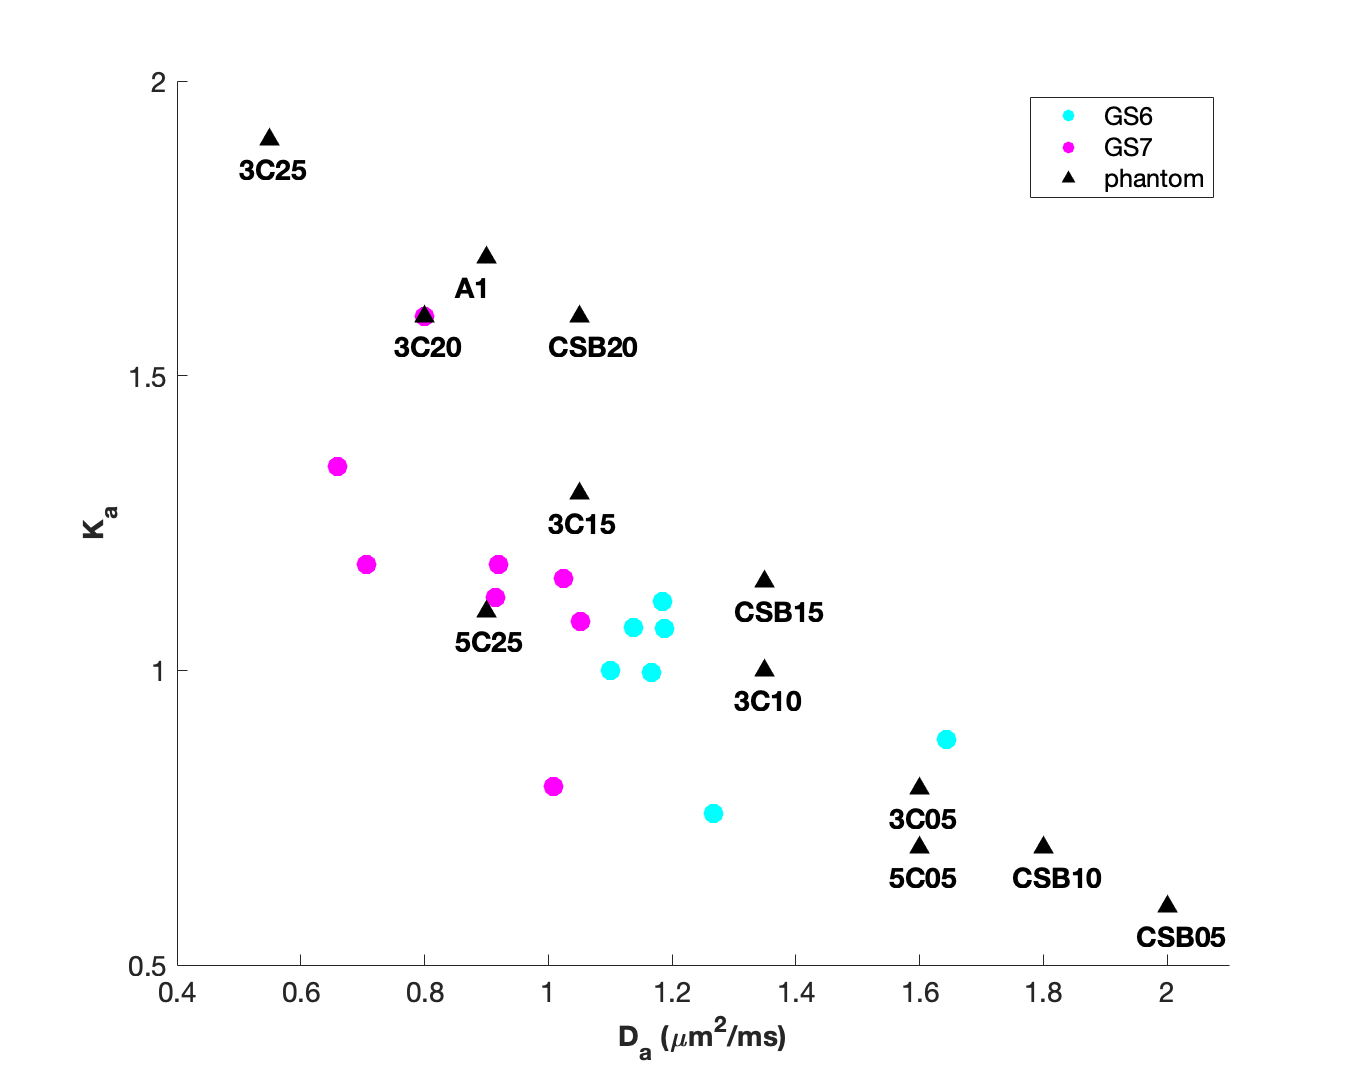
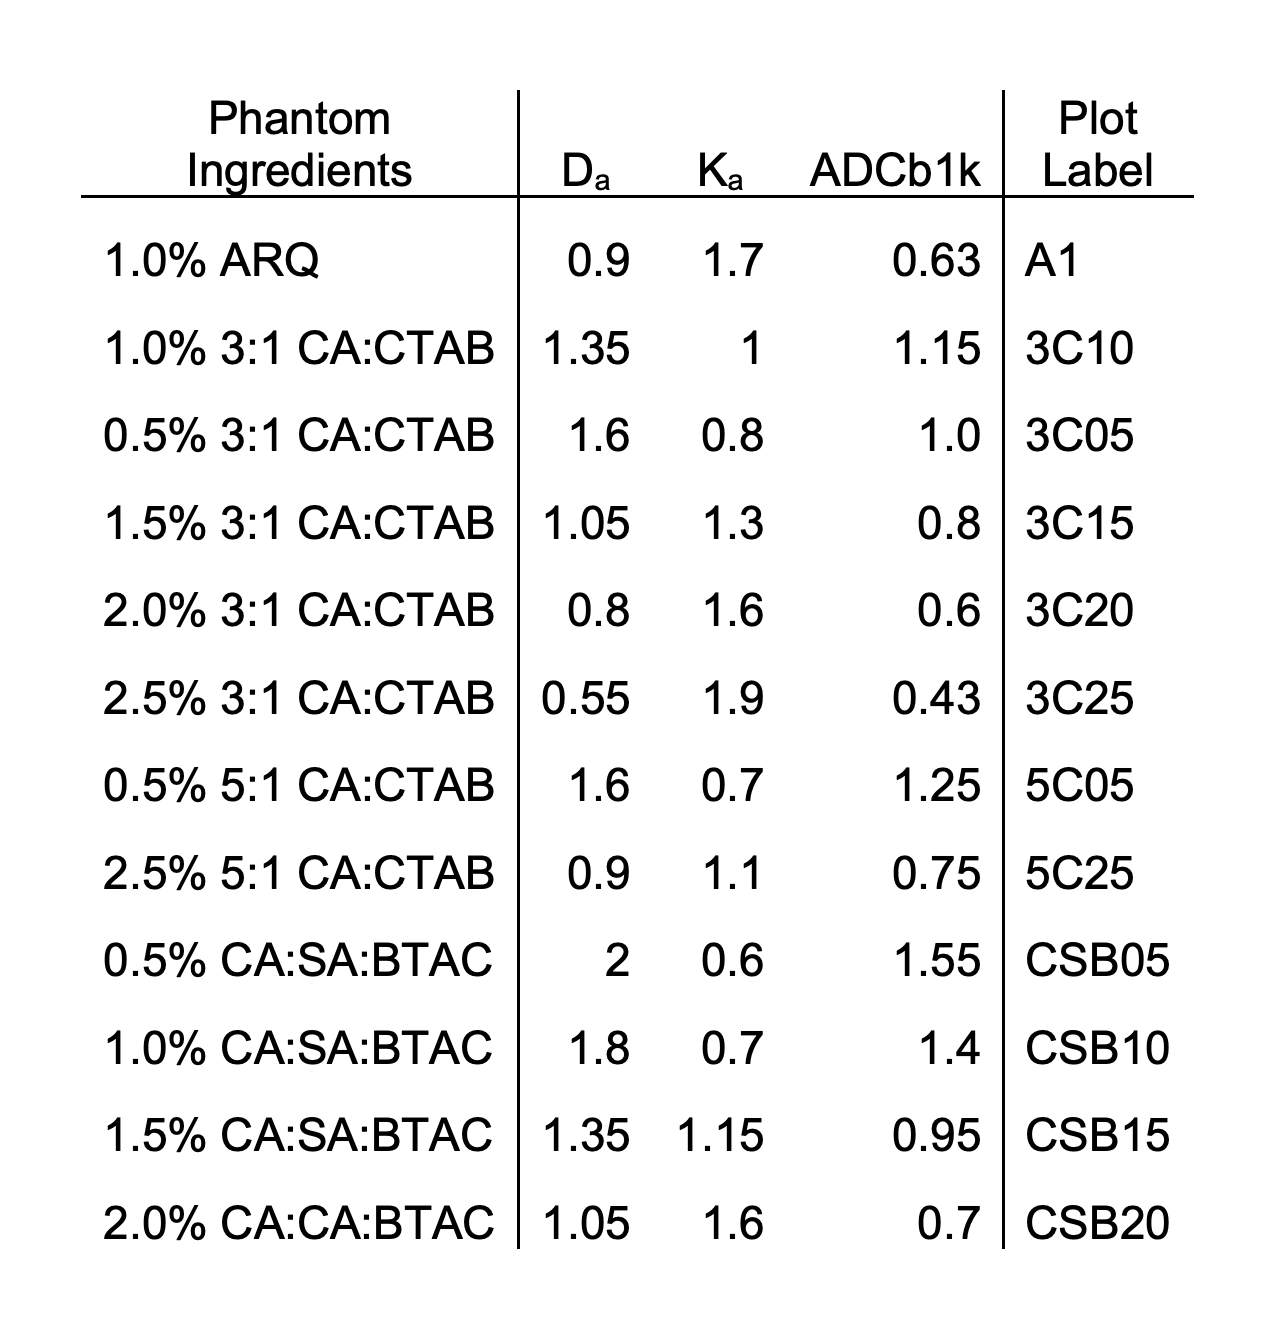
The compositions and concentrations of the lipid nanoparticle phantom materials span the range of diffusion and kurtosis values found in PCa. Decay of MRI signal due to diffusion in the selected phantom materials is multi-exponential and shown to be very similar to DWI signal decay due to impeded diffusion at high b-values for PCa in GS6 and GS7 PZ lesions and in regions of atrophy (Figure 2). This enables quantitative evaluation of ME fit model biases for ADC, depending on b-range. Figure 3 provides an overlay of the scatter plot of Da vs Ka parameters estimated from all six GS6 and GS7 PCa lesions (circles) with similar Da, Ka parameters for the phantom materials (triangles). The DK fit parameter values and labels of the phantom materials in Fig. 3 are detailed in Table 1. These biomimetic, nanoparticle phantom materials are shown to provide similar results to the parameters estimate in prostate cancers. In addition, the phantoms have proven to be stable over a months-long time frame, continuing to yield the same Da and Ka estimated values.Conclusion
The lipid nanoparticle phantom materials presented here faithfully mimic the complicated DWI signal decay representative of PCa tumor microenvironment. The developed set of materials provides diffusion-kurtosis behavior typical of PCa.Acknowledgements
Funding support from National Institutes of Health Grants: U01CA166104, U24CA237683, and U01 CA211205, and University of Michigan Basic Radiologic Sciences pilot project fund. We thank our Quantitative Imaging Network (QIN) collaborator, Dr. Peter LaViolette (Medical College of Wisconsin) for providing access to multi-b DWI DICOM for histology-confirmed prostate cancer through The Cancer Imaging Archive (TCIA).References
1. Jensen JH, Helpern JA. MRI quantification of non-Gaussian water diffusion by kurtosis analysis. NMR Biomed. 2010; 23: 698–710.
2. Iima M, Le Bihan D. Clinical Intravoxel Incoherent Motion and Diffusion MR Imaging: Past, Present, and Future. Radiology. 2016; 278(1):13-32.
3. Panagiotaki E, Chan RW, Nikolaos Dikaios N, et al. Microstructural Characterization of Normal and Malignant Human Prostate Tissue With Vascular, Extracellular, and Restricted Diffusion for Cytometry in Tumors Magnetic Resonance Imaging. Inv. Rad. 2015;50: 218–227.
4. Hectors SJ, Semaan S, Song C, Lewis S, et al. Advanced Diffusion-weighted Imaging Modeling for Prostate Cancer Characterization: Correlation with Quantitative Histopathologic Tumor Tissue Composition-A Hypothesis-generating Study. Radiology 2018;286(3):918-28.
5. Raunig, D.L., et al., Quantitative imaging biomarkers: a review of statistical methods for technical performance assessment.Stat Methods Med Res, 2015. 24(1): p. 27-67.
6. Malyarenko DI, Swanson SD, Konar AS, LoCastro E, Paudyal R, Liu MZ, Jambawalikar SR, Schwartz LH, Shukla-Dave A, Chenevert TL. Multicenter Repeatability Study of a Novel Quantitative Diffusion Kurtosis Imaging Phantom. Tomography. 2019;5:36-43.
7. Barkovich EJ, Shankar PR, Westphalen AC. A Systematic Review of the Existing Prostate Imaging Reporting and Data System Version 2 (PI-RADSv2) Literature and Subset Meta-Analysis of PI-RADSv2 Categories Stratified by Gleason Scores. Am J Roentgenol. 2019;212(4):847-54.
8. Hurrel SL, McGarry SD, Amy Kaczmarowski A, Iczkowsk KA, et al. Optimized b-value selection for the discrimination of prostate cancer grades, including the cribriform pattern, using diffusion weighted imaging. J Med. Imaging 5(1), 011004.
9. Swanson S, Malyarenko D, Chenevert T. Tunable diffusion kurtosis in lamellar vesicle suspensions: Toward development of quantitative phantom surrogate of tumor microenvironment. Proc. Intl Soc Mag Reson Med 2019, TP3632, Montreal CA.
Figures