0696
Leveraging a multicompartmental signal model for improved classification of prostate-cancer bone metastases in whole-body DWI1Department of Radiology, UC San Diego School of Medicine, La Jolla, CA, United States, 2Department of Radiation Medicine and Applied Sciences, UC San Diego School of Medicine, La Jolla, CA, United States, 3Department of Neurosciences, UC San Diego School of Medicine, La Jolla, CA, United States, 4Department of Bioengineering, UC San Diego Jacobs School of Engineering, La Jolla, CA, United States, 5Halıcıoğlu Data Science Institute, UC San Diego, La Jolla, CA, United States
Synopsis
Multicompartmental diffusion modeling shows promise for overcoming the limitations of conventional DWI methods and may help to improve the clinical evaluation of prostate-cancer bone involvement. In this study, we applied multicompartmental modeling to develop an empirical tissue classifier for identifying bone lesions in whole-body DWI. The proposed classifier relates signal contributions from model compartments with lower diffusion coefficients to the likelihood that such contributions are from cancerous tissue. This approach proved effective for detecting metastatic lesions in whole-body DWI data, considerably outperforming a classifier based on conventional ADC values.
Motivation
Whole-body diffusion-weighted imaging (DWI) is a promising approach for detecting prostate-cancer bone metastases.1 Bone lesions are typically identified qualitatively as hyperintense regions on DWI and can be quantitatively examined by computing the apparent diffusion coefficient (ADC).2 However, normal tissues with high signal on DWI can impede lesion detection, and interpretation of ADC values is confounded by numerous physiological factors.3 Multicompartmental modeling of the DWI signal is an effective approach for overcoming these obstacles4 that could improve the detection of metastases. In this study, we applied multicompartmental modeling to develop an empirical tissue classifier for identifying bone lesions in whole-body DWI.Methods
This prospective study included 30 patients with prostate cancer who underwent an extended whole-body MRI examination in addition to routine clinical imaging. Standard-of-care evaluation identified 107 bone lesions in 25 of these patients.Whole-body MRI acquisition
MR imaging was performed on a 3T clinical scanner (Discovery MR750; GE Healthcare). Five stations were imaged for each patient, corresponding roughly to the head, chest, abdomen, pelvis, and thighs. At each station, an axial volume of multi-shell diffusion data was acquired using 4 b-values: 0, 500, 1000, and 2000 s/mm2, sampled at 1, 6, 6, and 12 unique diffusion-encoding gradient directions, respectively (default tensor, TR: 4750ms, TE: 75ms, matrix: 80×80 resampled to 128×128, FOV: 400mm, slices: 46, slice thickness: 6mm). For anatomical reference, a high resolution T2-weighted volume was also acquired at each station with scan-coverage identical to that of the multi-shell DWI volume (TR: 1350ms, TE: 113ms, matrix: 384×224 resampled to 512×512, FOV: 400mm, slices: 46, slice thickness: 6mm).
MRI post-processing
Each multi-shell DWI volume was first corrected for distortions due to B0-inhomogeneity, gradient nonlinearity, and eddy currents.5 The signal intensity of each DWI volume was corrected to account for noise.6 Isotropic diffusion was assumed, so directional DWI volumes at each b-value were averaged. Conventional ADC maps were computed by fitting the DWI data to a monoexponential signal model.7
Regions of interest (ROIs) were defined on DWI volumes over each of the identified bone lesions. In the 5 patients without metastases, control ROIs were defined over the entire body excluding the head.
Multicompartmental modeling
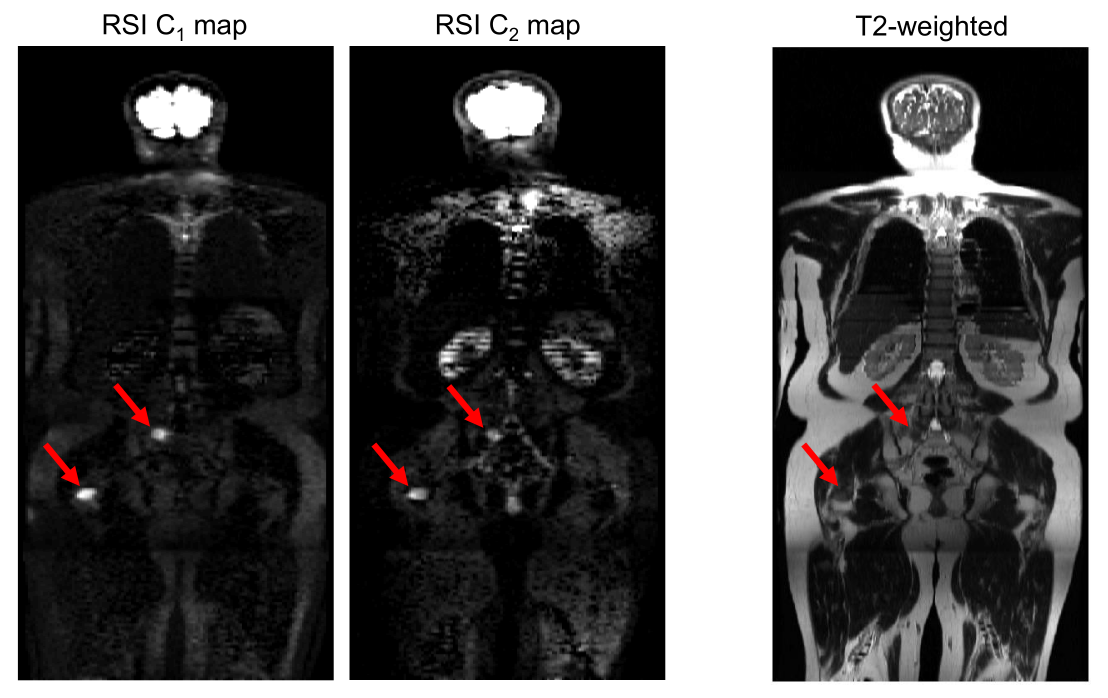
Restriction spectrum imaging (RSI) is a multicompartmental modeling framework for DWI. A previous study (see companion abstract #2625) determined an optimal RSI model for describing whole-body diffusion data: $$S(b)=\sum_{i=1}^{4}C_ie^{-bD_i}$$ where S(b) denotes the measured DWI signal at a particular b-value, Ci describes the compartmental signal contributions to be computed via model-fitting, and Di refers to the compartmental diffusion coefficients which are fixed for each of the 4 tissue compartments (to 0, 1.2e-3, 2.9e-3, and >3.0e-2mm2/s, respectively). Signal-contribution (Ci) maps were computed for each patient by fitting this model to the signal-vs-b-value curve from each voxel.4
Tissue classifier development
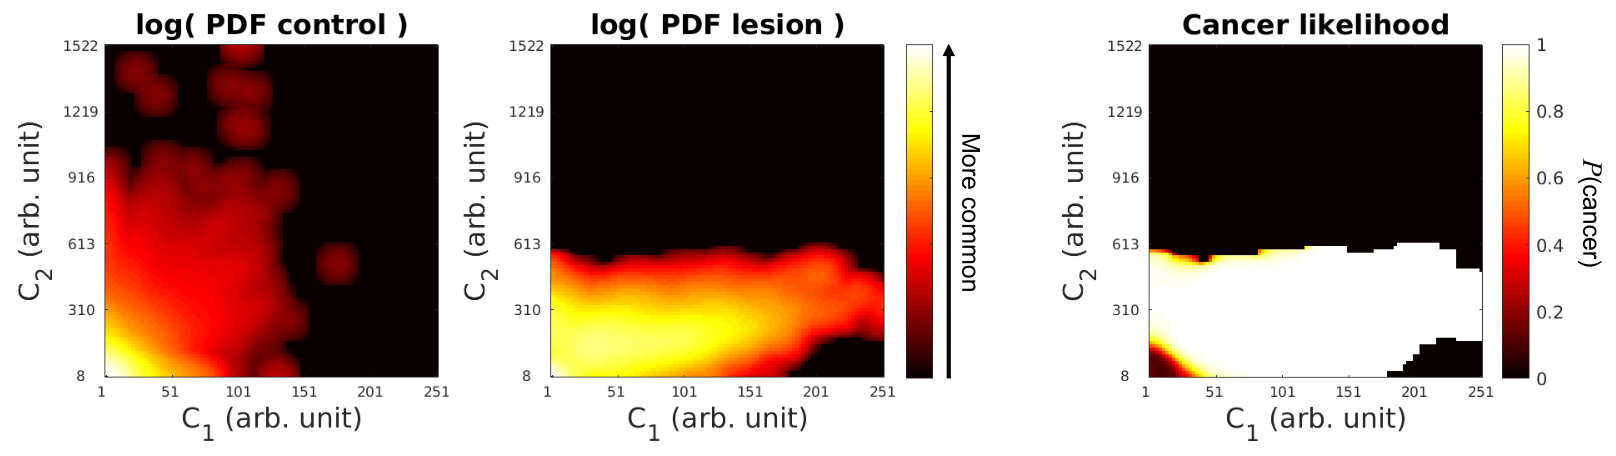
Previous studies have shown that diffusion signal in tumors is enriched in the two model compartments with lowest diffusion coefficient, C1 and C2.4,8,9 To determine how C1 and C2 vary between cancerous and normal tissue, two joint histograms were computed: one recording the C1 and C2 signal-contribution of all voxels within the bone-lesion ROIs, and another from all voxels within the whole-body control ROIs. Normalizing these histograms by the total signal yielded joint C1,C2 probability density functions (PDFs) for lesions and normal tissue. Normalizing the lesion PDF by the sum of the lesion and control PDFs generated a posterior-probability distribution for lesion signal, which can serve as a lookup table relating a voxel’s C1 and C2 measurements to the likelihood it contains cancerous tissue. This lookup table was used to compute voxel-wise maps of cancer likelihood from the C1 and C2 signal-contribution maps of all patients.
Tissue classifier performance
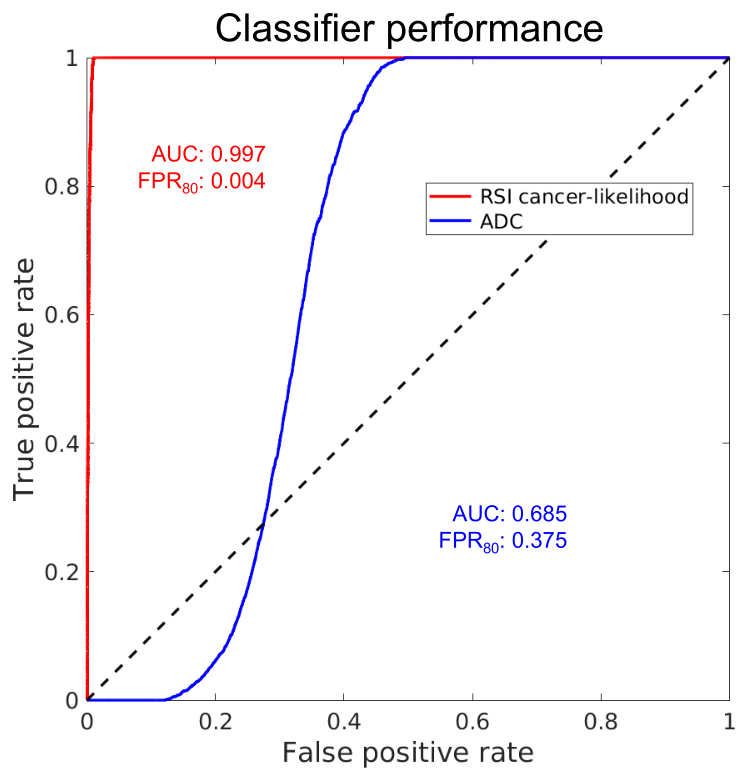
Leave-one-out cross validation at the patient level was used to assess the performance of the RSI-derived tissue classifier. Likelihood values and class labels (positive for voxels within lesion ROIs and negative for the rest of the FOV) were used to generate a receiver operating characteristic (ROC) curve. For comparison, an ROC curve was similarly generated using ADC values. Area under the ROC curve (AUC) and false-positive rate at 80% sensitivity (FPR80) were recorded for both classifiers.
Results
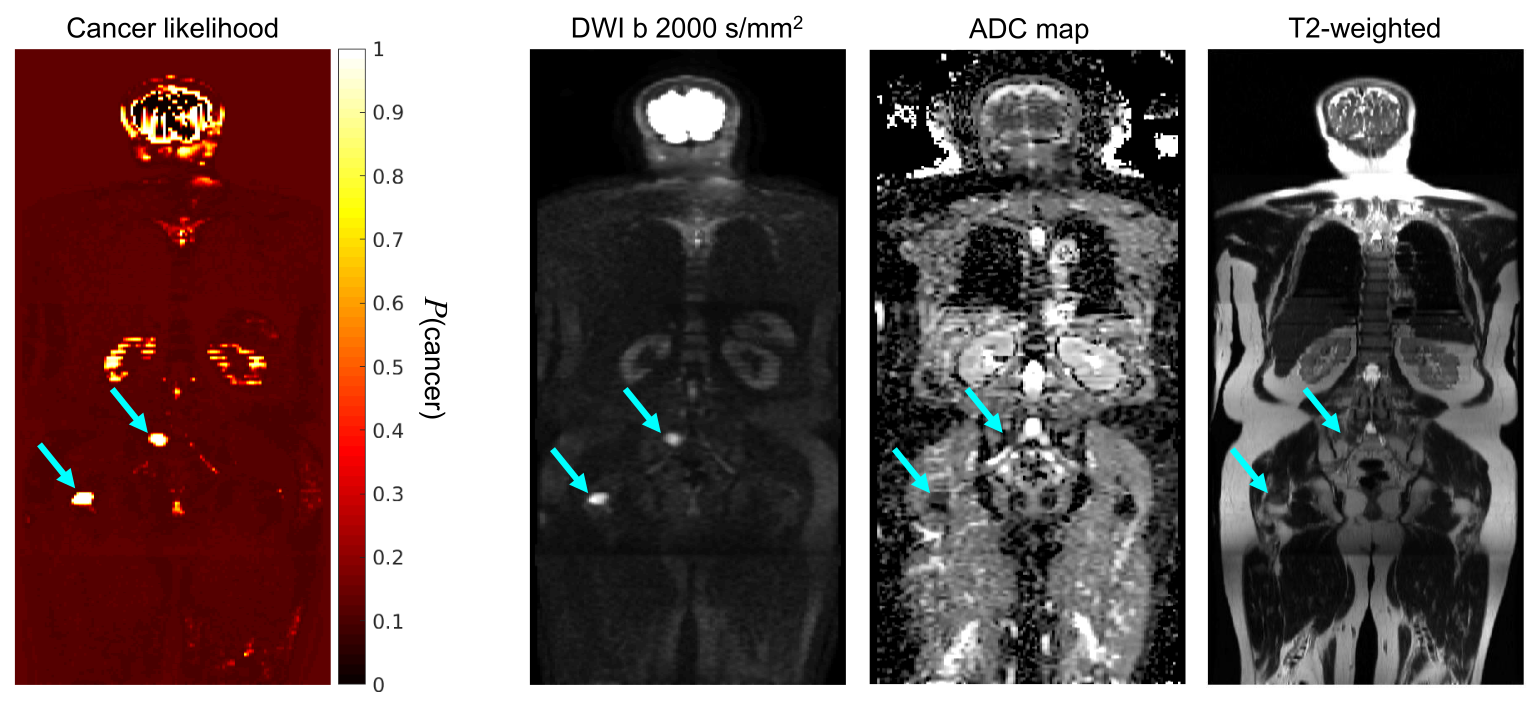
Example RSI signal-contribution maps are shown in Figure 1 for a patient with bone lesions. Figure 2 shows the joint C1,C2 PDFs for normal tissue and bone lesions, alongside the lookup table of cancer-likelihood values derived from these PDFs. A voxel-wise cancer likelihood map is shown in Figure 3 for comparison against conventional MR images. Figure 4 illustrates that a tissue classifier based on these likelihood values can more accurately identify metastatic lesions than one based on conventional ADC values.Discussion
Multicompartmental analysis of diffusion signal from prostate-cancer bone lesions enabled development of an empirical signal classifier for identifying cancerous tissue in DWI data. This classifier relates signal contributions from model compartments with lower diffusion coefficients to the likelihood that such contributions are from cancerous tissue. This approach considerably outperformed a classifier based on conventional ADC values and could potentially help to increase the accuracy of whole-body cancer screening.Acknowledgements
Funding provided by:
Department of Defense Congressionally Directed Medical Research Program. Grant Number: DoD W81XWH‐17‐1‐0618
Prostate Cancer Foundation
National Institute of Biomedical Imaging and Bioengineering. Grant Number: K08 EB026503
References
1. Padhani AR, Lecouvet FE, Tunariu N, et al.: METastasis Reporting and Data System for Prostate Cancer: Practical Guidelines for Acquisition, Interpretation, and Reporting of Whole-body Magnetic Resonance Imaging-based Evaluations of Multiorgan Involvement in Advanced Prostate Cancer. Eur Urol 2017; 71:81–92.
2. Pricolo P, Ancona E, Summers P, et al.: Whole-body magnetic resonance imaging (WB-MRI) reporting with the METastasis Reporting and Data System for Prostate Cancer (MET-RADS-P): inter-observer agreement between readers of different expertise levels. Cancer Imaging 2020; 20:77.
3. Panagiotaki E, Chan RW, Dikaios N, et al.: Microstructural Characterization of Normal and Malignant Human Prostate Tissue With Vascular, Extracellular, and Restricted Diffusion for Cytometry in Tumours Magnetic Resonance Imaging. Invest Radiol 2015; 50:218.
4. Conlin CC, Feng CH, Rodriguez‐Soto AE, et al.: Improved Characterization of Diffusion in Normal and Cancerous Prostate Tissue Through Optimization of Multicompartmental Signal Models. J Magn Reson Imaging (Early View).
5. Holland D, Kuperman JM, Dale AM: Efficient correction of inhomogeneous static magnetic field-induced distortion in Echo Planar Imaging. NeuroImage 2010; 50:175–183.
6. Karunamuni RA, Kuperman J, Seibert TM, et al.: Relationship between kurtosis and bi-exponential characterization of high b-value diffusion-weighted imaging: application to prostate cancer. Acta Radiol 2018; 59:1523–1529.
7. Vidić I, Egnell L, Jerome NP, et al.: Modeling the diffusion-weighted imaging signal for breast lesions in the b = 200 to 3000 s/mm2 range: quality of fit and classification accuracy for different representations. Magn Reson Med 2020; 84:1011–1023.
8. Feng CH, Conlin CC, Batra K, et al.: Voxel-level Classification of Prostate Cancer Using a Four-Compartment Restriction Spectrum Imaging Model. medRxiv 2020:2020.07.25.20162172.
9. Andreassen MMS, Rodríguez-Soto AE, Conlin CC, et al.: Discrimination of breast cancer from healthy breast tissue using a three-component diffusion-weighted MRI model. Clin Cancer Res 2020.
Figures