0695
Microstructural mapping with diffusion-time dependent diffusion MRI improves diagnosis of prostate cancer at 3T1Biomedical Engineering, Zhejiang University, Hangzhou, China, 2Radiology, the First Affiliated Hospital with Nanjing Medical University, Nanjing, China, 3MR Collaboration, Siemens Healthcare Ltd., Shanghai, China
Synopsis
Diffusion-time-dependent diffusion MRI (dMRI) has shown potentials in characterizing tumor microstructure. This study investigated the diagnostic value of time-dependent dMRI to differentiate prostate cancer pathological grades at 3T. Oscillating and pulsed gradient dMRI was performed in 55 patients, and the data were fitted with the IMPULSED model to estimate cell diameter, intracellular fraction, cellularity, and diffusivities. We found fin and cellularity increased as Gleason score increased, while diameter and Dex decreased. Cellularity achieved the highest diagnostic accuracy with an accuracy of 0.87 and area-under-the curve of 0.96, and the combination of cellularity and ADC further improved the accuracy to 0.91.
Introduction
Recent progress on diffusion-time (td) dependent diffusion MRI (dMRI) 1,2 using oscillating and pulsed gradient spin-echo sequences (OGSE and PGSE) has demonstrated unique advantages in characterizing tumor microstructure, as reported in several preclinical studies. 3-6 Recently, feasibility of td-dependent dMRI in clinical tumor applications has also been explored, 7-11 regardless of the relatively low oscillating frequency and b-value due to the limited gradient strength on clinical scanners. In this study, we investigated the diagnostic performance of td-dependent dMRI based microstructural mapping in differentiating prostate cancer (PCa) pathological grades on a clinical 3T system.Methods
55 male patients (69.2±7.3 yrs) were enrolled with IRB approval and written consent. OGSE sequence with trapezoid-cosine gradient was implemented on a 3T Siemens Skyra scanner (maximum gradient =45mT/m). OGSE data were acquired at oscillating frequencies of 33Hz (td,eff =7.6 ms, 2 cycles, b=0.3/0.6 ms/µm2) and 17Hz (td,eff =14.7 ms, b=0.4/0.8/1.2 ms/µm2), and PGSE at Δeff =30ms (b=0.4/0.8/1.2 ms/µm2) using: 3 diffusion directions, TE/TR=148/5000ms, FOV=220×220mm, in-plane resolution=2.75×2.75mm, 10 slices with a slice-thickness of 5mm. The total protocol was approximately 4.5min.We used the imaging microstructural parameters using limited spectrally edited diffusion (IMPULSED) model 3 to obtain cell diameter (d), intracellular fraction (fin) and extracellular diffusivity (Dex), while the intracellular diffusivity (Din) was fixed at 1 µm2/ms since the fitting is insensitive to the choice of Din. 7 The cellularity was quantified as fin/d. The fitting was performed using least square curve fitting in MATLAB, which was repeated 100 times with randomized initialization to avoid local minimum. Regions of interest (ROIs) were manually delineated in cancerous tissues based on b0 images.
The pathological grade of PCa was determined using the Gleason score (GS). The differences between the five GS groups (0-4) were compared with ANOVA followed by post-hoc t-test. GS≤1 was classified as clinically-insignificant PCa, and GS>1 was classified as clinically-significant PCa, and the diagnostic accuracy to differentiate the two classes were evaluated based on a five-fold cross-validation using linear discriminator.
Results
Based on the biopsy, the patients were identified with GS of 0/1/2/3/4 (n= 17/4/9/11/14, respectively). Figure 1 demonstrated the IMPUSLED fitted parameter maps for the five grades, along with the apparent diffusivity coefficient (ADC) maps at different td. fin and cellularity in the cancer ROIs (dashed contours) increased with GS, and the ADCs decreased with GS.We observed a more prominent td-dependency at higher GS, based on the signal decay curves (Figure 2A-E) and ADC measurements (Figure 2F). Significant difference between GS groups were found in cellularity, DPGSE, and DOGSE(17Hz) (Figure 3). fin, d, and DOGSE(33Hz) primarily showed differences between GS=1 and GS=4. Classification analysis revealed that the cellularity index achieved the highest AUC of 0.96 with an accuracy of 0.87 and specificity of 0.87 in separating clinically-insignificant (GS≤1, n=21) and significant (GS>1, n=34) PCa, while d values yielded the best sensitivity of 0.94 (Figure 4A-B). DPGSE showed the second best performance with an AUC of 0.95 and accuracy of 0.85. We also tried different combination of the parameters. Only the combination of cellularity and DPGSE showed higher performance than single parameters with an accuracy of 0.91 and AUC of 0.95, and the classification outcome of the combined marker was shown in Figure 4C.
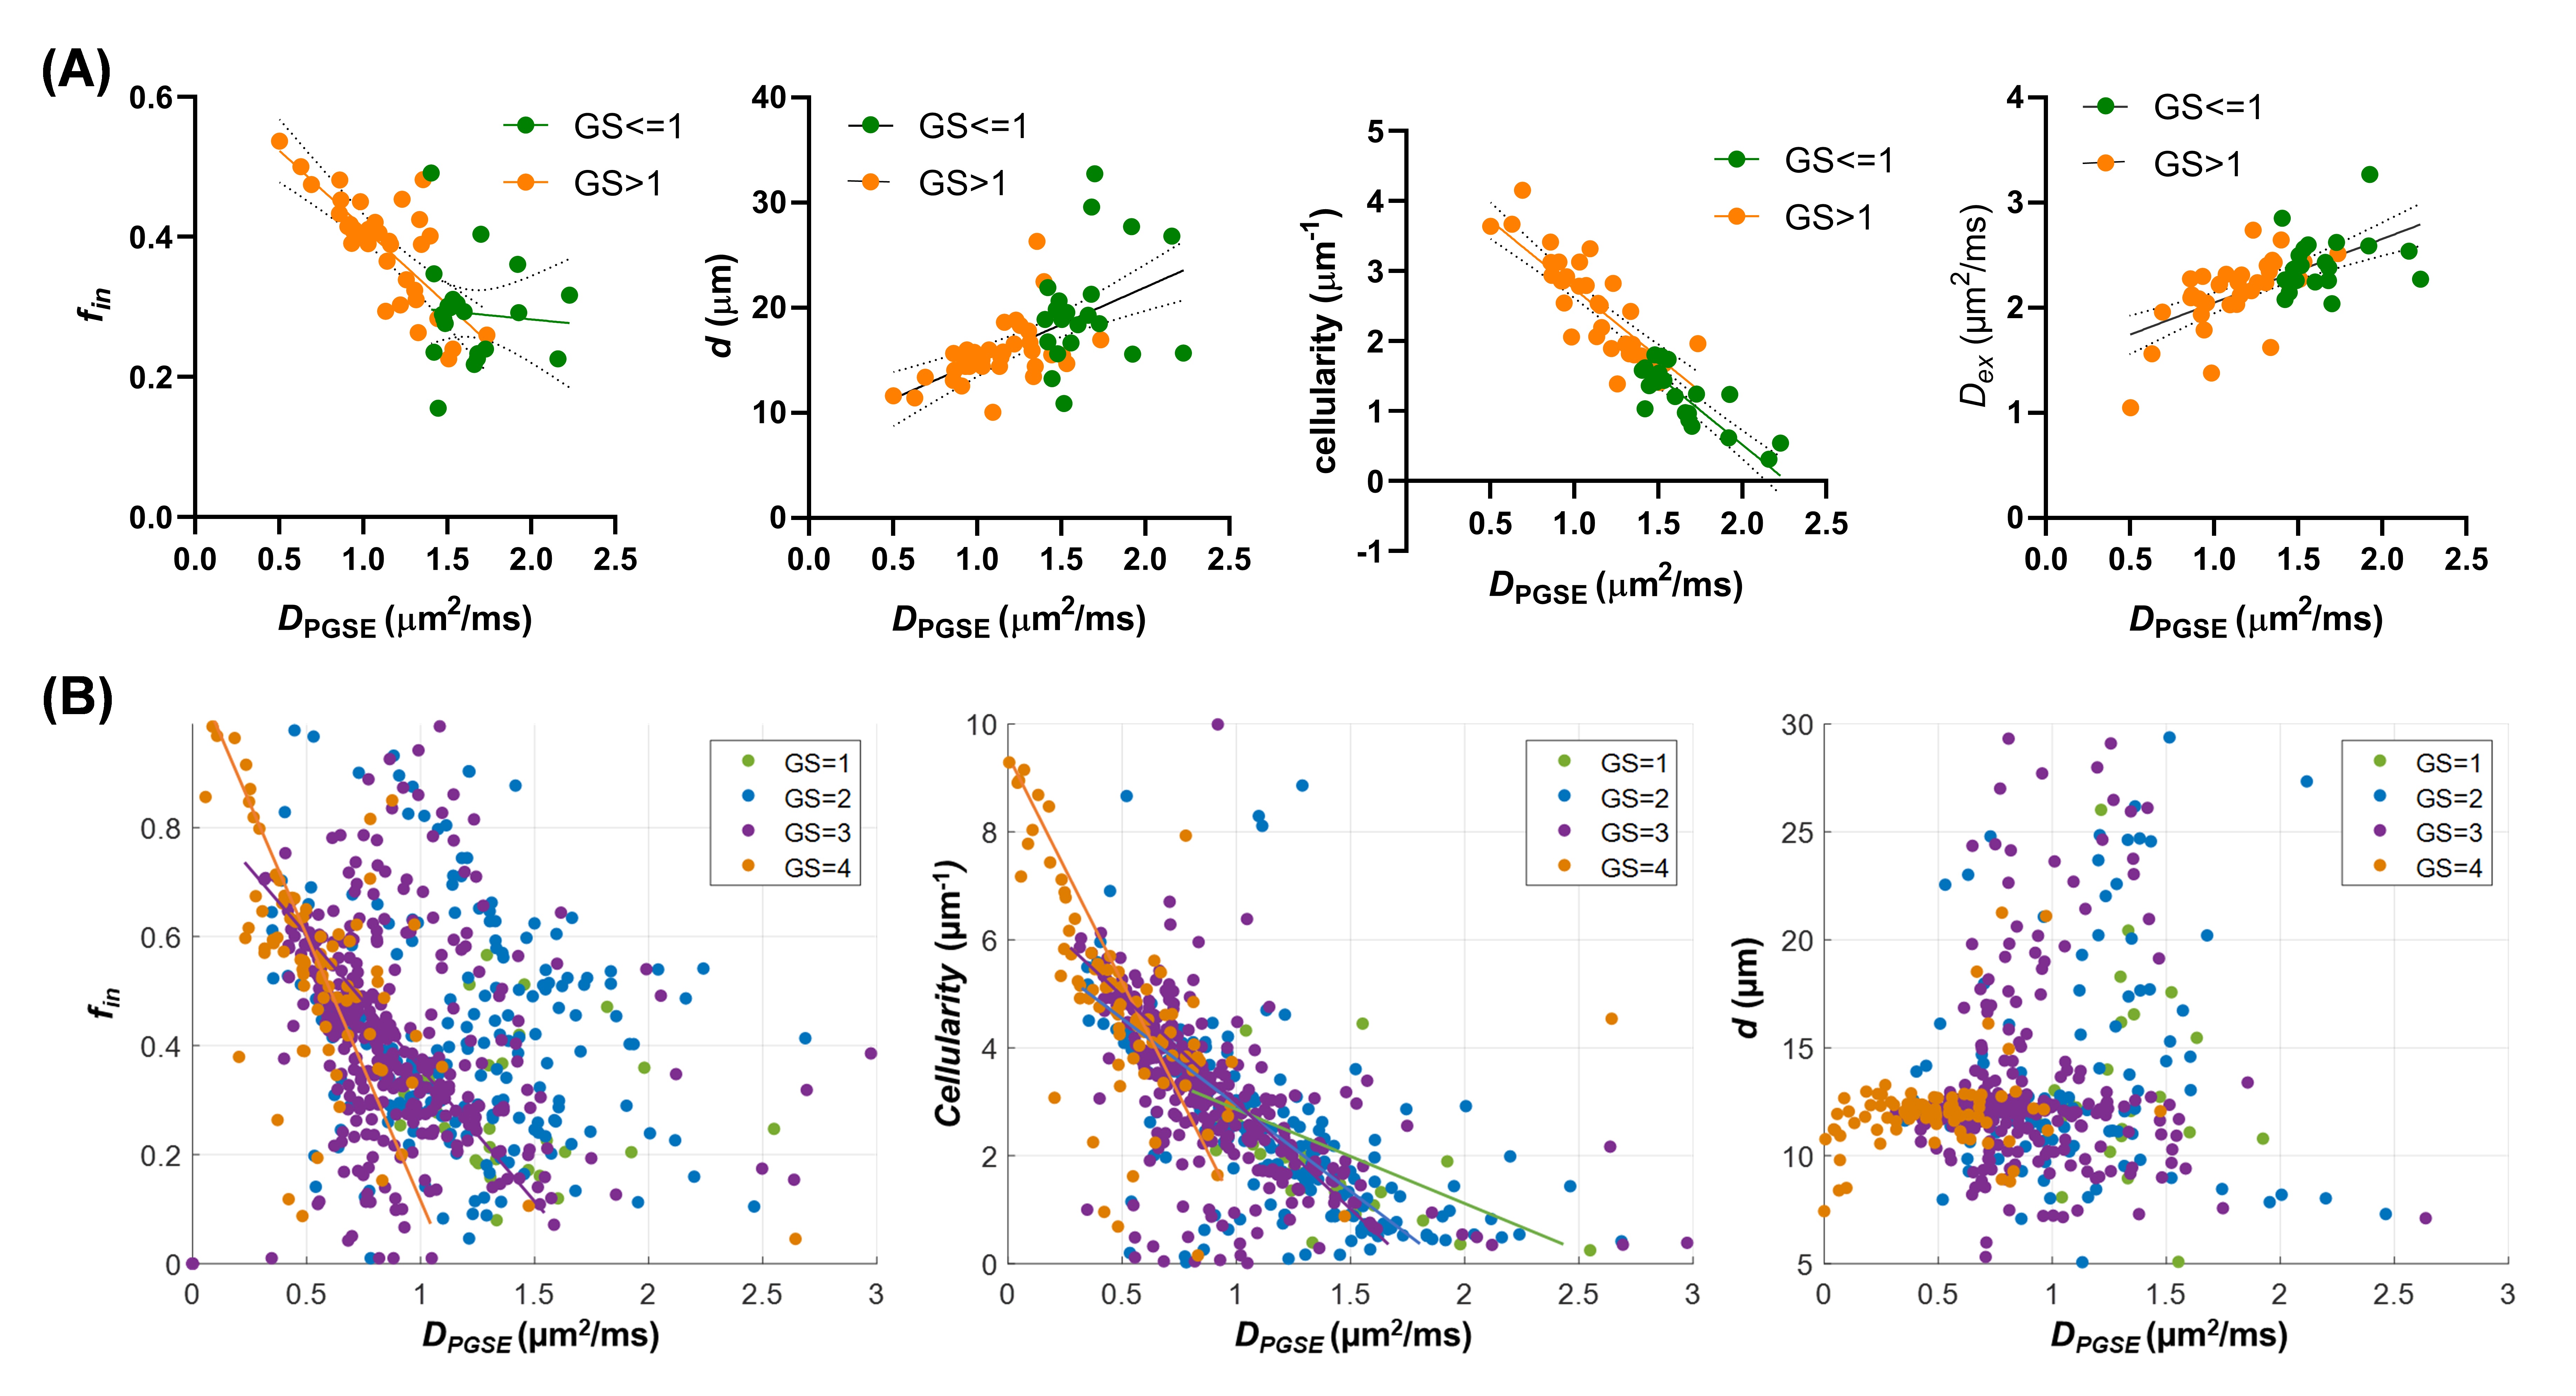
In addition, we examined the correlations between IMPULSED parameters and DPGSE at both subject level and voxel level (Figure 5). As expected, the ADC showed negative correlations with fin and cellularity and the correlation patterns were significant different between GS≤1 and GS>1 PCa; and ADC was positively correlated with d and Dex. At the voxel level, we also found negative correlations between ADC and fin /cellularity, and the correlation was stronger for higher GS, while d was no longer correlated with ADC.
Discussion and Conclusion
This study demonstrated the advantages of td-dependent dMRI based microstructural mapping for diagnosis of PCa with a sizable number of patients. While previous td-dependent dMRI studies reported the feasibility of this technique in clinical settings or showed the changes of td-dependency in tumorous tissues, 7-11 we directly revealed the clinical value of this technique for the first time, namely, improved diagnostic accuracy using the cellularity index or combination of cellularity and ADC measurements.We showed increased fin /cellularity and decreased d /ADCs as GS increased, which agreed with the fact of increased glandular elements and proliferation of epithelial cells in malignant PCa. 12 The increased fin was also found previously using the VERDICT model in a small sample study (n=8). 13 While the IMPULSED model focused on the short-td regime, other group has also investigated the long-td regime and indicated the diagnostic power decreased as td further increased. 14 Relaxation-td joint modeling was attempted to separate luminal and cellular compartments, which, however, required a relatively long scan time. 15
The current study is limited in terms of imaging resolution in this simplified protocol (4.5min) and low oscillating frequency due to the limited gradient strength (45mT/m); yet, the high diagnostic accuracy of this quick protocol on an average-performance scanner makes the technique readily translatable to clinical routines. We also realized limitations of the IMPULSED model, which assumes a simple two-compartment configuration without exchange. Further pathological examination is needed to validate the microstructural findings.
Acknowledgements
This study is supported by Ministry of Science and Technology of China (2018YFE0114600); National Natural Science Foundation of China (81971605, 61801421)References
1. Stepisnik J. Time-Dependent Self-Diffusion by Nmr Spin-Echo. Physica B 1993;183(4):343-350.
2. Gore JC, Xu JZ, Colvin DC, Yankeelov TE, Parsons EC, Does MD. Characterization of tissue structure at varying length scales using temporal diffusion spectroscopy. Nmr Biomed 2010;23(7):745-756.
3. Jiang XY, Li H, Xie JP, Zhao P, Gore JC, Xu JZ. Quantification of cell size using temporal diffusion spectroscopy. Magn Reson Med 2016;75(3):1076-1085.
4. Reynaud O, Winters KV, Hoang DM, Wadghiri YZ, Novikov DS, Kim SG. Pulsed and oscillating gradient MRI for assessment of cell size and extracellular space (POMACE) in mouse gliomas. Nmr Biomed 2016;29(10):1350-1363.
5. Panagiotaki E, Walker-Samuel S, Siow B, Johnson SP, Rajkumar V, Pedley RB, Lythgoe MF, Alexander DC. Noninvasive Quantification of Solid Tumor Microstructure Using VERDICT MRI. Cancer Res 2014;74(7):1902-1912.
6. Colvin DC, Yankeelov TE, Does MD, Yue Z, Quarles C, Gore JC. New insights into tumor microstructure using temporal diffusion spectroscopy. Cancer Res 2008;68(14):5941-5947.
7. Xu J, Jiang X, Li H, Arlinghaus LR, McKinley ET, Devan SP, Hardy BM, Xie J, Kang H, Chakravarthy AB, Gore JC. Magnetic resonance imaging of mean cell size in human breast tumors. arXiv 2019;arXiv:1905.07818.
8. Lemberskiy G, Rosenkrantz AB, Veraart J, Taneja SS, Novikov DS, Fieremans E. Time-Dependent Diffusion in Prostate Cancer. Invest Radiol 2017;52(7):405-411.
9. Iima M, Kataoka M, Honda M, Ohno AK, Ota R, Ohashi A, Urushibata Y, Feiweier T, Toi M, Togashi K. Time-Varying Diffusion Patterns in Breast Cancer Linked to Prognostic Factors. 2019; Montreal, QC, Canada.
10. Lemberskiy G, Baete S, Novikov D, Fieremans E, Zan E, Hu K, Kim S. Diffusion time-dependence of diffusivity and kurtosis in locally advanced head and neck squamous cell carcinoma before and after chemo-radiation therapy. 2019; Montreal, QC, Canada.
11. Reynaud O. Time-Dependent Diffusion MRI in Cancer: Tissue Modeling and Applications. Front Phys 2017;5.
12. de la Rosette JJ, Harisinghani MJ, Wijkstra MG. Imaging in Oncological Urology. London, UK: Springer; 2009.
13. Panagiotaki E, Chan RW, Dikaios N, Ahmed HU, O'Callaghan J, Freeman A, Atkinson D, Punwani S, Hawkes DJ, Alexander DC. Microstructural characterization of normal and malignant human prostate tissue with vascular, extracellular, and restricted diffusion for cytometry in tumours magnetic resonance imaging. Invest Radiol 2015;50(4):218-227.
14. Lemberskiy G, Rosenkrantz AB, Veraart J, Taneja SS, Novikov DS, Fieremans E. Time-Dependent Diffusion in Prostate Cancer. Invest Radiol 2017;52(7):405-411.
15. Lemberskiy G, Fieremans E, Veraart J, Deng FM, Rosenkrantz AB, Novikov DS. Characterization of Prostate Microstructure Using Water Diffusion and NMR Relaxation. Front Phys 2018;6.
Figures