0693
Single breath-holding three-dimensional cardiac T2 mapping with low-rank plus sparsity reconstruction1Center for Biomedical Imaging Research, Department of Biomedical Engineering, Tsinghua University, Beijing, China, 2National Heart, Lung, and Blood Institute, National Institutes of Health, Bethesda, MD, United States
Synopsis
Three-dimensional (3D) T2 mapping techniques enables quantitative detection of edematous tissue with whole heart coverage. However, the intrinsically long scan time limits its clinical application. In this study an accelerated 3D T2 mapping sequence was developed based on low-rank plus sparsity reconstruction. Both retrospective and prospective experiments were performed to evaluate the accuracy and precision of the proposed method. Achieved image quality was comparable with 4 times acceleration. Homogeneous whole left ventricular T2 map can be acquired in single breath-hold with resolution of 2×2×5 mm3.
INTRODUCTION
Cardiovascular magnetic resonance T2 mapping enables quantification and visualization of changes in myocardial tissue(1). In addition, three-dimensional (3D) approaches,(2) remove limitations on volumetric coverage, maximum undersampling rate,(3) and achievable spatial resolution that can exist with two-dimensional approaches,(4). Nevertheless, the long scan time required for collection of different T2-weighted 3D volumes can hinder the translation into clinical workflows. To reduce the scan time of 3D acquisitions while overcoming limitations of 2D approaches, we propose a fast single Breath-Holding 3D T2 mapping sequence (BH3DT2) with low-rank plus sparsity reconstruction.METHODS
Imaging was performed on 3 T MR scanners (Ingenia CX, Philips Healthcare, Best, Netherlands). The human study was approved by the local institutional review board. Written informed consent was obtained from all subjects.Sequence: The proposed BH3DT2 is based on our previously proposed free-breathing 3D T2 mapping sequence (FB3DT2), which acquires three interleaved ECG-triggered spoiled gradient echo volumes using T2 preparation (T2-prep) with different echo time (TET2Prep) under free breathing. A saturation pulse followed constant delay time is performed before acquisition each heartbeat to reset magnetization. Each volume was completed in 4 shots with a variable density spiral‐like Cartesian trajectory (5). Acquisition was completed within a single breath-holding of 12 heartbeats.
L+S Reconstruction: The T2-weighted volumes can be represented by a Casorati matrix $$$L$$$ (6), with size $$$N×P$$$, where $$$N$$$ is the total number of voxels in 3D volume and $$$P$$$ is the number of distinct T2-weighted volumes. The images share the same spatial structure, which can be represented as a low-rank matrix $$$L$$$, the residual matrix ($$$S$$$) between $$$X$$$ and $$$L$$$ is the result from the signal change of T2 weighting contrast, which is assumed to be sparse. The imaging reconstruction was performed by solving the minimization problem: $$min‖L‖_*+ λ‖TS‖_1 \ \ \ \ \ \ s.t.\ X=L+S,E(X)=d$$ where $$$‖L‖_*$$$ is the nuclear norm of the low-rank matrix $$$L$$$ , $$$T$$$ is the Fourier transform applied to $$$S$$$ to increase sparsity, and $$$‖TS‖_1$$$ is the l1-norm. $$$λ$$$ is a parameter that balances the l1-norm and the nuclear norm. $$$E$$$ is the multicoil encoding operator, and $$$d$$$ is the undersampled multi-contrast multi-coil K-space data. The minimization problem was solved by iterative soft thresholding (7).
Retrospective Validation: Using data from one normal human subject and one swine with acute myocardial infarction, we investigate the optimal acceleration rate for BH3DT2 by retrospectively undersampling fully-sampled reference (Ref) data with three acceleration factors (R= 2,4,6). Reference data were acquired by FB3DT2 using the same signal preparation as BH3DT2 albeit with respiratory navigation. Imaging parameters of FB3DT2: FOV=300×300×80 mm3, voxel size=2×2×10 mm3, reconstructed resolution: 2×2×5 mm3, TET2Prep= 0, 25, 45 ms. Coil sensitivity map was estimated by sum of square. The normalized root-mean-square errors (nRMSE) were calculated to optimize the L+S reconstruction parameters, and to compare the performance.
Prospective Validation: Four normal human subjects (3 males, 28±7 years) were imaged with BH3DT2 and FB3DT2 in short axis orientation. Imaging parameters were: FOV=300×300×80mm3, voxel size=2×2×10mm3, TR/TE/ flip angle = 3.7ms/1.19ms/18°, 50 readouts per shot, acceleration factor R=4.48, TET2Prep=0, 25, 45 ms. Coil sensitivity map was estimated by ESPIRiT (8). FB3DT2 was performed without acceleration. The left ventricle was manually segmented on T2 maps and divided into 16 segments. The mean, standard deviation (SD), and coefficient of variation (CV) of T2 within each segment were calculated. A paired two-tailed Student's t-test was used for the statistical analysis.
RESULTS
Comparison results of the performance of L+S at different undersampling rates (R=2,4,6) are shown in Figures 1-3. With retrospective undersampling in both the normal human subject (Figure 1) and the swine with acute myocardial infarction (Figure 2), nRMSE increased with R. Image artefacts were subtle at R=4 though significantly increased in both T2-weighted images and T2 maps at R=6. Figure 3 indicates that there were little bias in mean T2, and an increase in CV after undersampling. All subjects were scanned successfully with BH3DT2 (~12 seconds) and FB3DT2 (116±15 seconds) during prospective validation. Figure 4 shows T2 measured with BH3DT2 was homogeneous over the whole heart, as demonstrated by the analysis in Figures 4B, 4C and 4D. Figure 5 shows the mean T2 obtained from all four subjects over the whole left ventricle. The mean T2 from BH3DT2 (47.2±1.2 ms) was only 1.5% higher than that from FB3DT2 (46.5±1.5 ms, p=0.03) with comparable variability (CV: 8.36±1.9% vs. 7.89±2.0%, p=0.02).DISCUSSION and CONCLUSION
This study proposed and validated a 3D cardiac T2 mapping sequence. In-vivo validations indicated that T2 from breath-hold acquisitions (BH3DT2) had comparable accuracy to that from fully sampled data acquired during free-breathing (FB3DT2), with little impact on precision at high acceleration rates. In conclusion, the proposed sequence enables a fast estimate of T2 across the whole heart within a single breath-hold. Further validation with additional subjects, and optimization of parameters for both acquisition and reconstruction are warranted.Acknowledgements
This work was funded by National Key R&D Program of China (2016YFC0104700)References
1. Messroghli DR, Moon JC, Ferreira VM, et al. Clinical recommendations for cardiovascular magnetic resonance mapping of T1, T2, T2* and extracellular volume: A consensus statement by the Society for Cardiovascular Magnetic Resonance (SCMR) endorsed by the European Association for Cardiovascular Imagi. J. Cardiovasc. Magn. Reson. 2017;19:75
2. Ding H, Fernandez-de-Manuel L, Schär M, et al. Three-dimensional whole-heart T 2 mapping at 3T. Magn. Reson. Med. 2015;74:803–816
3. Robson PM, Grant AK, Madhuranthakam AJ, Lattanzi R, Sodickson DK, McKenzie CA. Comprehensive quantification of signal-to-noise ratio and g-factor for image-based and k-space-based parallel imaging reconstructions. Magn. Reson. Med. 2008;60:895–907
4. Giri S, Chung Y-C, Merchant A, et al. T2 quantification for improved detection of myocardial edema. J. Cardiovasc. Magn. Reson. 2009;11:56
5. Bustin A, Ginami G, Cruz G, et al. Five-minute whole-heart coronary MRA with sub-millimeter isotropic resolution, 100% respiratory scan efficiency, and 3D-PROST reconstruction. Magn. Reson. Med. 2019;81:102–115
6. Zhao B, Lu W, Hitchens TK, Lam F, Ho C, Liang Z-P. Accelerated MR parameter mapping with low-rank and sparsity constraints. Magn. Reson. Med. 2015;74:489–498
7. Otazo R, Candès E, Sodickson DK. Low-rank plus sparse matrix decomposition for accelerated dynamic MRI with separation of background and dynamic components. Magn. Reson. Med. 2015;73:1125–1136
8. Uecker M, Lai P, Murphy MJ, et al. ESPIRiT-an eigenvalue approach to autocalibrating parallel MRI: Where SENSE meets GRAPPA. Magn. Reson. Med. 2014;71:990–1001
Figures
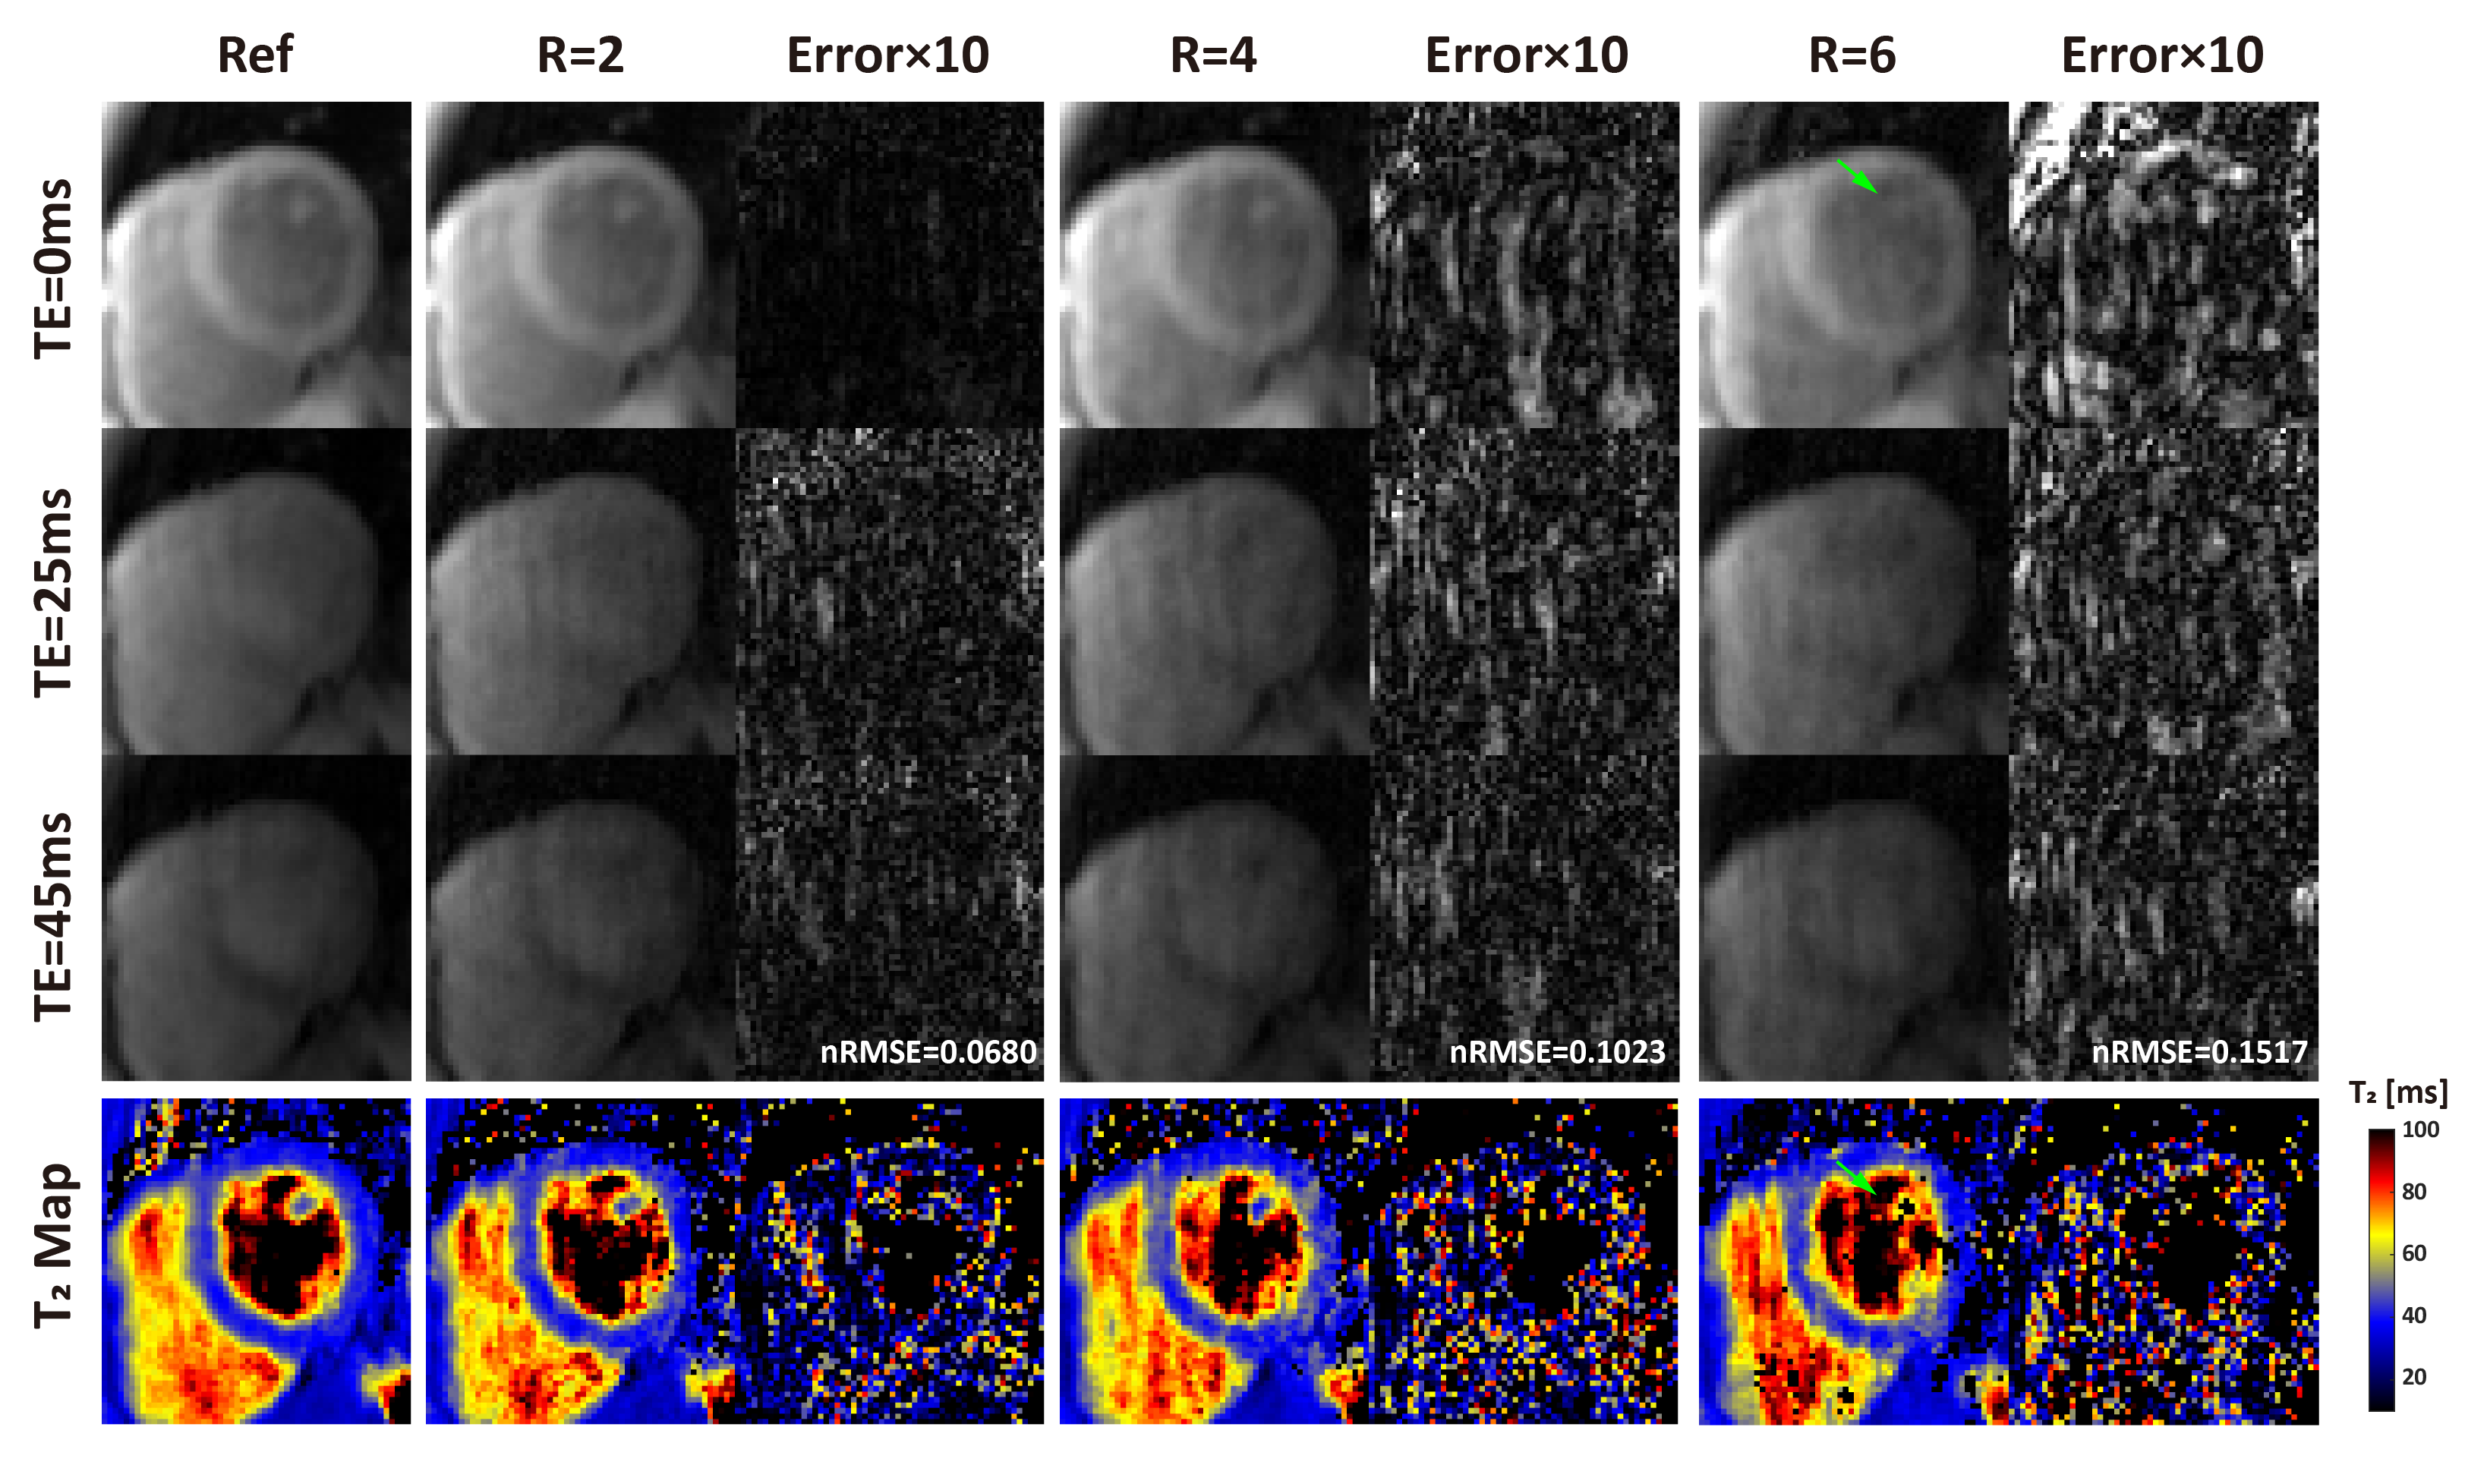
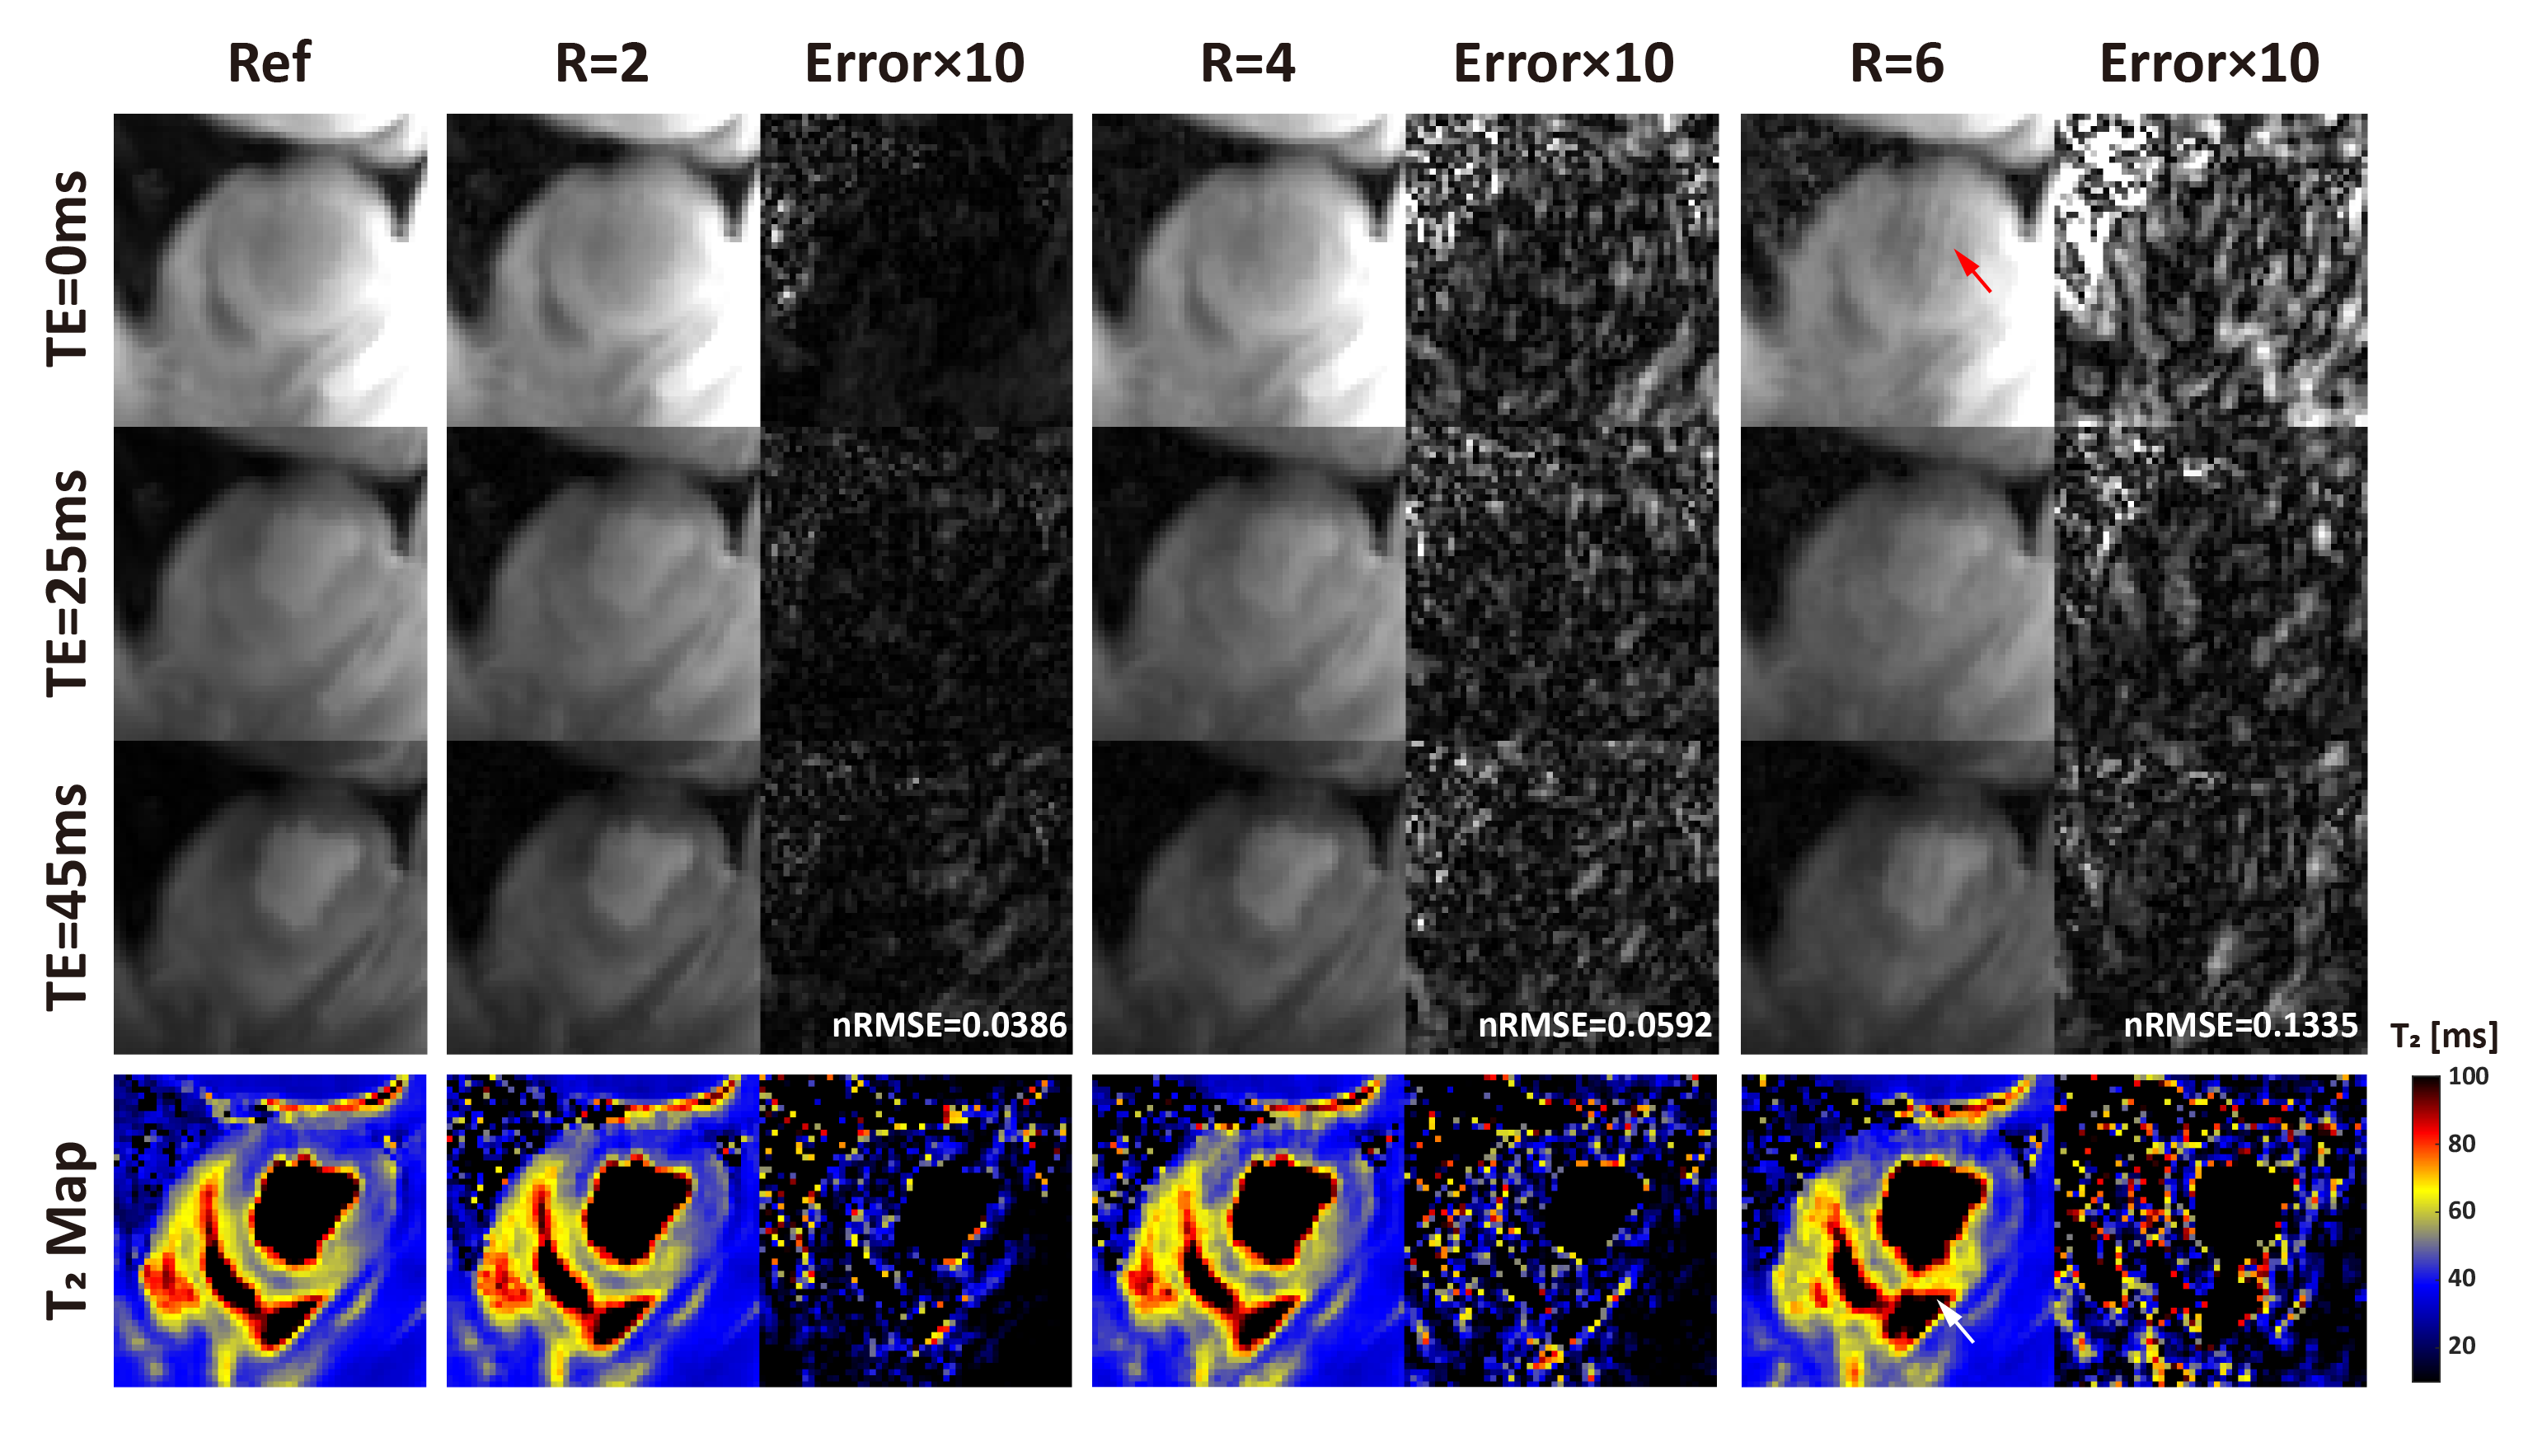
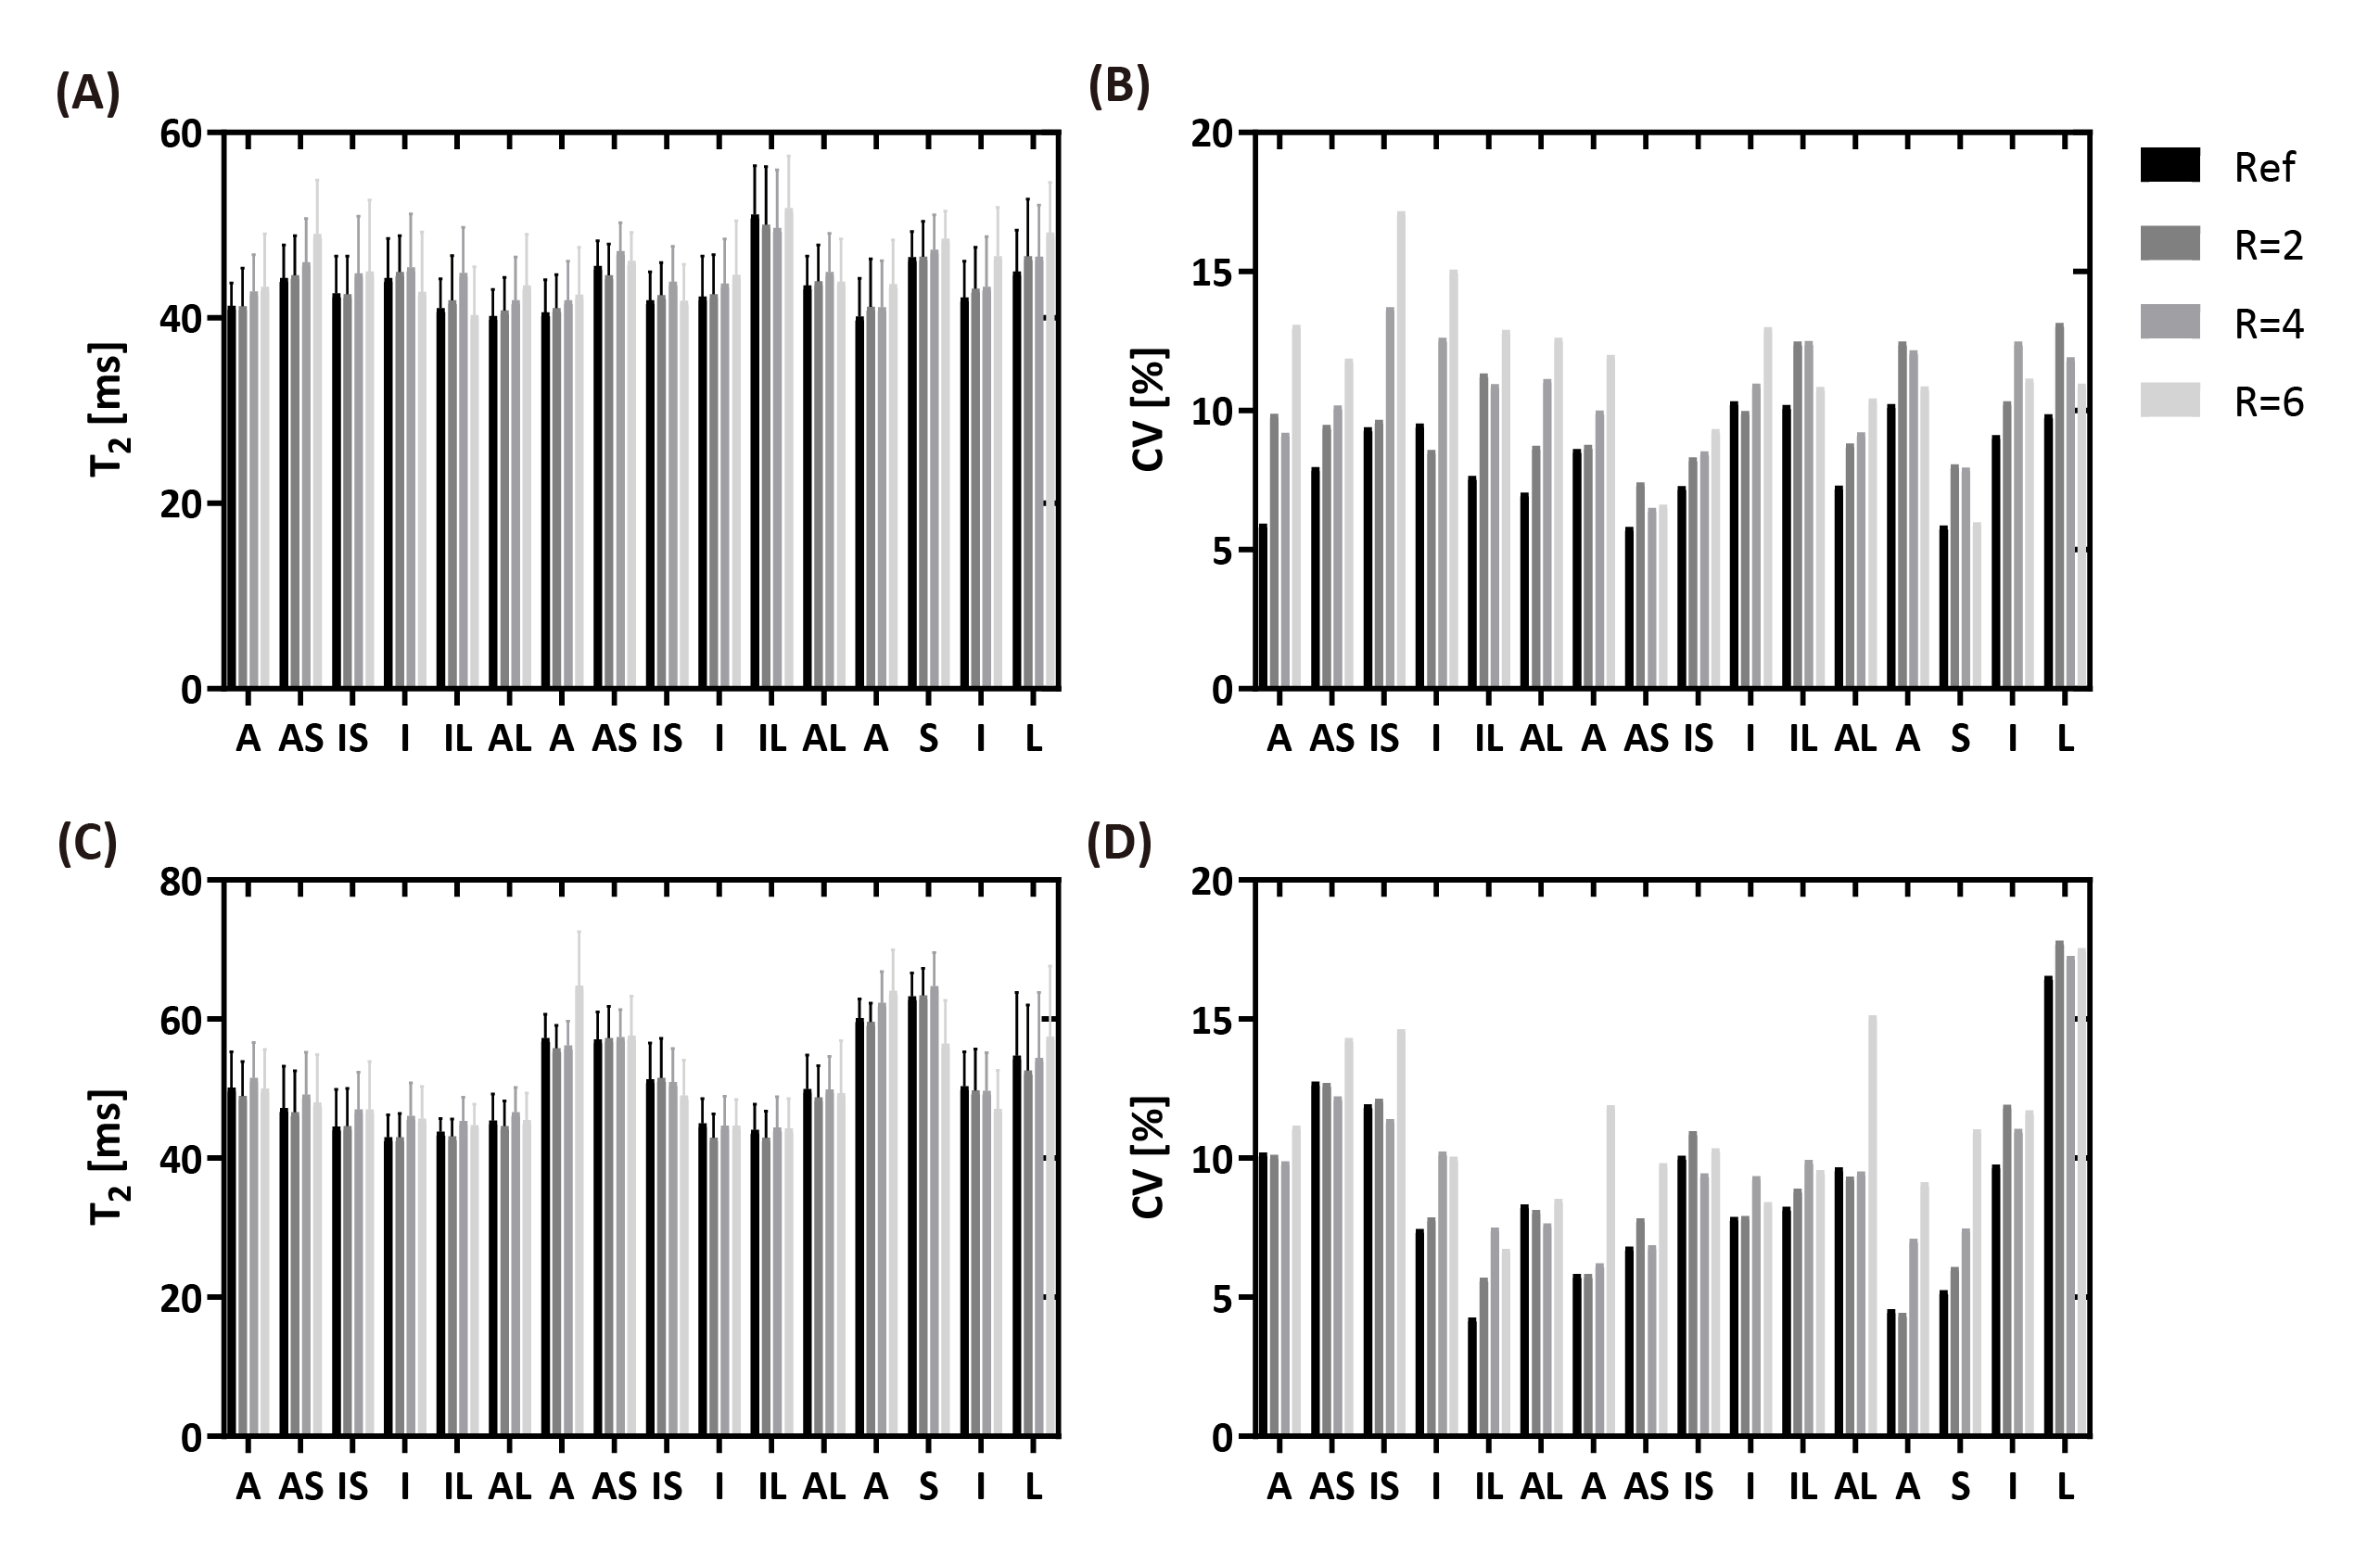
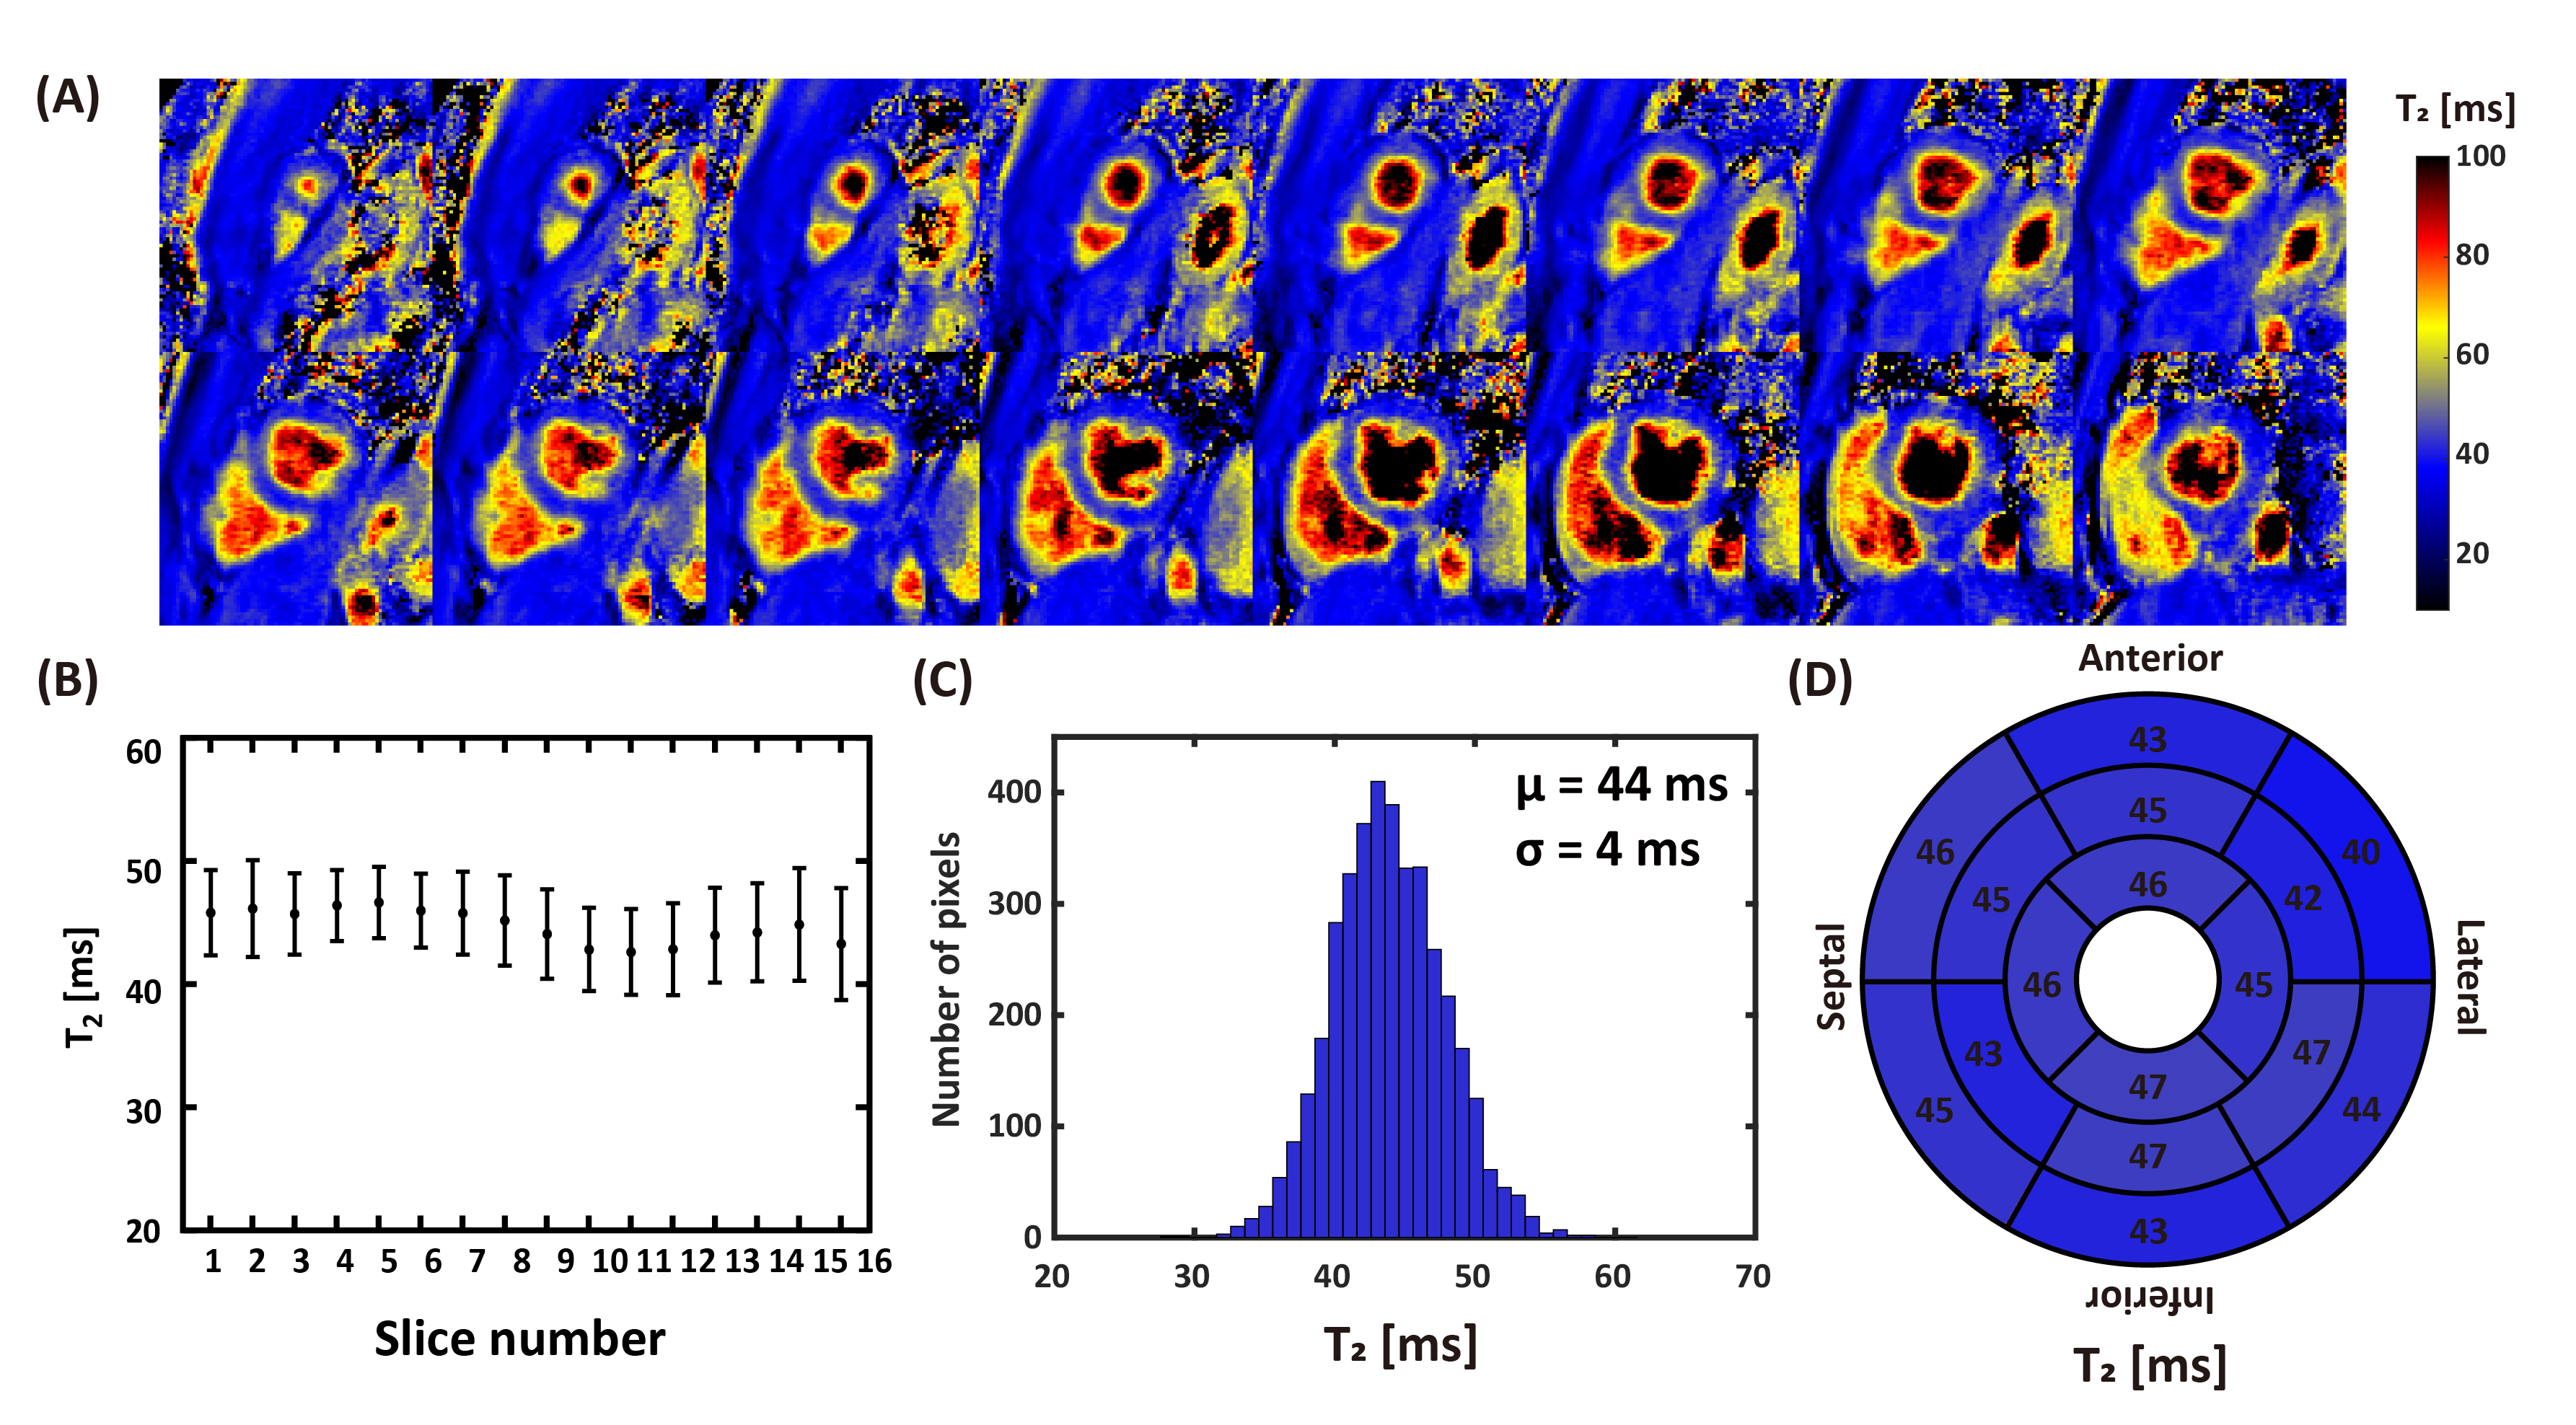
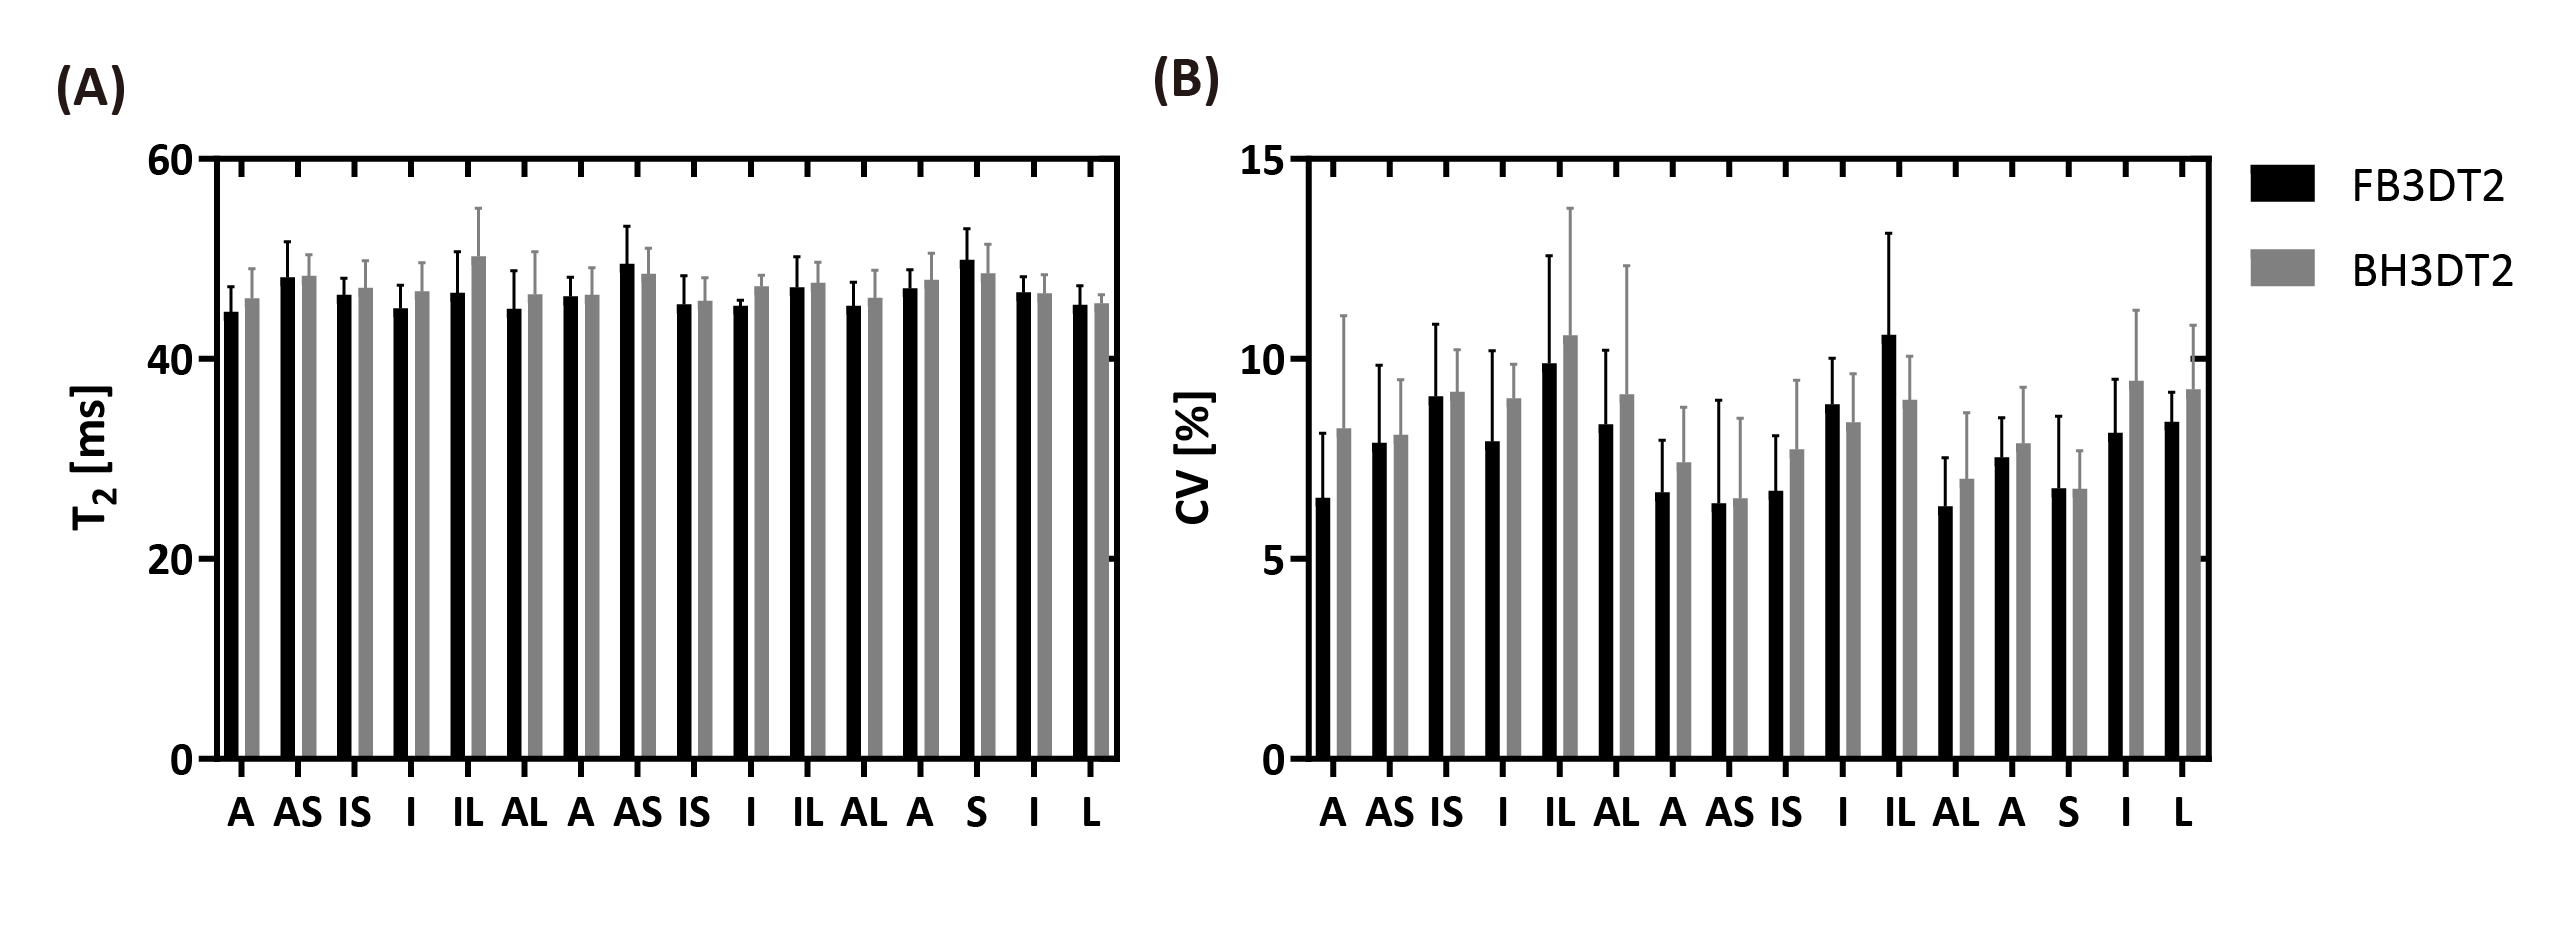
Figure 5. Distribution of myocardium T2 over the whole left ventricle, obtained from all four subjects by the proposed BH3DT2 and FB3DT2 sequences. A: the mean T2 of BH3DT2 was 1.5% higher than FB3DT2 (47.2±1.2ms vs. 46.5±1.5ms, p=0.03). B: The coefficient of variation (CV) of BH3DT2 was higher than FB3DT2 (8.36±1.9% vs. 7.89±2.0%, p=0.02).
A: anterior; AS: anteroseptal; IS: inferoseptal; I: inferior; IL: inferolateral; AL: anterolateral; S: septal; L: lateral