0692
Fast high-resolution isotropic whole-heart T2 mapping using focused navigation1Department of Radiology, Department of Radiology, Lausanne University Hospital (CHUV) and University of Lausanne (UNIL), Laus, Lausanne, Switzerland, 2Department of Radiology, Department of Radiology, Lausanne University Hospital (CHUV) and University of Lausanne (UNIL), Lausanne, Switzerland, Lausanne, Switzerland, 3CIBM Center for BioMedical Imaging, Lausanne, Switzerland, Lausanne, Switzerland, 4Advanced Clinical Imaging Technology, Siemens Healthcare AG, Lausanne, Switzerland, Lausanne, Switzerland, 5Department of Radiology, Department of Radiology, Lausanne University Hospital (CHUV) and University of Lausanne, Lausanne, Switzerland
Synopsis
Cardiac parametric mapping techniques are gaining traction for the clinical routine assessment of various pathologies. Despite the complex 3D patterns of many myocardial conditions, most current techniques are breath-held single-slice 2D acquisitions. We propose a free-breathing high-resolution isotropic 3D T2 mapping technique for the heart where breathing motion is corrected in k-space before image reconstruction. In 4 healthy volunteers and one patient with myocardial infarction, we found that our technique produced sharp and accurate T2 maps but had slightly lower precision than routine techniques.
Introduction
T2 mapping of the myocardium is gaining acceptance as a routine technique for the assessment of acute edema.1 Even though most myocardial pathologies have unpredictable 3D patterns throughout the myocardium, most current clinical techniques are breath-held single-slice 2D acquisitions. To characterize these complex disease patterns, several 3D T2 mapping techniques have been proposed.2–5 These techniques usually come with a sacrifice in either scan duration, precision, or motion robustness. In order to avoid these compromises, we here propose an isotropic 3D T2 mapping that 1) robustly corrects for respiratory motion through autofocusing, 2) produces precise maps through compressed sensing (CS) with combined local low-rank (LLR) and total variation (TV) regularization and 3) has high accuracy through dictionary fitting of the exact time course of the pulse sequence.Methods
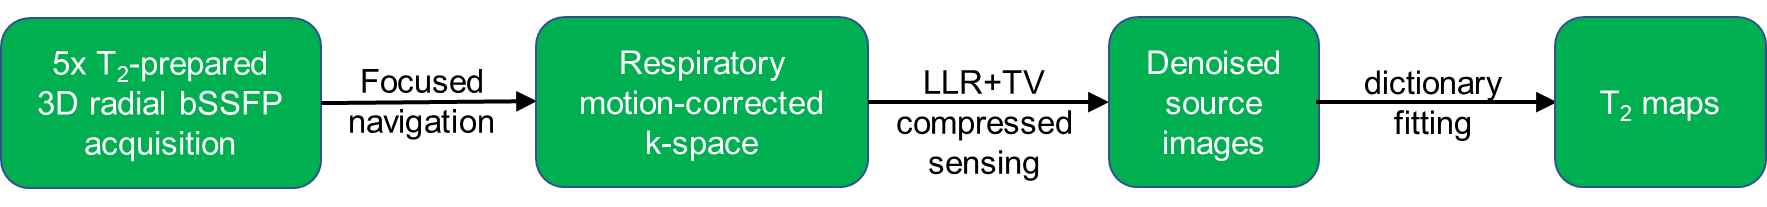
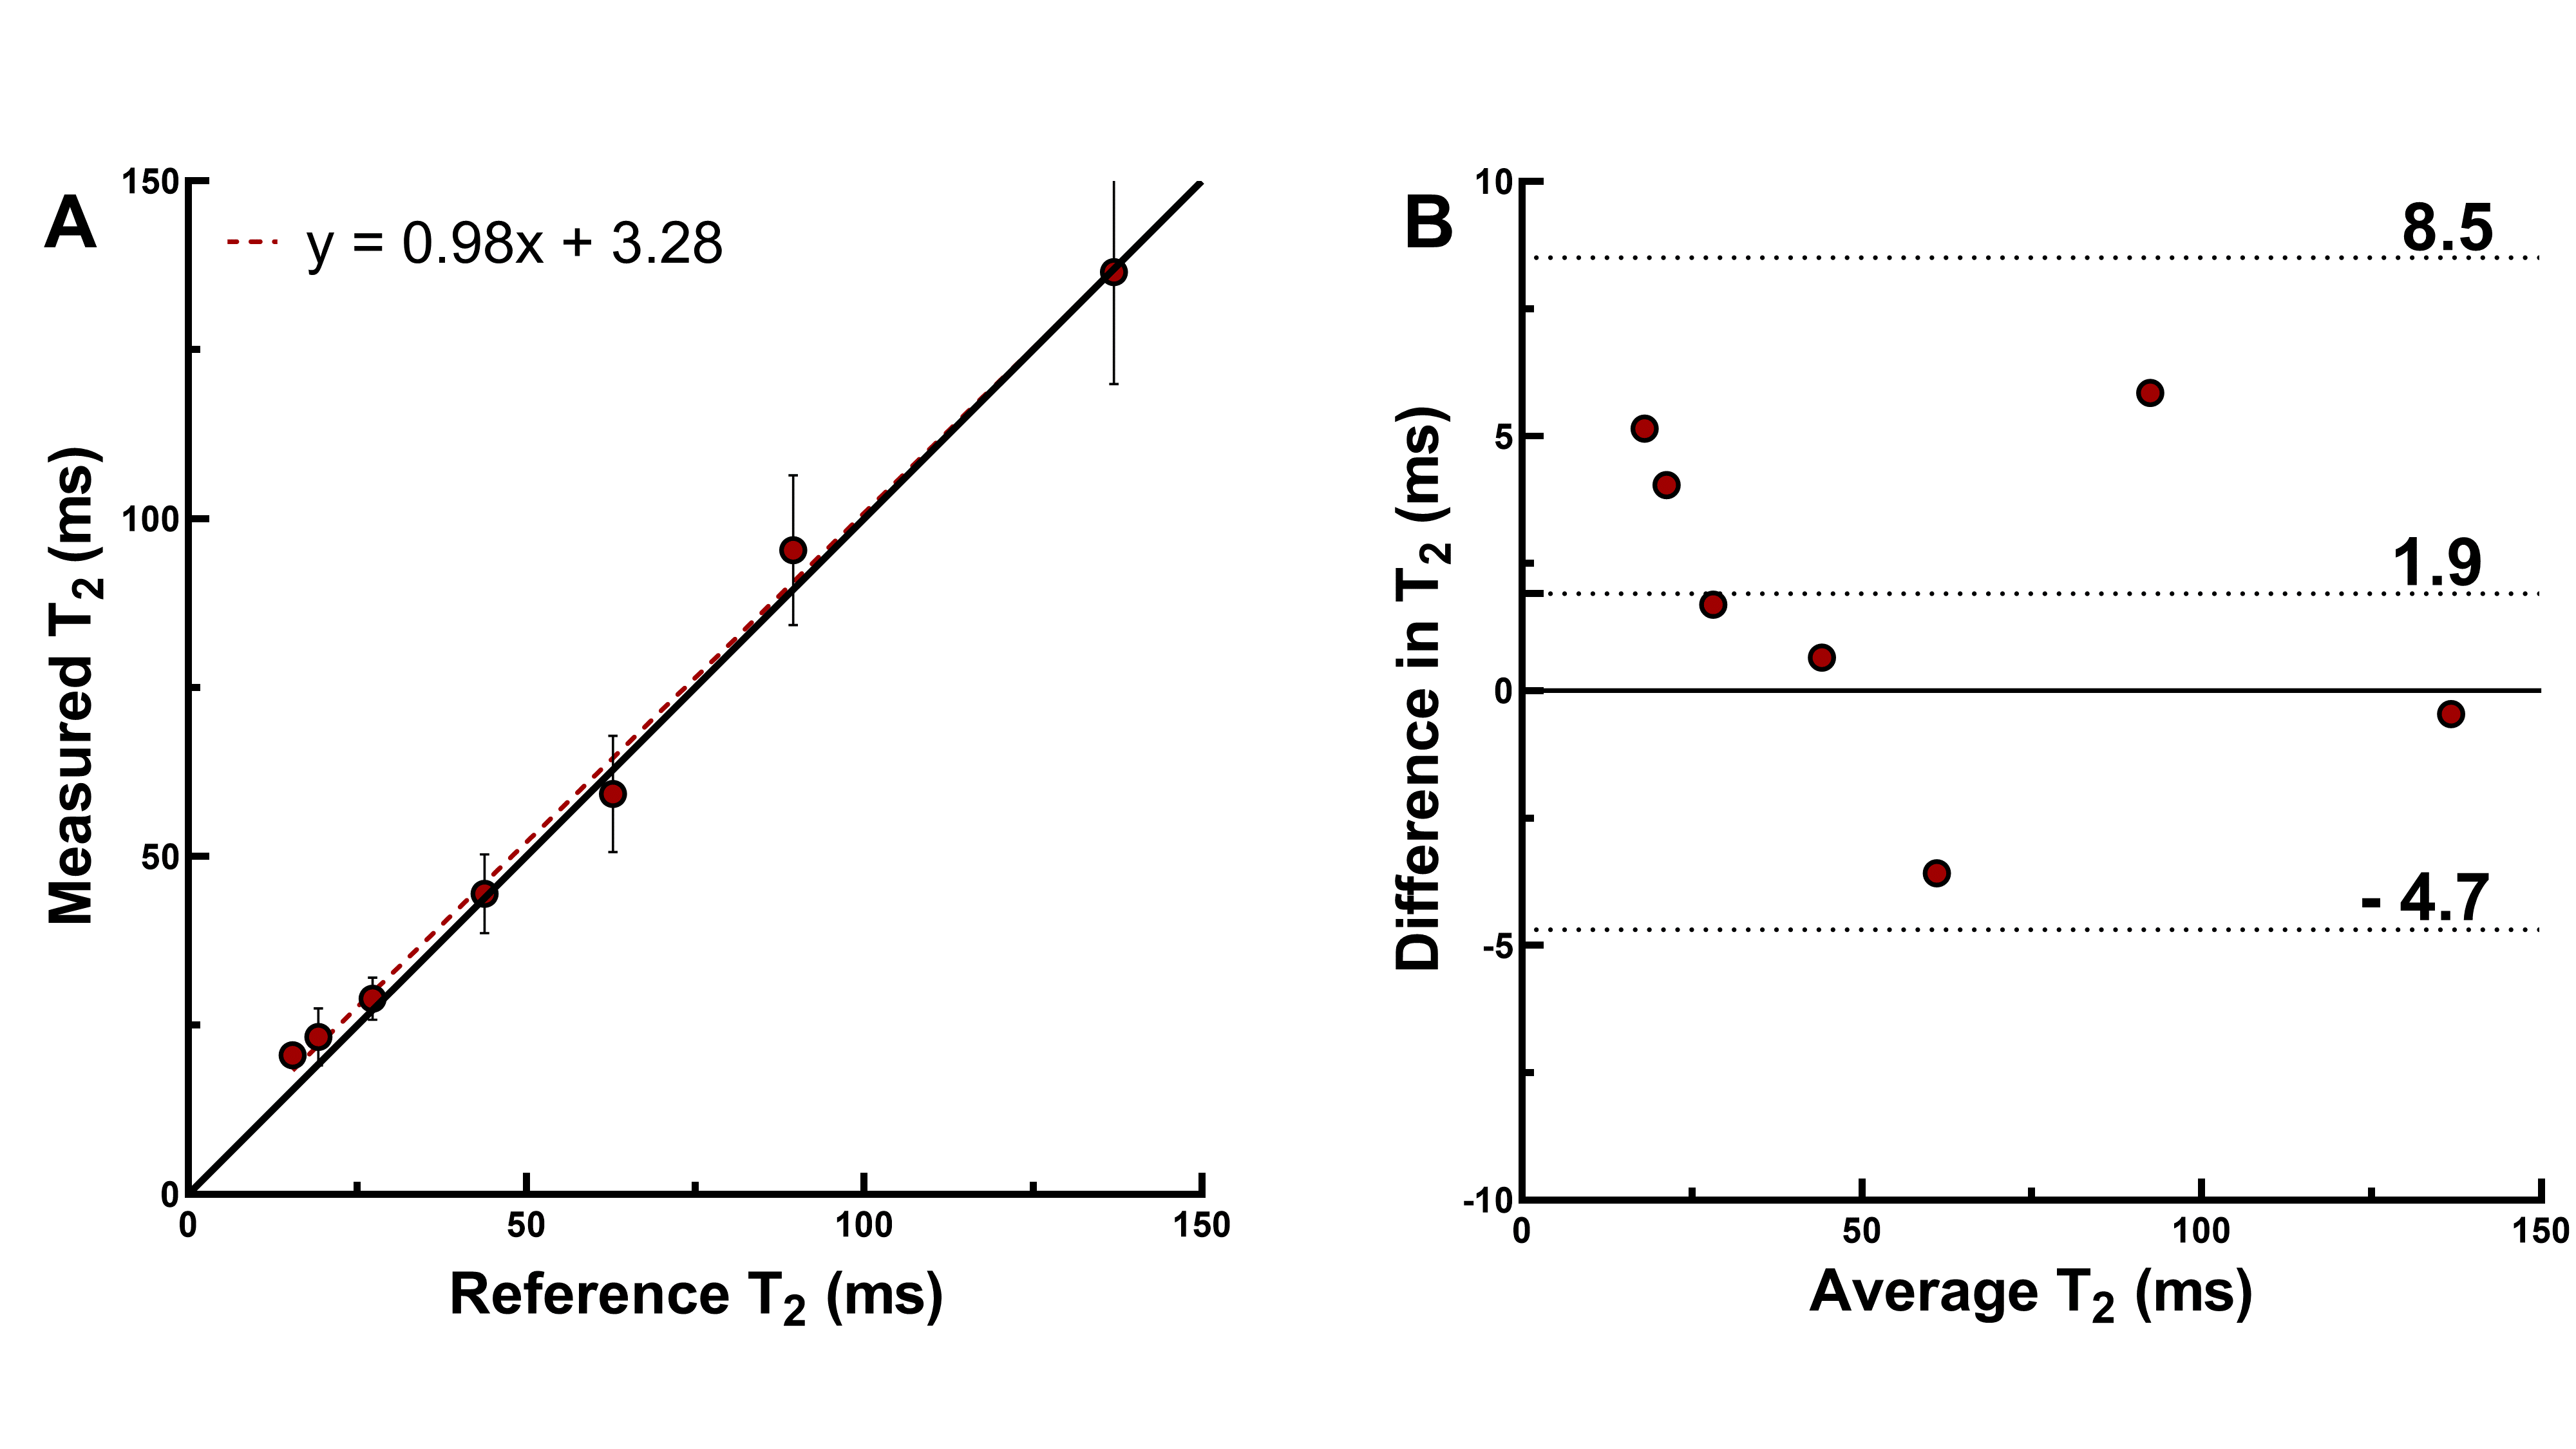
The acquisition (Figure 1) consisted of a prototype ECG-triggered free-breathing 3D radial bSSFP sequence with a phyllotaxis trajectory,6 field of view=(220mm)3, isotropic spatial resolution=(1.5mm)3, TR/TE=3.4/1.7ms, α=40°, acquisition window=150ms, five T2-preparation times TE-T2prep=0/25/40/55/70ms, 3420 readouts/T2prep, and a total acquisition time of 5×76 heartbeats=~6min. All data were acquired on a 1.5T clinical scanner (MAGNETOM Sola, Siemens Healthcare, Erlangen, Germany). Respiratory motion was corrected using a recently developed autofocusing technique that derives 3D respiratory motion from a periodically acquired radial readout called focused navigation (fNAV).7 Source images were reconstructed with LLR regularization along the T2prep dimension (λ=0.015) and TV denoising (λ=0.05). For each scan, Bloch equation simulations were used to generate a dictionary with a range of T2 values. A pixel-wise fit of the source images with this dictionary then resulted in the map. The accuracy of the technique was established through comparison to spin-echo T2 mapping in the ISMRM-NIST phantom (QalibreMD). The lowest considered T2 values in the phantom was 15ms, and the highest was 430ms. The average relaxation times in each vial were compared to the reference by linear regression and Bland-Altman analysis.Next, the technique was applied to the heart of 4 healthy volunteers (age=29±7y, 2 female) with IRB approval and written informed consent, and a Student’s t-test was used to compare the average values in the corresponding myocardial area to routine breath-held 2D T2 mapping.8 Finally, we applied this technique in one patient (age=87y, female) with a right coronary artery (RCA) myocardial infarction.
Results
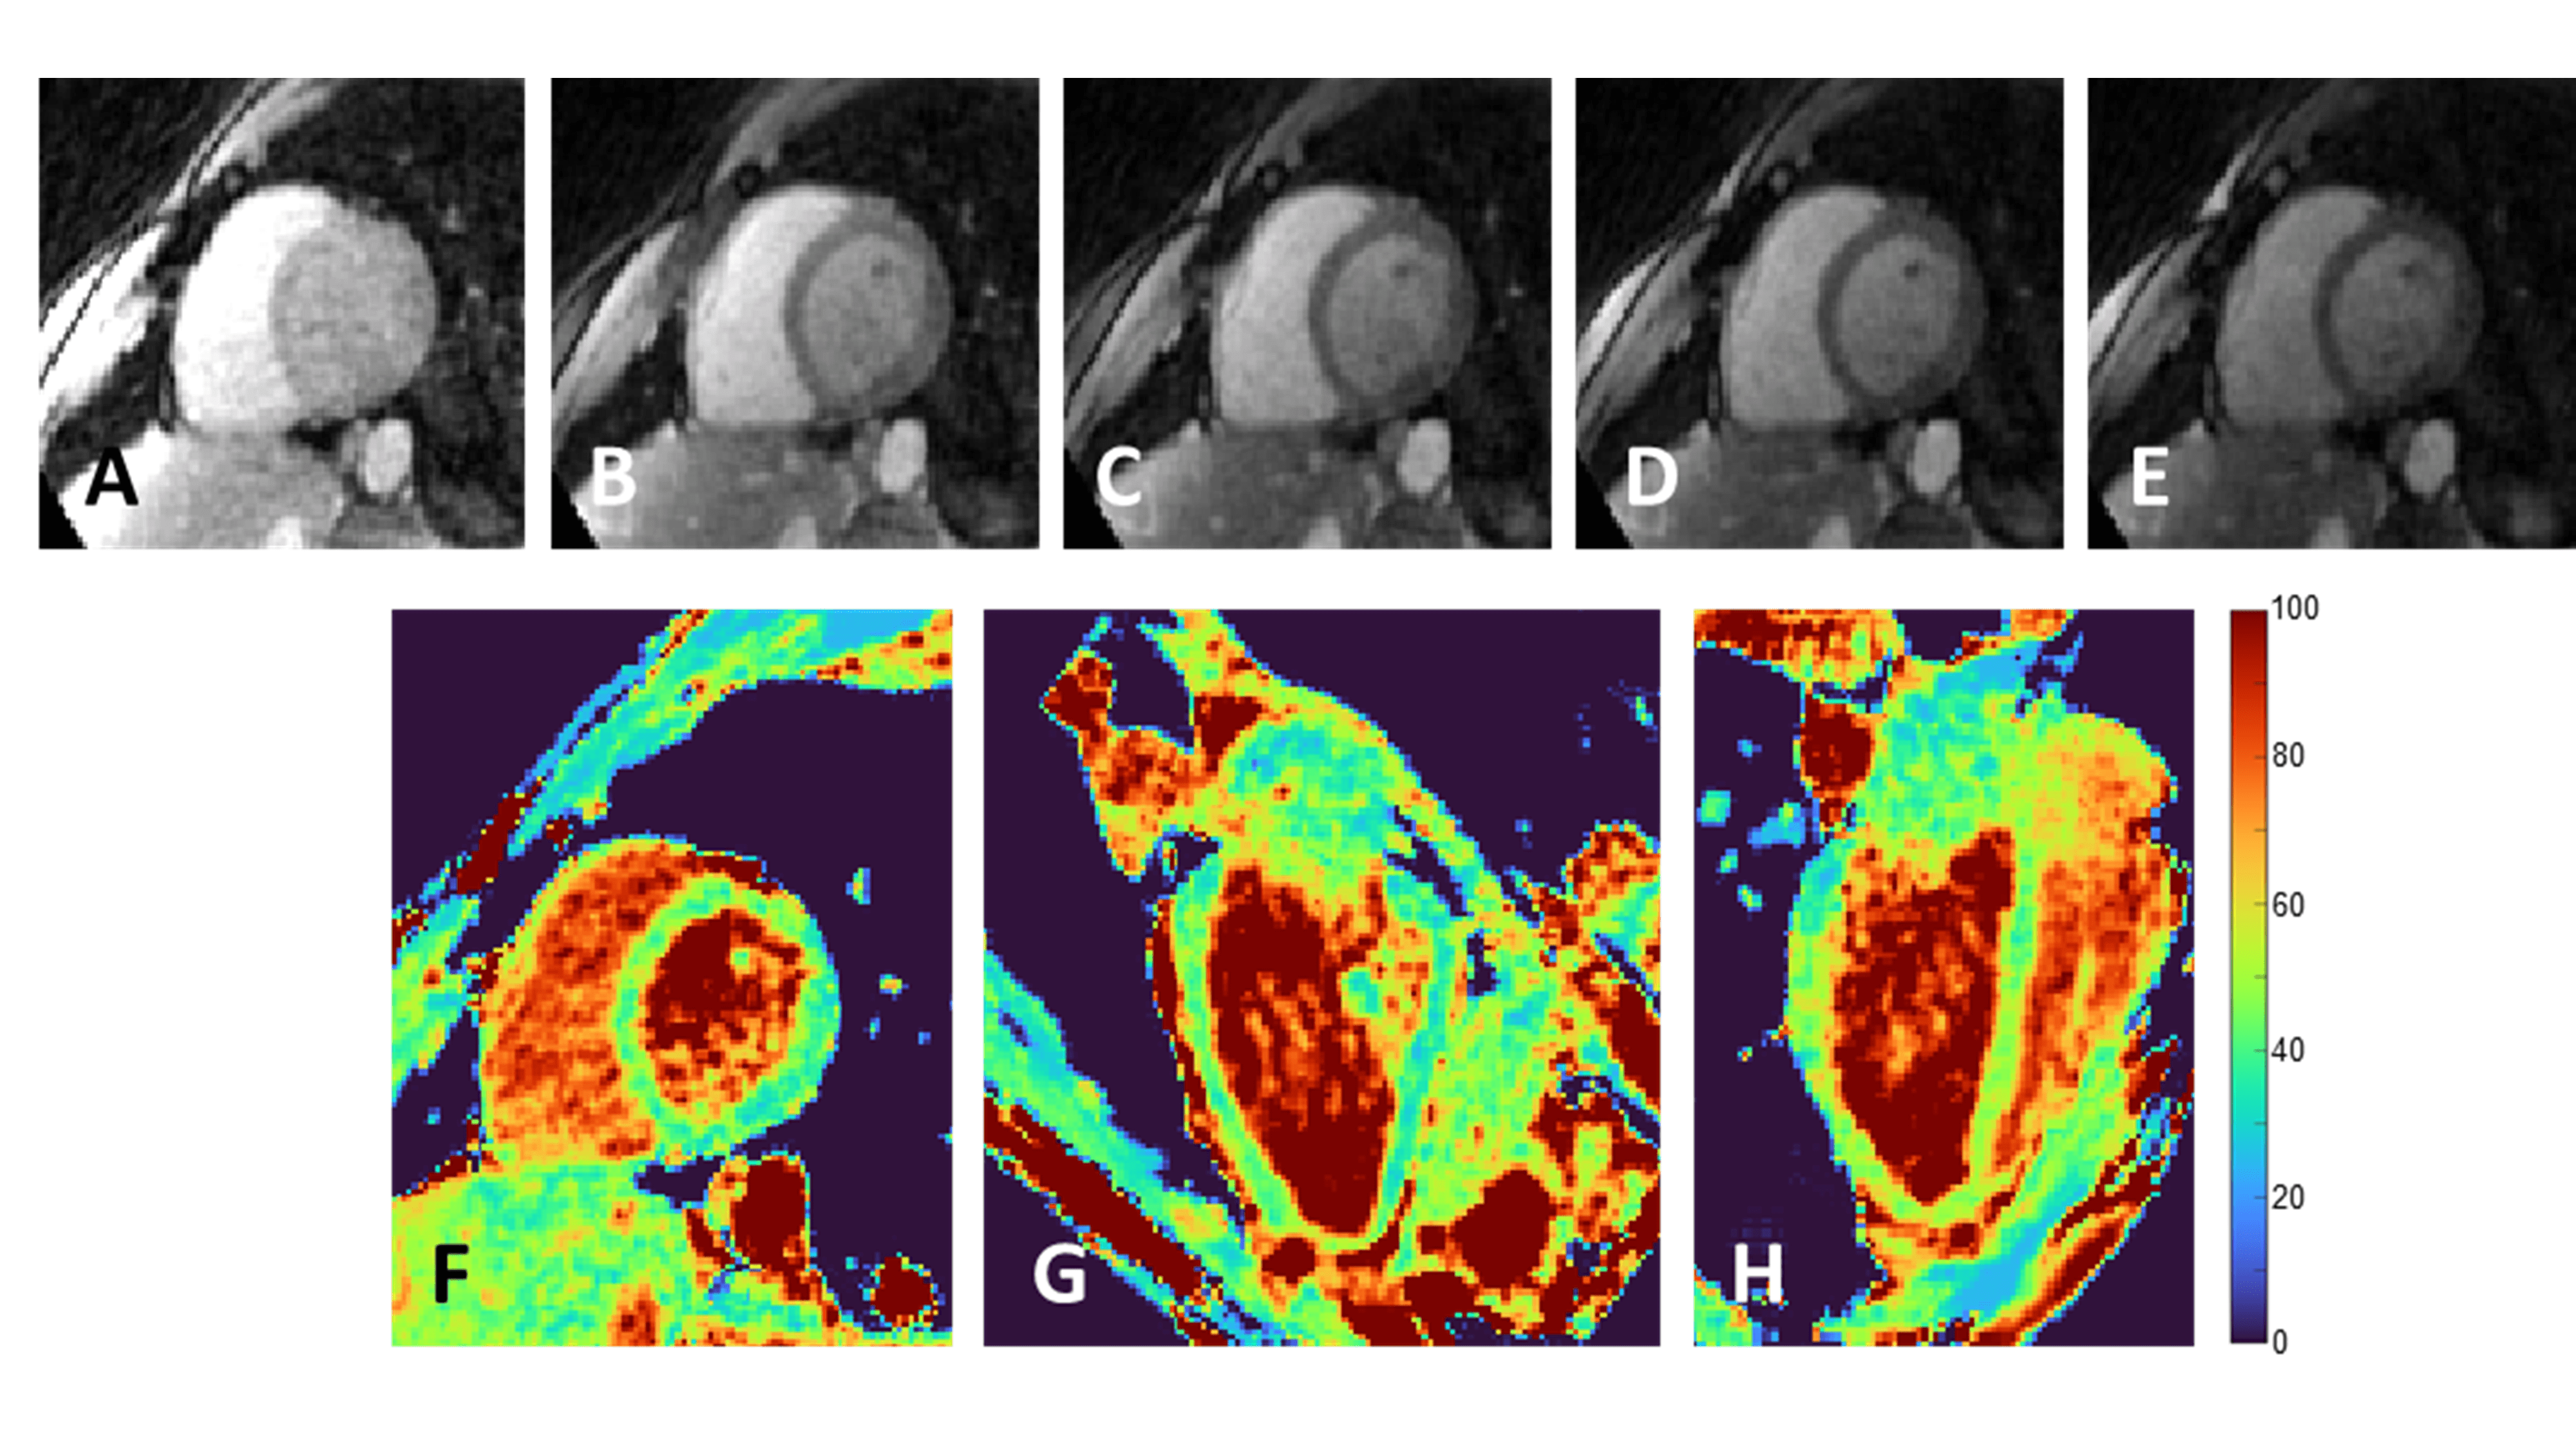
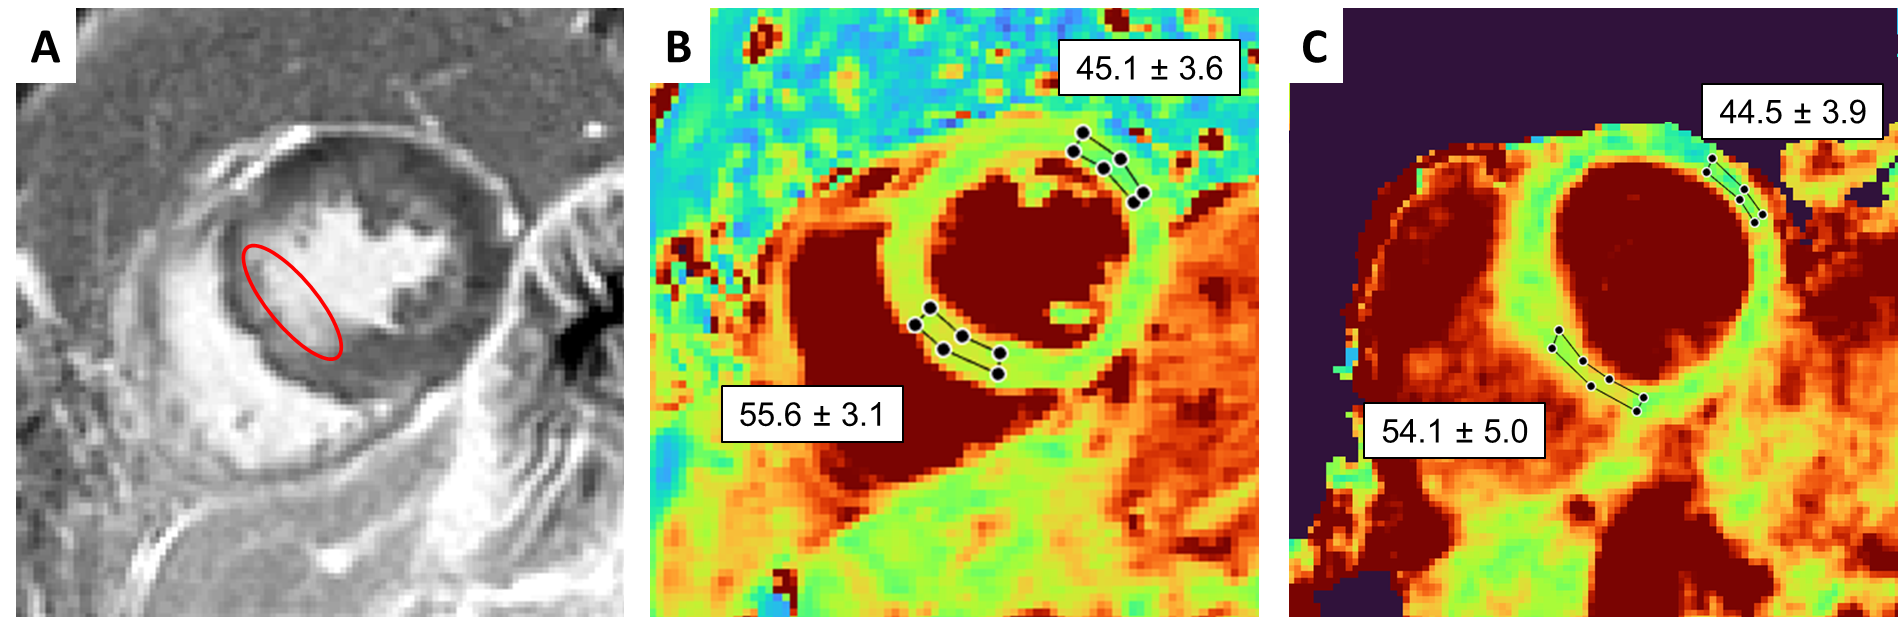
The phantom T2 maps demonstrated good agreement with the gold standard over the relevant T2 range (y=0.98x+3.28, R2=0.99, Fig.2A-B). The fNAV correction resulted in well-aligned source images with no visible motion artifacts. The CS-based reconstruction provided sharp and denoised source images in the healthy volunteers (Fig.3A-E), which translated into sharp and precise T2 maps (Fig.3F-H). The 3D myocardial T2 values in vivo were in agreement with those of routine 2D maps (T2=49.5±4.6ms vs. 46.6±2.8ms, respectively, p=0.57), but had a lower precision: the average standard deviation in the segmented myocardium was 7.8ms for the proposed sequence, and 4.1ms for routine 2D maps. In the patient, our technique matched the T2 values obtained with routine breath-held 2D T2 mapping, despite the small T2 elevation in the infarcted region (Fig.4).Discussion
The proposed technique showed good correlation to the reference T2 relaxation times in the NIST phantom, as well as a low bias. The in-vivo T2 values agreed well with those of the routine 2D technique, both in the healthy volunteers and the patient. The lower precision that was found is mostly likely caused by the 11-fold smaller pixel size.In conclusion, we demonstrated the high accuracy of a novel fast high-resolution 3D T2 mapping technique for the heart. The benefit of the motion robustness of the technique due to the fNAV and radial acquisition needs to be demonstrated in a large patient study. Furthermore, the image and map reconstruction can be further optimized to increase the mapping precision.
Acknowledgements
No acknowledgement found.References
1. Messroghli, D. R. et al. Clinical recommendations for cardiovascular magnetic resonance mapping of T1, T2, T2* and extracellular volume: A consensus statement by the Society for Cardiovascular Magnetic Resonance (SCMR) endorsed by the European Association for Cardiovascular Imaging (EACVI). J Cardiovasc Magn Reson 19, 75 (2017).
2. van Heeswijk, R. B. et al. Self-navigated isotropic three-dimensional cardiac T2 mapping. Magn. Reson. Med. 73, 1549–54 (2015).
3. Ding, H. et al. Three-dimensional whole-heart T2 mapping at 3T. Magn. Reson. Med. 74, 803–16 (2015).
4. Milotta, G. et al. 3D Whole-heart free-breathing qBOOST-T2 mapping. Magn. Reson. Med. 83, 1673–1687 (2020).
5. Bustin, A. et al. Accelerated free‐breathing whole‐heart 3D T 2 mapping with high isotropic resolution. Magn. Reson. Med. 83, 988–1002 (2020).
6. Piccini, D., Littmann, A., Nielles-Vallespin, S. & Zenge, M. O. Spiral phyllotaxis: the natural way to construct a 3D radial trajectory in MRI. Magn. Reson. Med. 66, 1049–1056 (2011).
7. Roy, C. W. et al. Motion Compensated Whole-Heart Coronary Magnetic Resonance Angiography using Focused Navigation (fNAV). arXiv:2010.14206 (2020).
8. Giri, S. et al. T2 quantification for improved detection of myocardial edema. J. Cardiovasc. Magn. Reson. 11, 56 (2009). 9. Hamilton, J. I. et al. MR Fingerprinting for Quantification of Myocardial T1, T2, and M0. in (2015).
Figures