0691
Simultaneous T1, T2 and T1Ρ cardiac Magnetic Resonance Fingerprinting for Contrast-free Myocardial Tissue Characterization1School of Biomedical Engineering and Imaging Sciences, King's College London, London, United Kingdom
Synopsis
Cardiac Magnetic Resonance Fingerprinting (MRF) has shown promising results for myocardial fibrosis and inflammation characterization. In addition, T1ρ mapping has shown promising results for detection of focal and diffuse myocardial fibrosis without the need of exogenous contrast agents. However, multiparametric T1, T2 and T1ρ mapping requires sequential acquisitions under several breath-holds, that can lead to non-registered maps and bias due to inter-parameter dependencies. In this work we propose a cardiac MRF acquisition scheme for simultaneous quantification of myocardial T1, T2 and T1ρ in a contrast-free single breath-hold MR scan. The proposed approach has been investigated in phantoms and healthy subjects.
Introduction
Cardiac Magnetic Resonance Fingerprinting1 (MRF) has shown promising results for myocardial fibrosis and inflammation characterization, enabling simultaneous T1 and T2 parameter mapping as well as extracellular volume (ECV) mapping, when performed pre- and post-contrast injection2,3. In addition, T1ρ mapping has shown promising results for detection of focal and diffuse myocardial fibrosis without the need of exogenous contrast agents4. However, multiparametric T1, T2 and T1ρ mapping requires sequential acquisitions under several breath-holds, that can lead to non-registered maps, bias due to inter-parameter dependencies, as well as potential patient discomfort. Simultaneous T1, T2 and T1ρ MRF has been recently proposed for liver imaging5; however, cardiac MRF requires significantly higher undersampling factors due to ECG gating and breath-holding limiting the scan time. In this work, we propose a novel simultaneous T1, T2 and T1ρ cardiac MRF approach to enable comprehensive contrast-free myocardial tissue characterization in a single breath-hold scan.Methods
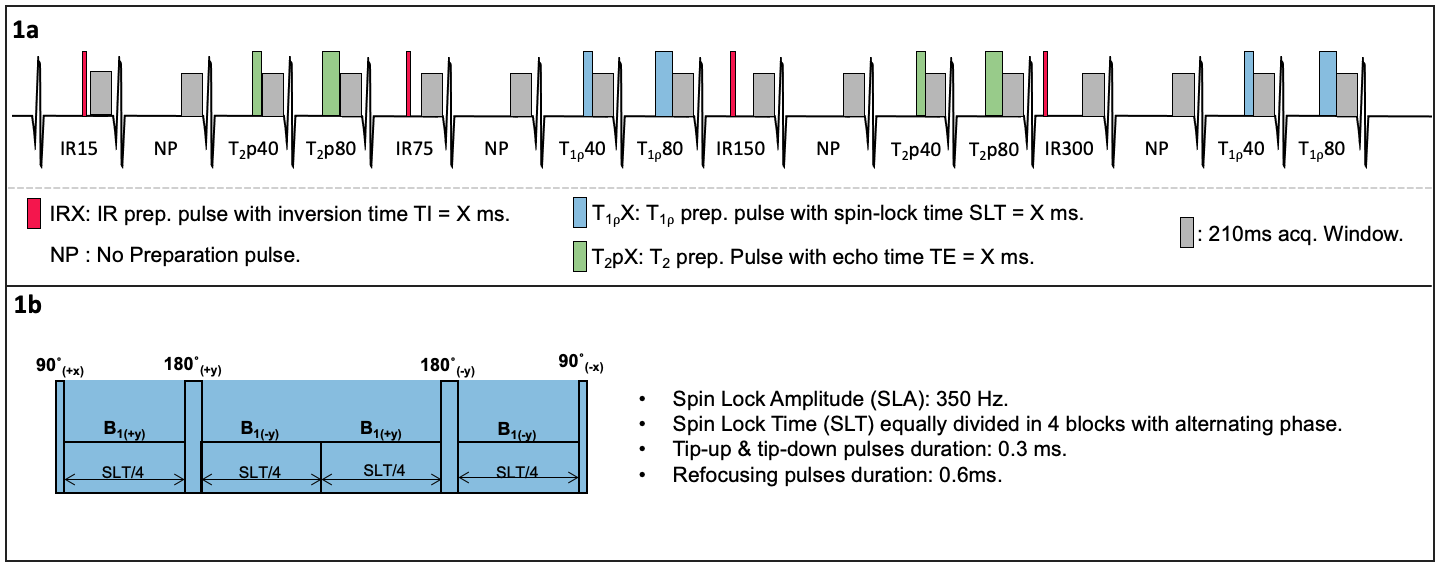
An ECG-triggered 2D cardiac MRF gradient echo sequence for simultaneous quantification of T1, T2 and T1ρ is proposed (Fig.1). Inversion recovery (IR), T2 preparation (T2p, echo times T2pTEs = {0, 40, 80 ms}) and T1ρ spin-lock preparation pulses (spin lock times SLTs = {0, 40, 80 ms} at 350 Hz) are applied at different heartbeats to encode T1, T2 and T1ρ. T1ρ preparation pulses robust to both B1 and B0 inhomogeneities were considered6. The acquisition consists of 16 heartbeats, performed under breath-hold. Highly undersampled MRF images are reconstructed using a multi-contrast patch-based higher-order low-rank reconstruction7 and matched to a subject-specific EPG-based8 dictionary (considering ~140000 different T1/T2/T1⍴ combinations) to obtain the T1, T2 and T1ρ maps.Acquisitions were performed on phantoms and 5 healthy subjects on a 1.5T scanner (Ingenia, Philips Healthcare). Acquisition parameters included: 30 spiral readouts per heartbeat, sinusoidally varying FA of 5°-10°, TE/TR = 0.91/7.11 ms, scan time ~16s. Phantom scans were performed on a set of sample tubes filled with water and different solutions of varying concentrations of agar (for T2 and T1⍴ variation) and a Gd-based contrast agent (for T1 variation). Conventional, sequential T1-MOLLI, T2-GRaSE and T1⍴-reference scans were performed with clinically used parameters for comparison purposes. The T1⍴-reference scan consisted of 5 consecutive single shot TFE acquisitions (SLTs = {0, 10, 25, 50, 60 ms}, at 350 Hz) with a 4.5s gap between SLT acquisitions to allow for magnetization recovery.
Results
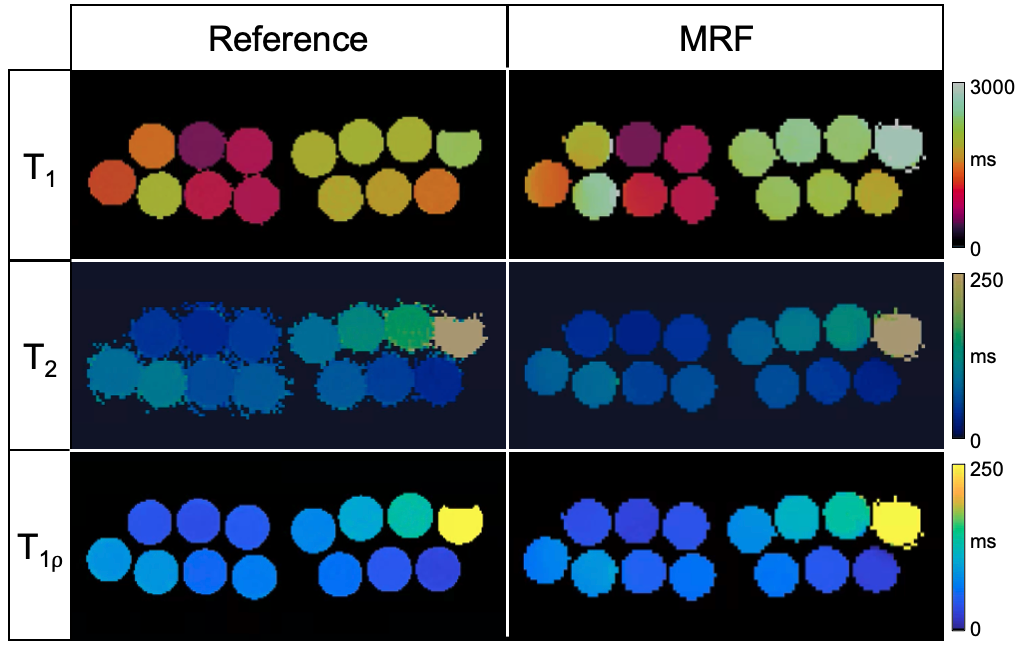
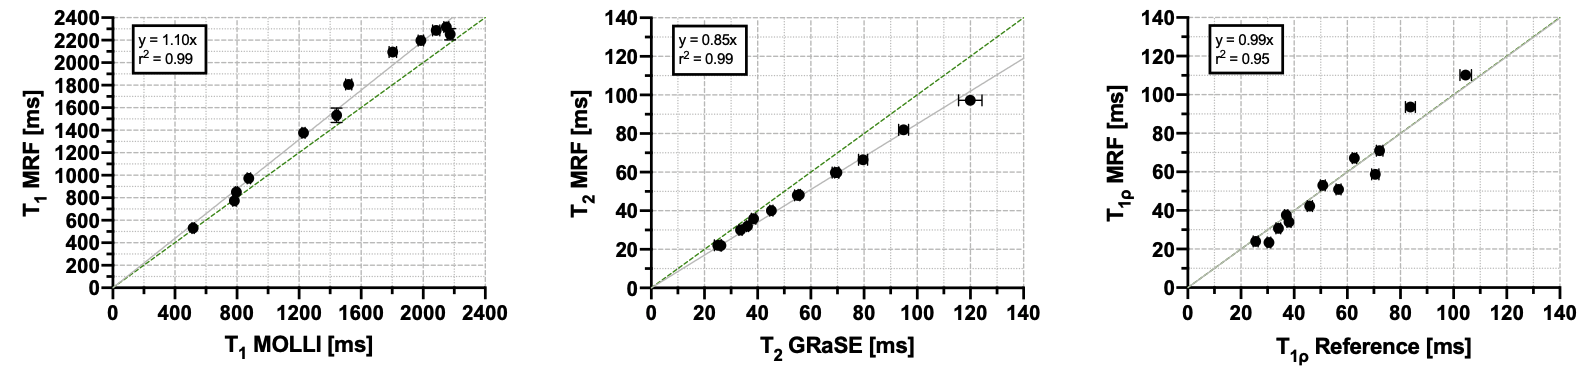
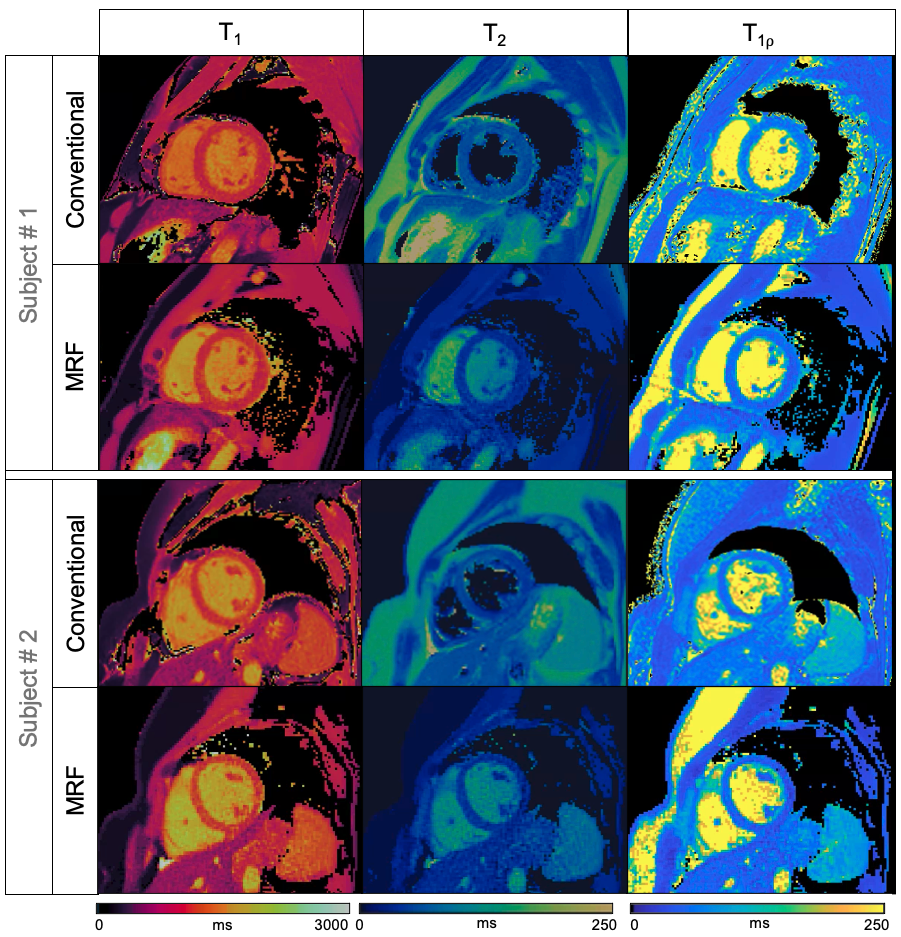
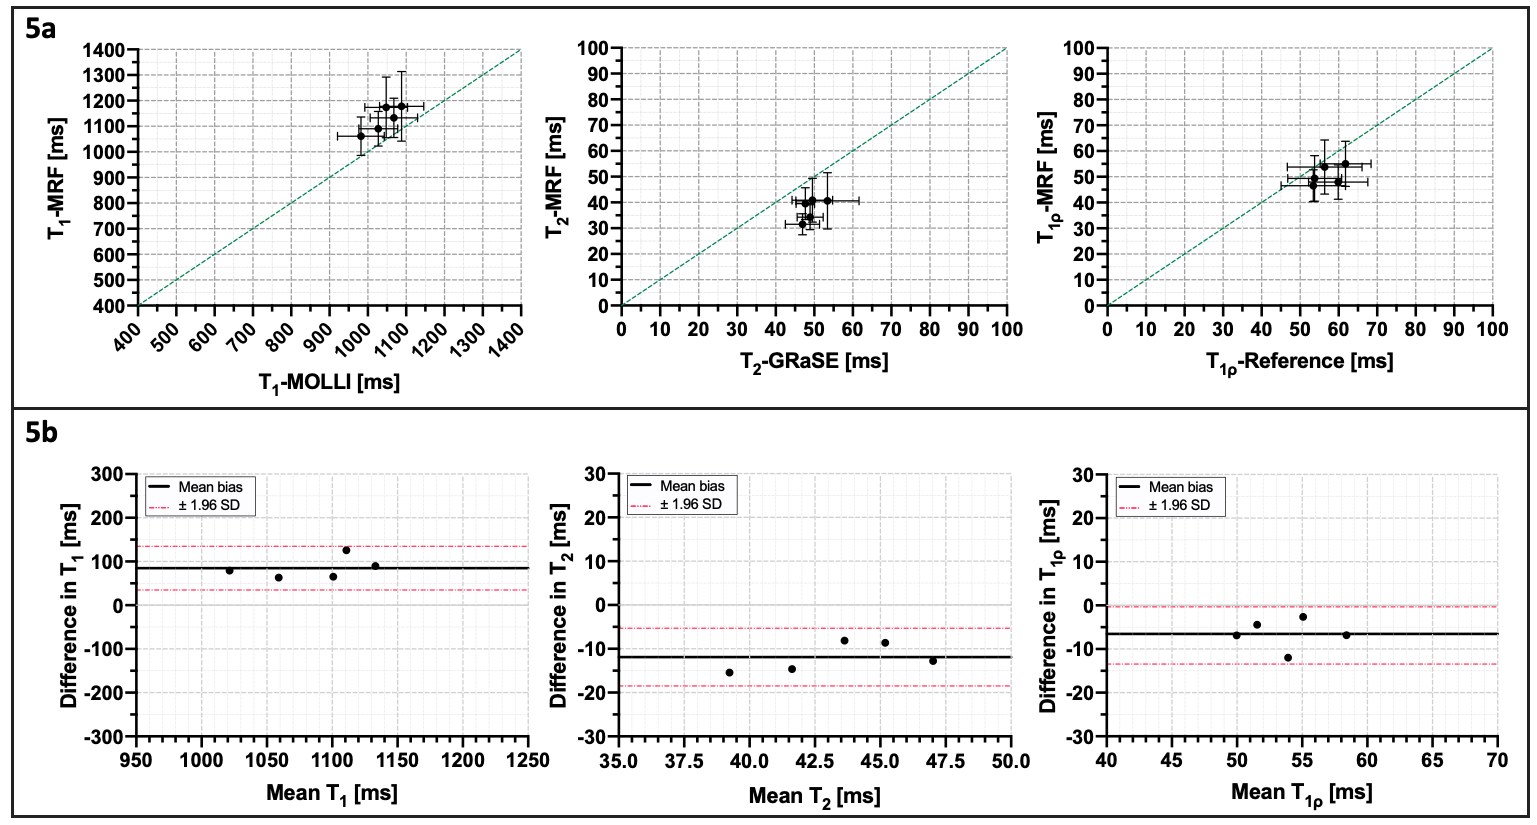
Representative phantom T1, T2 and T1⍴ maps are shown in Figure 2 in comparison to the corresponding reference maps. Values and correlation from T1, T2 and T1⍴ cardiac MRF quantification against their reference value are shown in Figure 3. Good linear fit, close to the identity line (slopes: m = 1.10, m = 0.85 and m = 0.99 for T1, T2 and T1⍴ respectively, with their y-intercepts not significantly different from 0) and excellent correlation (r2 = 0.99, r2 = 0.99 and r2 = 0.95 for T1, T2 and T1⍴ respectively) was achieved for all parameters. Representative T1, T2 and T1⍴ maps for two healthy subjects are shown in Figure 4 in comparison to clinical conventional T1-MOLLI, T2-GRaSE and T1⍴-reference maps. ROIs were manually drawn inside the myocardial septum. Quantification and comparison against reference values are shown in Figure 5 for all healthy subjects. A slight overestimation in T1 and underestimation in T2 and T1⍴ can be found, which is consistent with previous findings1,5. Bland-Altman plots of T1, T2 and T1⍴ MRF values against their references (Figure 5b) show that deviation from the reference does not increase at higher values.Conclusion
We propose a cardiac MRF acquisition scheme for simultaneous quantification of myocardial T1, T2 and T1ρ in a contrast-free single breath-hold MR scan. The proposed approach has been investigated in phantoms and healthy subjects. Further studies are warranted to validate the technique in patients with cardiovascular disease.Acknowledgements
This work was supported by EPSRC (EP/P001009, EP/P032311/1, EP/P007619/1) and Wellcome EPSRC Centre for Medical Engineering (NS/ A000049/1).References
1. Hamilton J.I. et al. Magn. Reson. Med. (2017). 77: 1446-1458. doi:10.1002/mrm.26216.
2. Huang T. et al. Magn. Reson. Med. (2007). 57: 960-966. doi:10.1002/mrm.21208.
3. Jaubert O. et al. J. Magn. Reson. Imaging. (2020). doi:10.1002/jmri.27415.
4. Han Y. et al. Curr. Cardiovasc. Imaging Rep. (2014). 7(2):9248. doi: 10.1007/s12410-013-9248-7.
5. Wyatt C.R. et al. NMR in Biomedicine. (2020). doi:10.1002/nbm.4284.
6. Qi H. et al. J. Cardiovasc. Magn. Reson. (2020). 22, 12. doi:10.1186/s12968-020-0597-5.
7. Bustin A et al. Magn Reson Med. (2019). 81(6):3705-3719. doi:10.1002/mrm.27694.
8. Weigel M. J. Magn. Reson. Imaging. (2015). doi:10.1002/jmri.24619.
Figures