0689
Characterization of Cardiac Amyloidosis using Cardiac Magnetic Resonance Fingerprinting: Preliminary Results1Imaging Institute, Cleveland Clinic, Cleveland, OH, United States, 2Radiology, University of Michigan, Ann Arbor, MI, United States, 3Heart and Vascular Institute, Cleveland Clinic, Cleveland, OH, United States, 4Case Western Reserve University, Cleveland, OH, United States
Synopsis
Cardiac amyloidosis is an infiltrative cardiomyopathy characterized by the accumulation of misfolded proteins in the myocardium. Elevated myocardial T1 and T2 have been reported as a potential biomarker of disease. Cardiac Magnetic Resonance Fingerprinting (cMRF) has the potential to provide improved tissue characterization for cardiac amyloidosis through simultaneous T1 and T2 mapping. Furthermore, signal evolutions obtained by cMRF may enable improved tissue characterization. In this preliminary study of cardiac amyloidosis patients, relaxometric quantities and signal evolution data are analyzed. Myocardial T1 and T2 were elevated in patients, and linear discriminant analysis of signal evolution data suggests improved discrimination of disease.
Introduction
Cardiac amyloidosis (CA) is characterized by the accumulation of misfolded amyloid proteins in the myocardium that impair cardiac function. Quantitative T1 and T2 values can be used to detect diseased tissue, potentially expediting diagnosis and treatment. Cardiac Magnetic Resonance Fingerprinting (cMRF) simultaneously quantifies myocardial T1 and T2 in a single breath-hold and has the potential to streamline cardiac MRI protocols while providing improved tissue characterization through analysis of signal evolution data. The use of cMRF for characterization of CA was evaluated as part of an ongoing study.Methods
Six patients with CA (age: 62±12) and four healthy controls (age: 33±3) were scanned on a 3T Siemens Prisma scanner. Three cardiac short axis slices were acquired with cMRF for assessment of native left ventricular myocardium T1 and T2 values. The cMRF sequence has been reported previously1 and consists of a 15-heartbeat, ECG gated (end diastole), single breath-held acquisition with spiral readout and spatial resolution of 1.6x1.6x8 mm3 at 300 mm FOV. Nonuniform fast Fourier transform2 was used for gridding of undersampled images for T1 and T2 quantification and signal analysis. A dictionary of T1 values ranging from 10 to 2000 ms in 10 ms increments, 2050 to 3000 in 50 ms increments, and T2 values ranging from 4 to 80 in 2 ms increments, 85 to 120 in 4 ms increments, and 130 to 300 in 10 ms increments was generated. The dictionary included corrections for slice profile and preparation pulse efficiency.3 T1 and T2 maps were computed by inner product matching between the measured signal evolutions and the dictionary.4 Average segmental values were obtained in manually drawn regions of interest according to the American Heart Association 16-segment model. Segmental values were averaged to obtain a surrogate measure of global myocardial T1 and T2. Segmental and global values were compared between healthy controls and patients using unpaired, two-sided t-tests. In order to investigate the potential for additional information present in cMRF signal evolutions as compared to T1 and T2 values, data were analyzed using linear discriminant analysis (LDA) and calculation of the Fisher coefficient. The Fisher coefficient has similarly been used to compare feature sets for classification tasks such as in MRI texture analysis.5 For this analysis, large regions of interest were drawn in the mid-ventricular septal myocardium to obtain T1 and T2 values as well as signal evolutions. Complex-valued signal evolutions were averaged within ROIs to reduce noise, and the absolute-valued signal evolution was recorded for each subject. Regularized LDA was used to account for small sample size in the signal evolution analysis. Separability of the amyloid and control classes was evaluated for both relaxometric data-based LDA and signal-based LDA using the Fisher coefficient, and the corresponding LDA scores were analyzed. LDA scores were compared between healthy controls and patients using unpaired, two-sided t-tests.Results
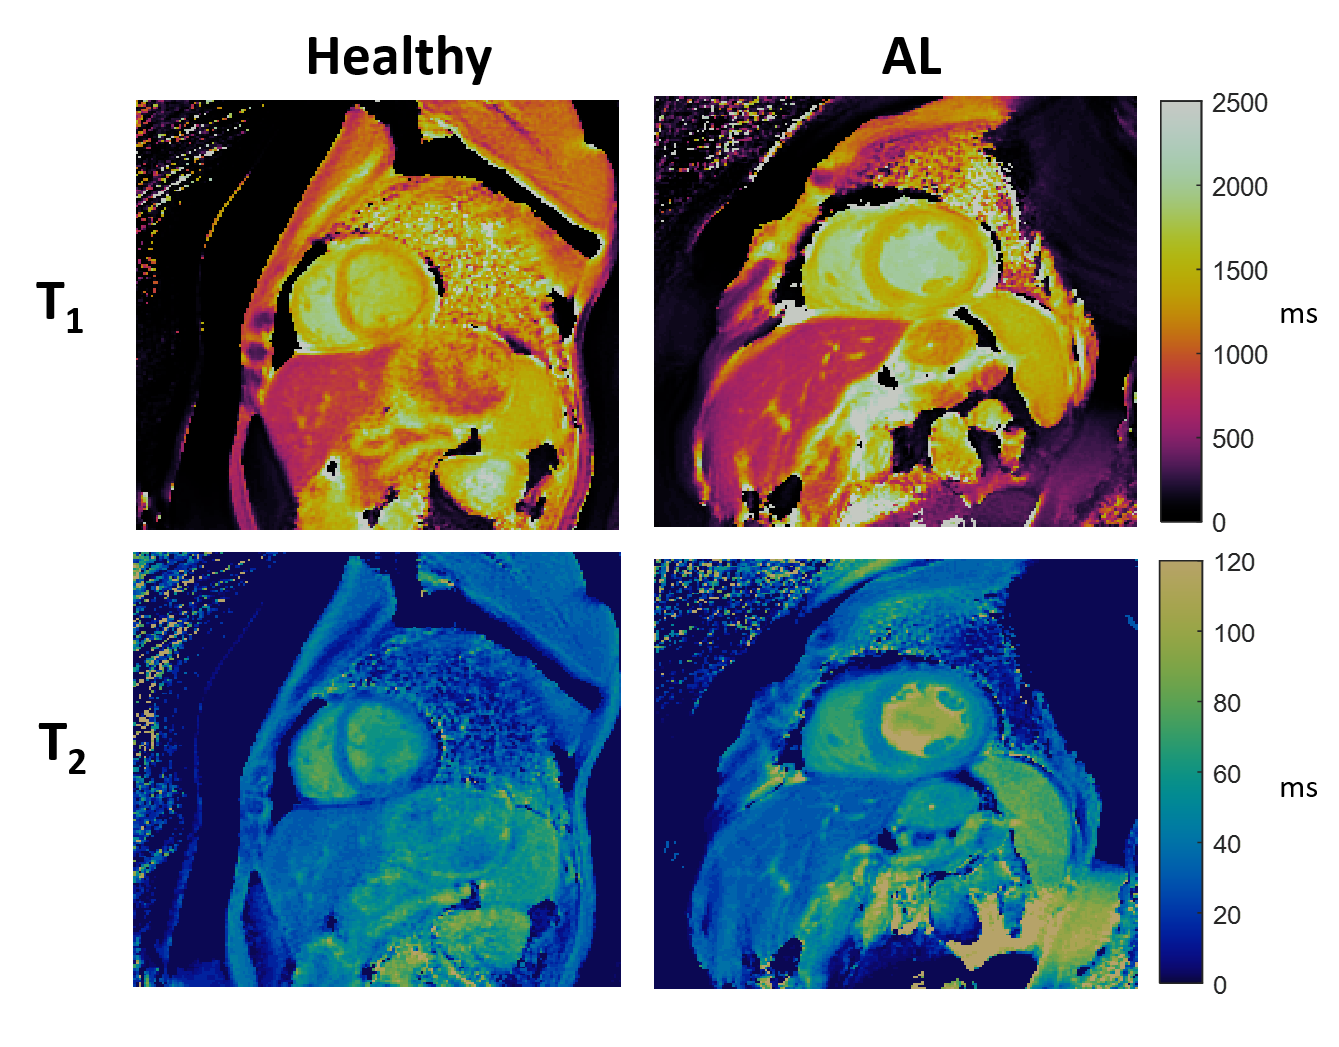
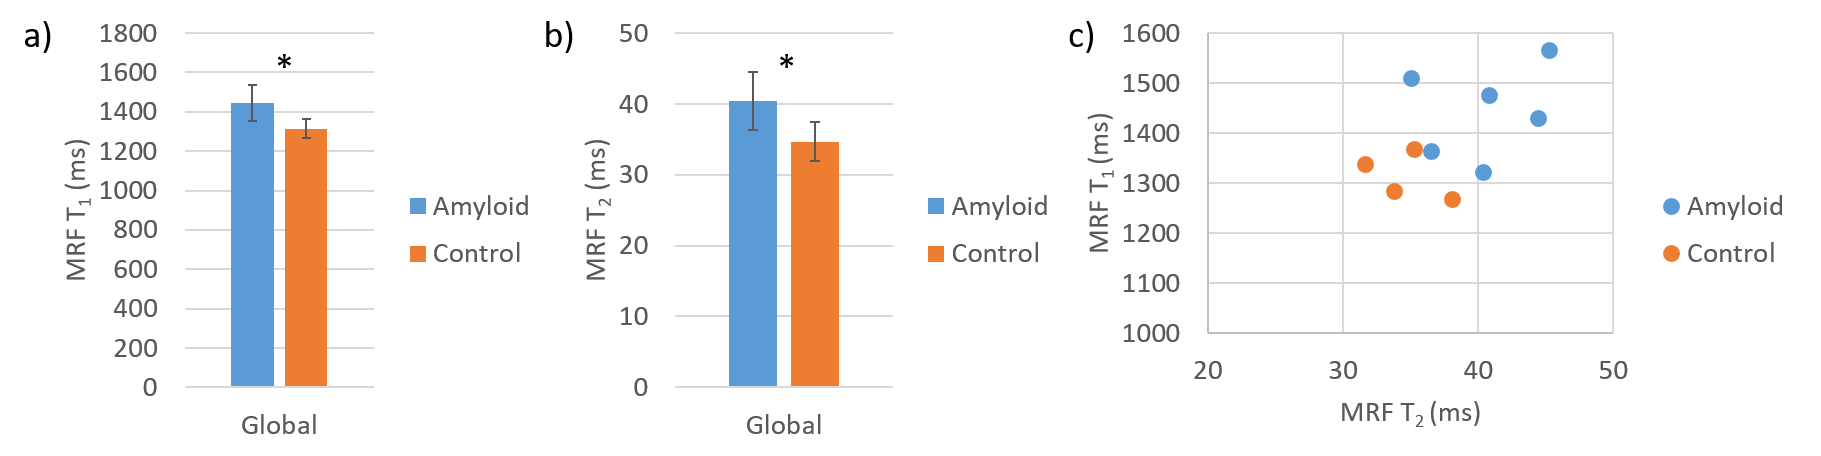
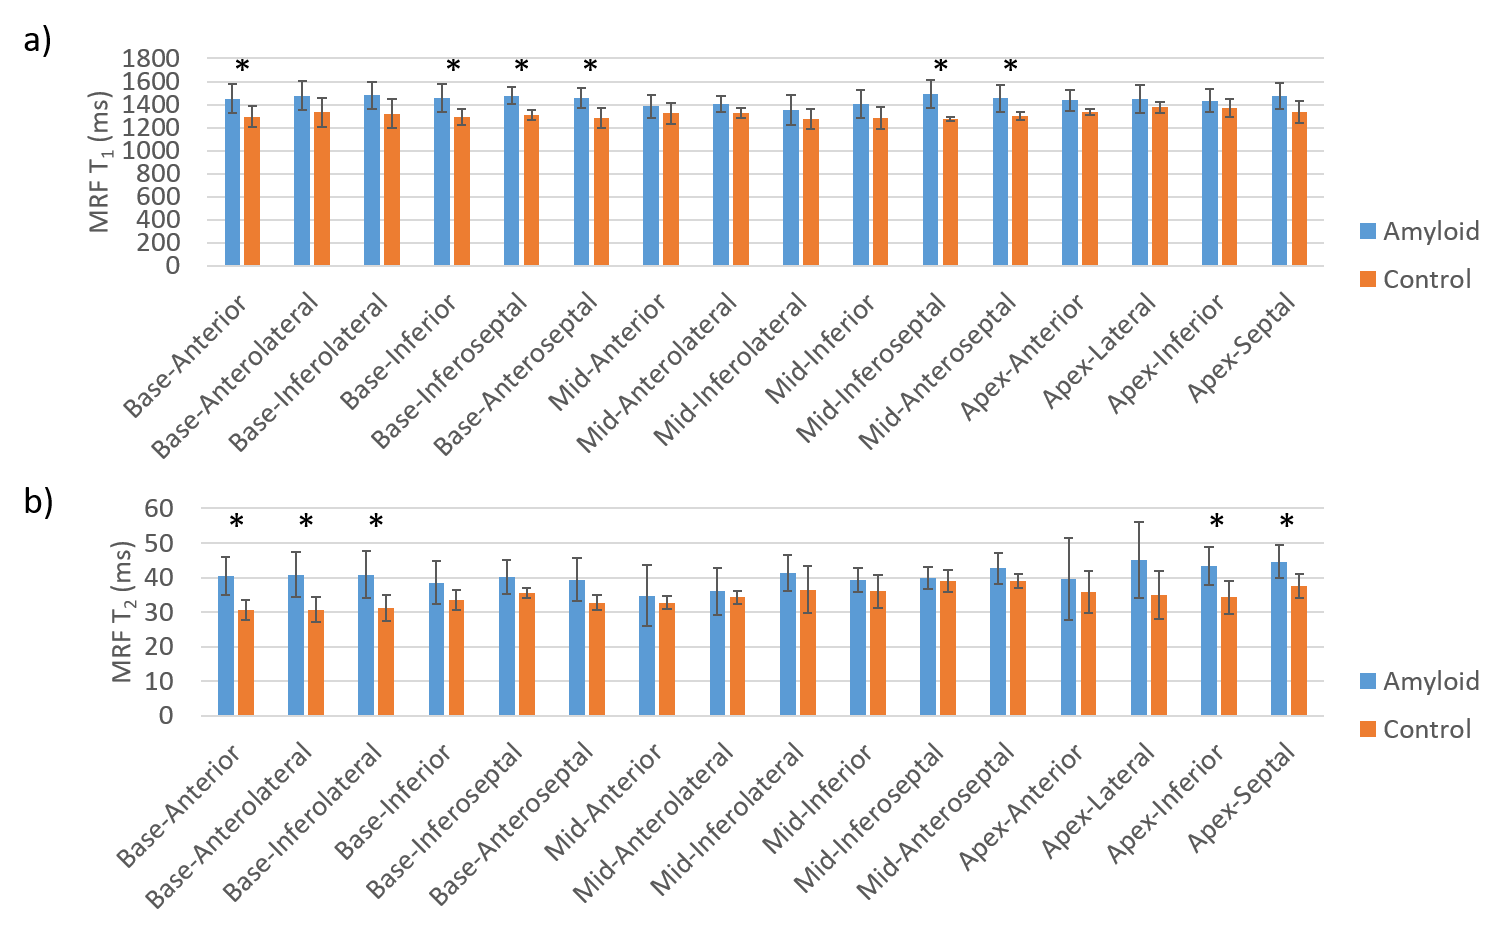
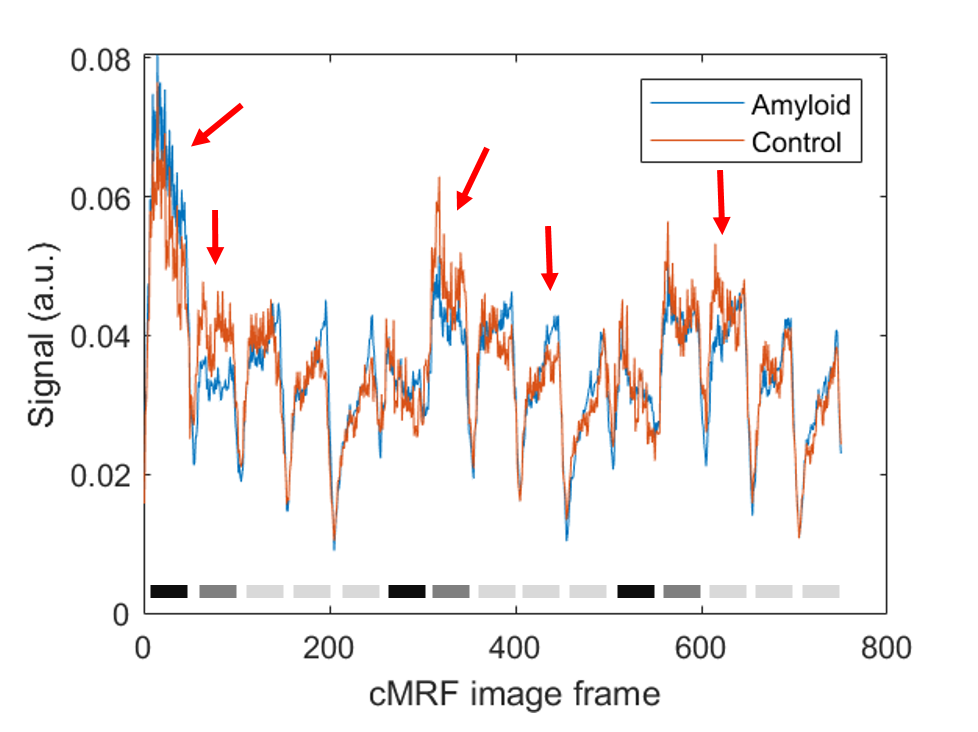
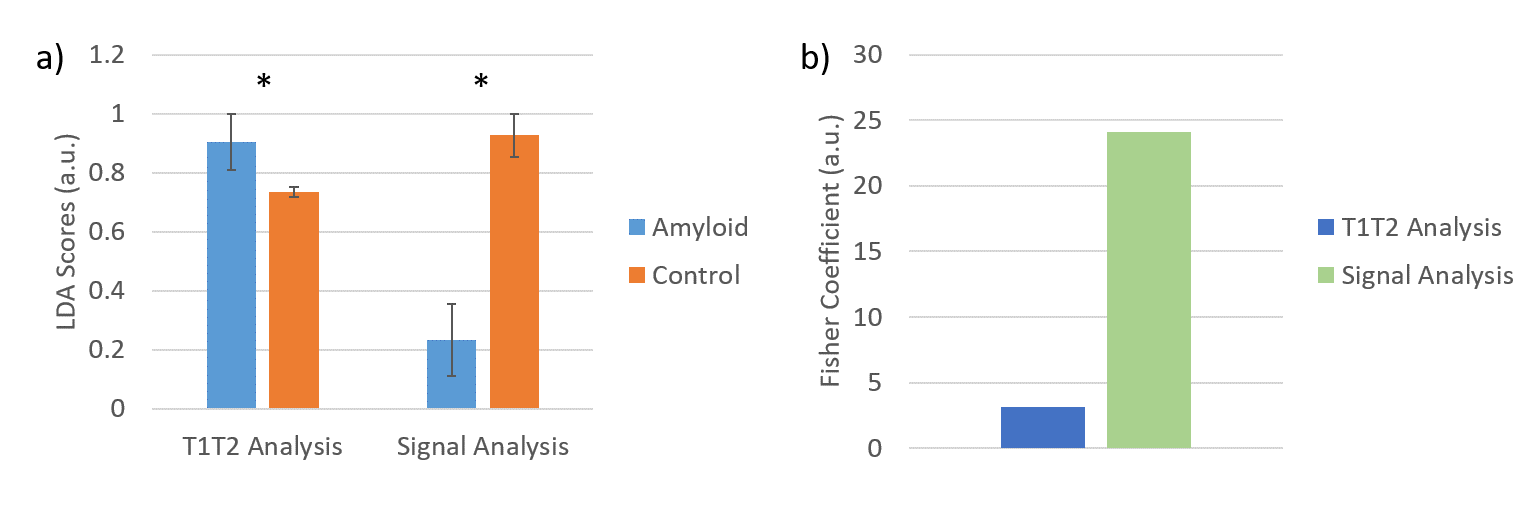
Representative T1 and T2 maps are shown in Figure 1. Global native T1 and T2 values are shown in Figure 2. Native myocardial T1 was elevated in patients relative to healthy subjects by cMRF (1445±91 vs 1315±47 ms, p<0.05). Native myocardial T2 was also significantly elevated in patients versus healthy subjects with cMRF (40.4±4.1 vs 34.7±2.7 ms, p<0.05). At a segmental level (Figure 3), elevated T1 and T2 was observed in all segments, but with differing degrees of significance. Averaged cMRF signal evolutions for the patient group and control group are shown in Figure 4 with observable differences at various points in the time course. LDA performed on relaxometric data (T1, T2) and signal evolutions both showed a statistically significant separation in amyloid patients as compared to controls in terms of LDA scores (p<0.01). The Fisher coefficient was larger for the signal-based analysis as compared to the relaxometric analysis (24.1 vs 3.1, respectively), suggesting greater separability between the two groups.Discussion
Elevated T1 and T2 in the patient group were consistently observed, suggesting a significant difference in the tissue properties of the patient group relative to the controls. Although analysis of T1 and T2 values independently provided discrimination of patients from controls, some overlap of these groups was observed. Analysis of signal evolutions with LDA suggests improved discrimination of the groups, as the Fisher coefficient was greater in the signal-based LDA and a greater spread in LDA scores between groups was observed. These observations suggest that there may be additional information in cMRF signal evolutions that is not captured by T1 and T2 quantification alone. However, given the limited sample size, age difference in populations, and potential overfitting or confounding of the signal-based LDA despite the use of regularized LDA, continued study of cMRF for characterization of CA is needed.Conclusion
From these preliminary results, cMRF was found to detect elevated native myocardial T1 and T2 in patients with diagnosed CA. Analysis of magnetic signal evolutions obtained from cMRF may improve discrimination of diseased myocardium from healthy tissue. Continued evaluation of cMRF for characterization of cardiac amyloidosis is warranted.Acknowledgements
This work was funded in part by the following sources: 2R01HL094557 and the Cleveland Clinic Imaging Institute Pilot Projects Program. The content is solely the responsibility of the authors and does not necessarily represent the official views of the NIH or the Cleveland Clinic.References
1. Hamilton, J. I. et al. Simultaneous Mapping of T1 and T2 Using Cardiac Magnetic Resonance Fingerprinting in a Cohort of Healthy Subjects at 1.5T. Journal of Magnetic Resonance Imaging 52, 1044–1052 (2020).
2. Fessler, J. Michigan image reconstruction toolbox. (2018).
3. Hamilton, J. I. et al. Investigating and reducing the effects of confounding factors for robust T1 and T2 mapping with cardiac MR fingerprinting. Magnetic resonance imaging 53, 40–51 (2018).
4. Ma, D. et al. Magnetic resonance fingerprinting. Nature 495, 187–192 (2013).
5. Zhang, J., Tong, L., Wang, L. & Li, N. Texture analysis of multiple sclerosis: a comparative study. Magnetic Resonance Imaging 26, 1160–1166 (2008).
Figures