0685
Myofiber strain in healthy humans using cDTI and Cine DENSE MRI1Department of Radiology, Stanford University, Stanford, CA, United States, 2Department of Radiology, Veterans Administration Health Care System, Palo Alto, CA, United States, 3Cardiovascular Institute, Stanford University, Stanford, CA, United States, 4University of Lyon, UJM-Saint-Etienne, INSA, CNRS UMR 5520, INSERM U1206, CREATIS, F-42023, Saint-Etienne, France, 5Department of Radiology, University Hospital Saint-Etienne, Saint-Etienne, France, 6Medical Scientist Training Program, University of California - San Diego, La Jolla, CA, United States, 7Department of Mechanical and Aerospace Engineering, University of Central Florida, Orlando, FL, United States
Synopsis
Despite the importance of myofiber strain (Eff) to overall heart function, it has remained very difficult to measure Eff in vivo owing to the challenges of measuring both microstructural and functional cardiac data. We propose a new method that integrates cDTI and a volume of short- and long-axis DENSE slices with 2D displacement encoding to enable the measurement of in vivo Eff in humans. The accuracy of the approach for measuring Eff was evaluated in silico. Finally, in vivo Eff values were measured and reported for thirty (N=30) healthy volunteers for which an average Eff=-0.14 was found.
Introduction
Cardiac function arises from the complex deformation of billions of cardiac muscle cells (cardiomyocytes) during the cardiac cycle1. Aggregated cardiomyocytes form so-called “myofibers” that change orientation from epicardium to endocardium, as usually described by an helix angle (HA)2. This unique microstructural architecture transforms uniaxial myofiber shortening into the circumferential, longitudinal, and radial deformation of the left ventricle (LV). Despite the mechanistic importance of myofiber strain (Eff) to heart function, it has remained very difficult to measure in vivo owing to the challenges of acquiring and integrating both functional motion and microstructural cardiac data, which has only been reported in a few pre-clinical studies3-6.Cardiac motion can be measured using the DENSE7,8 approach, which provides spatiotemporally resolved maps of myocardial tissue displacement. However, since myofiber orientation data is typically not available, cardiac strains are usually computed assuming a geometry dependent cylindrical coordinate system along the longitudinal (Ell), circumferential (Ecc), and radial (Err) directions of the LV. These descriptive metrics are not mechanistically linked to cardiac contraction – except in the LV midwall where it is assumed that Ecc accords with Eff owing to the presumed circumferential orientation of midwall myofibers.
Cardiac Diffusion Tensor imaging (cDTI) is the only approach able to provide a direct measure of myofiber orientation in vivo9. Recently, the development of first and second-order motion-compensated gradient waveform designs have enabled cDTI in vivo despite the inherent respiratory and cardiac bulk motion 10-12. This approach has been used to characterize the in vivo microstructural remodeling in several cardiomyopathies13-15.
In this work, we propose a new method that combines cDTI and a volume of short- and long-axis DENSE slices with 2D displacement encoding to enable the rapid measurement of in vivo myofiber strain (Eff) in humans. The accuracy of the approach for measuring Eff was evaluated using a computational phantom for a range of myofiber orientations. Finally, in vivo Eff values were measured and reported for thirty (N=30) healthy volunteers.
Methods
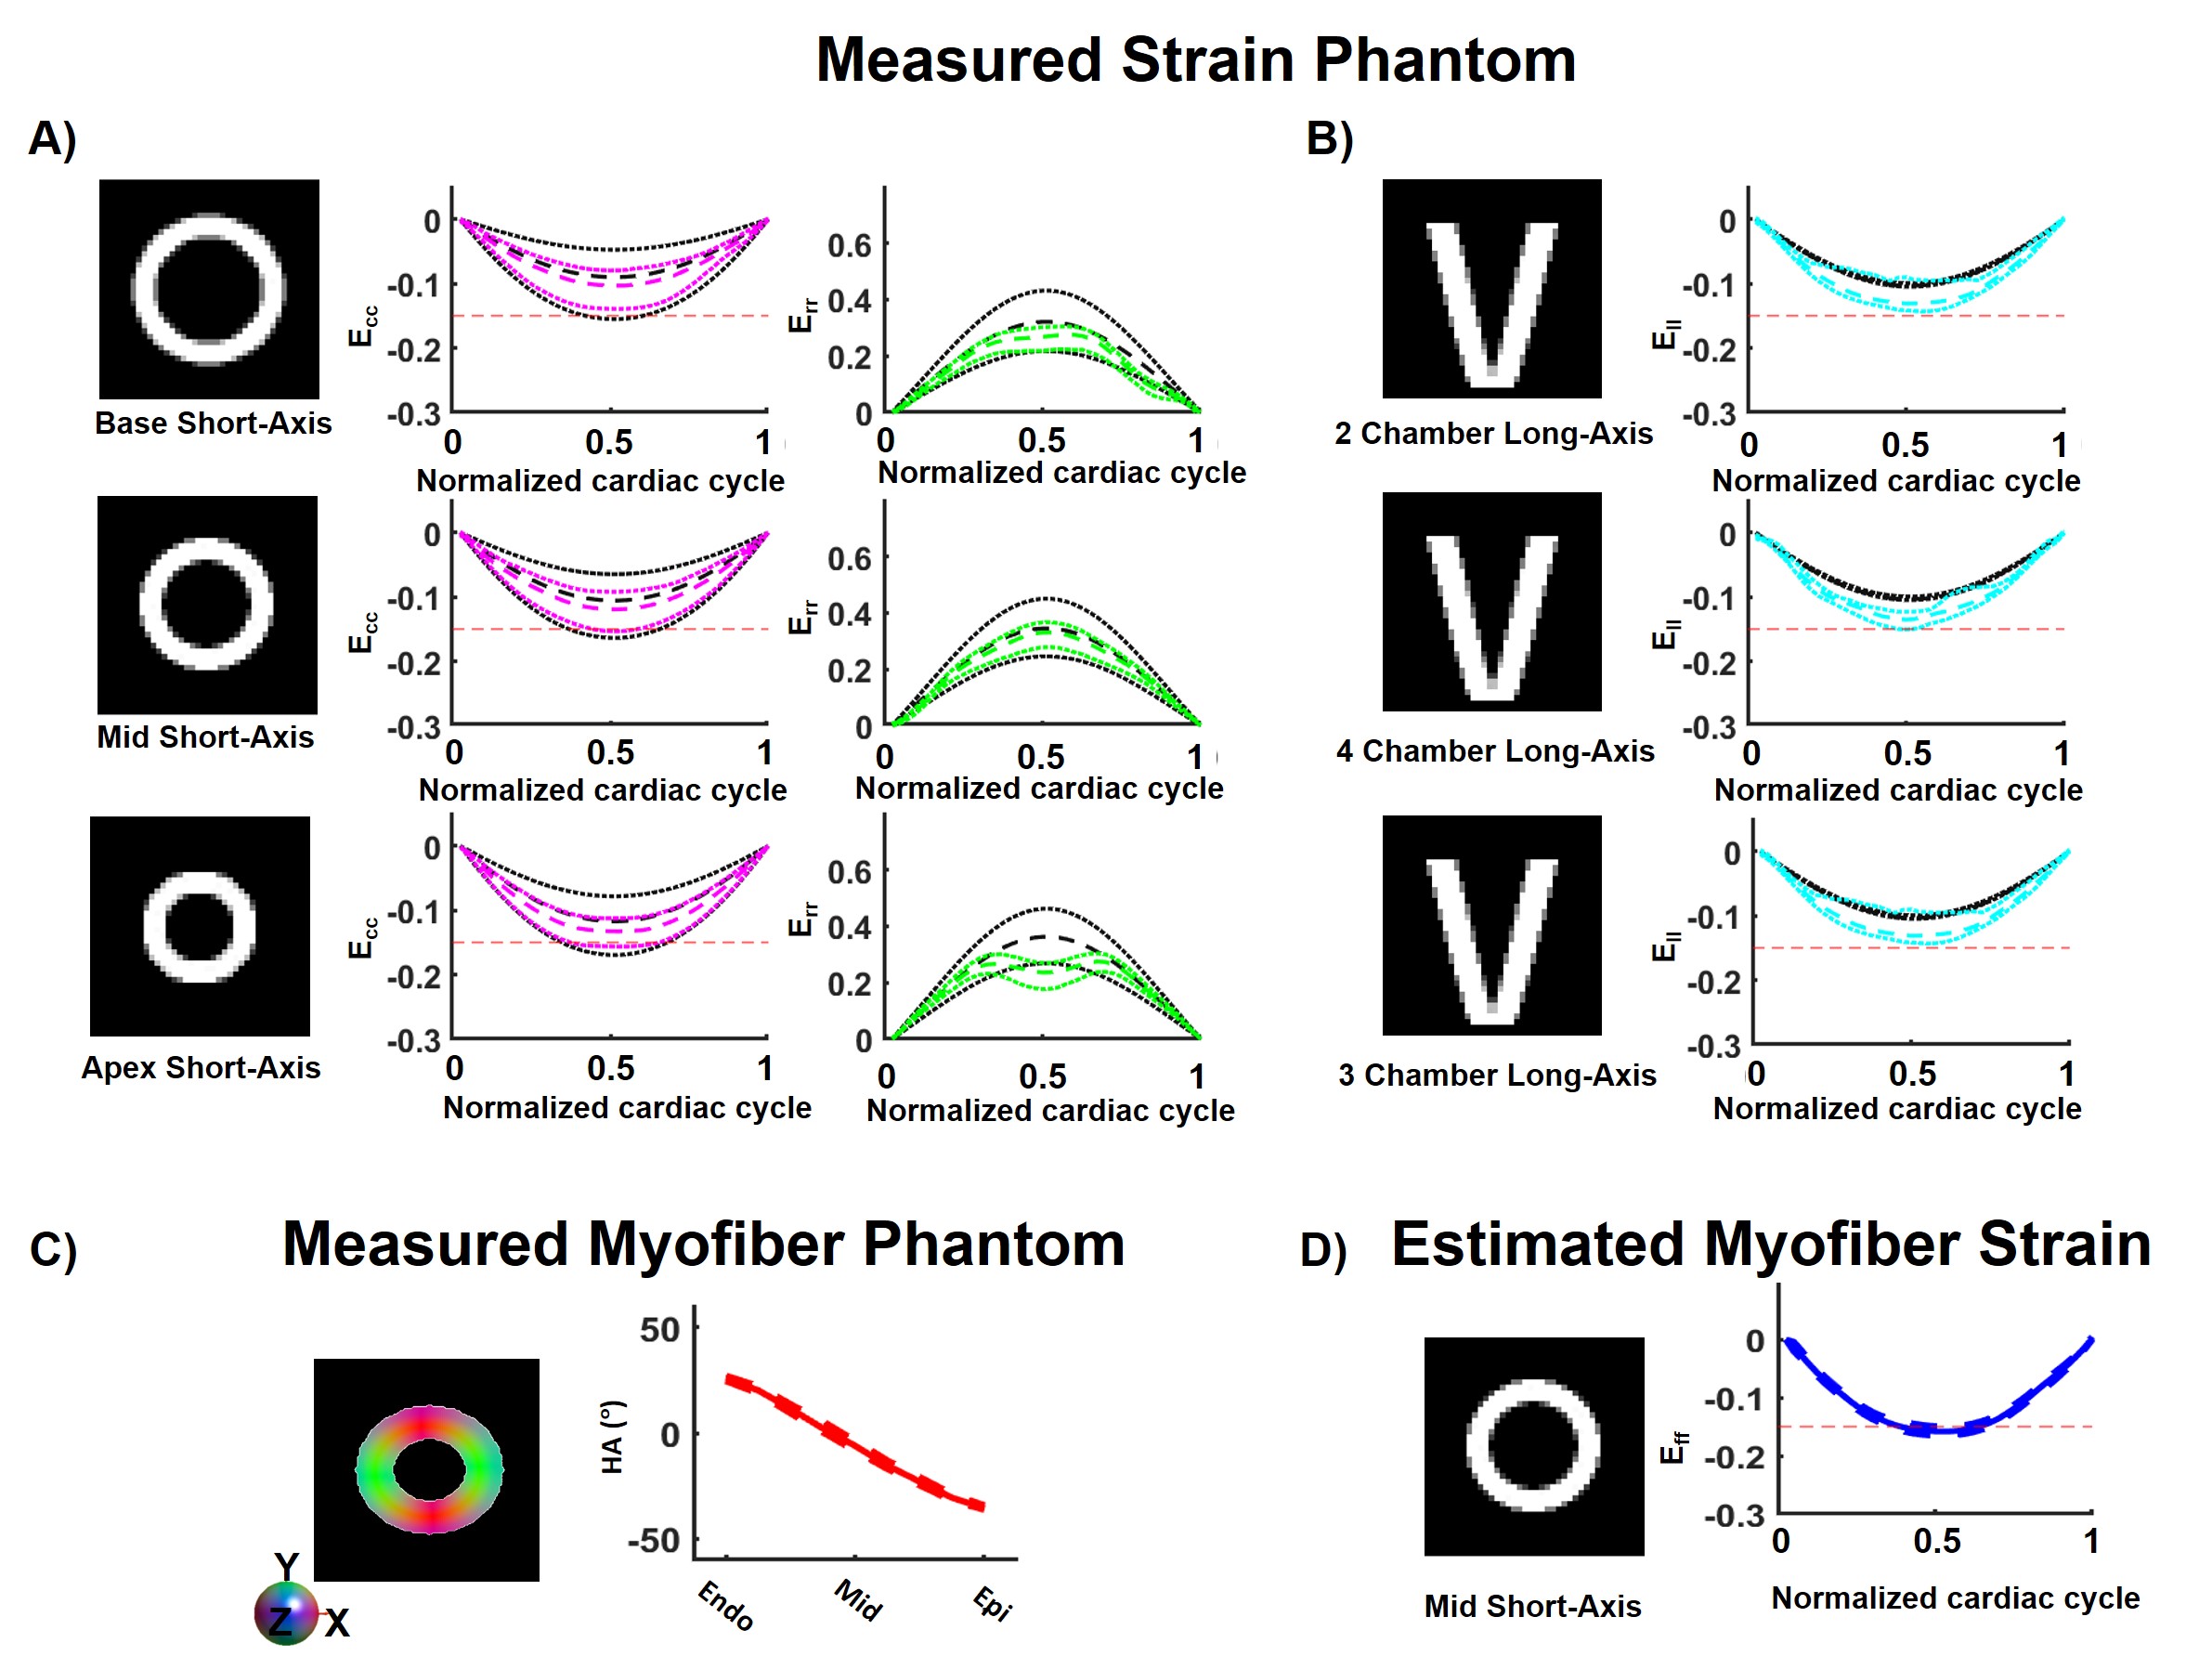
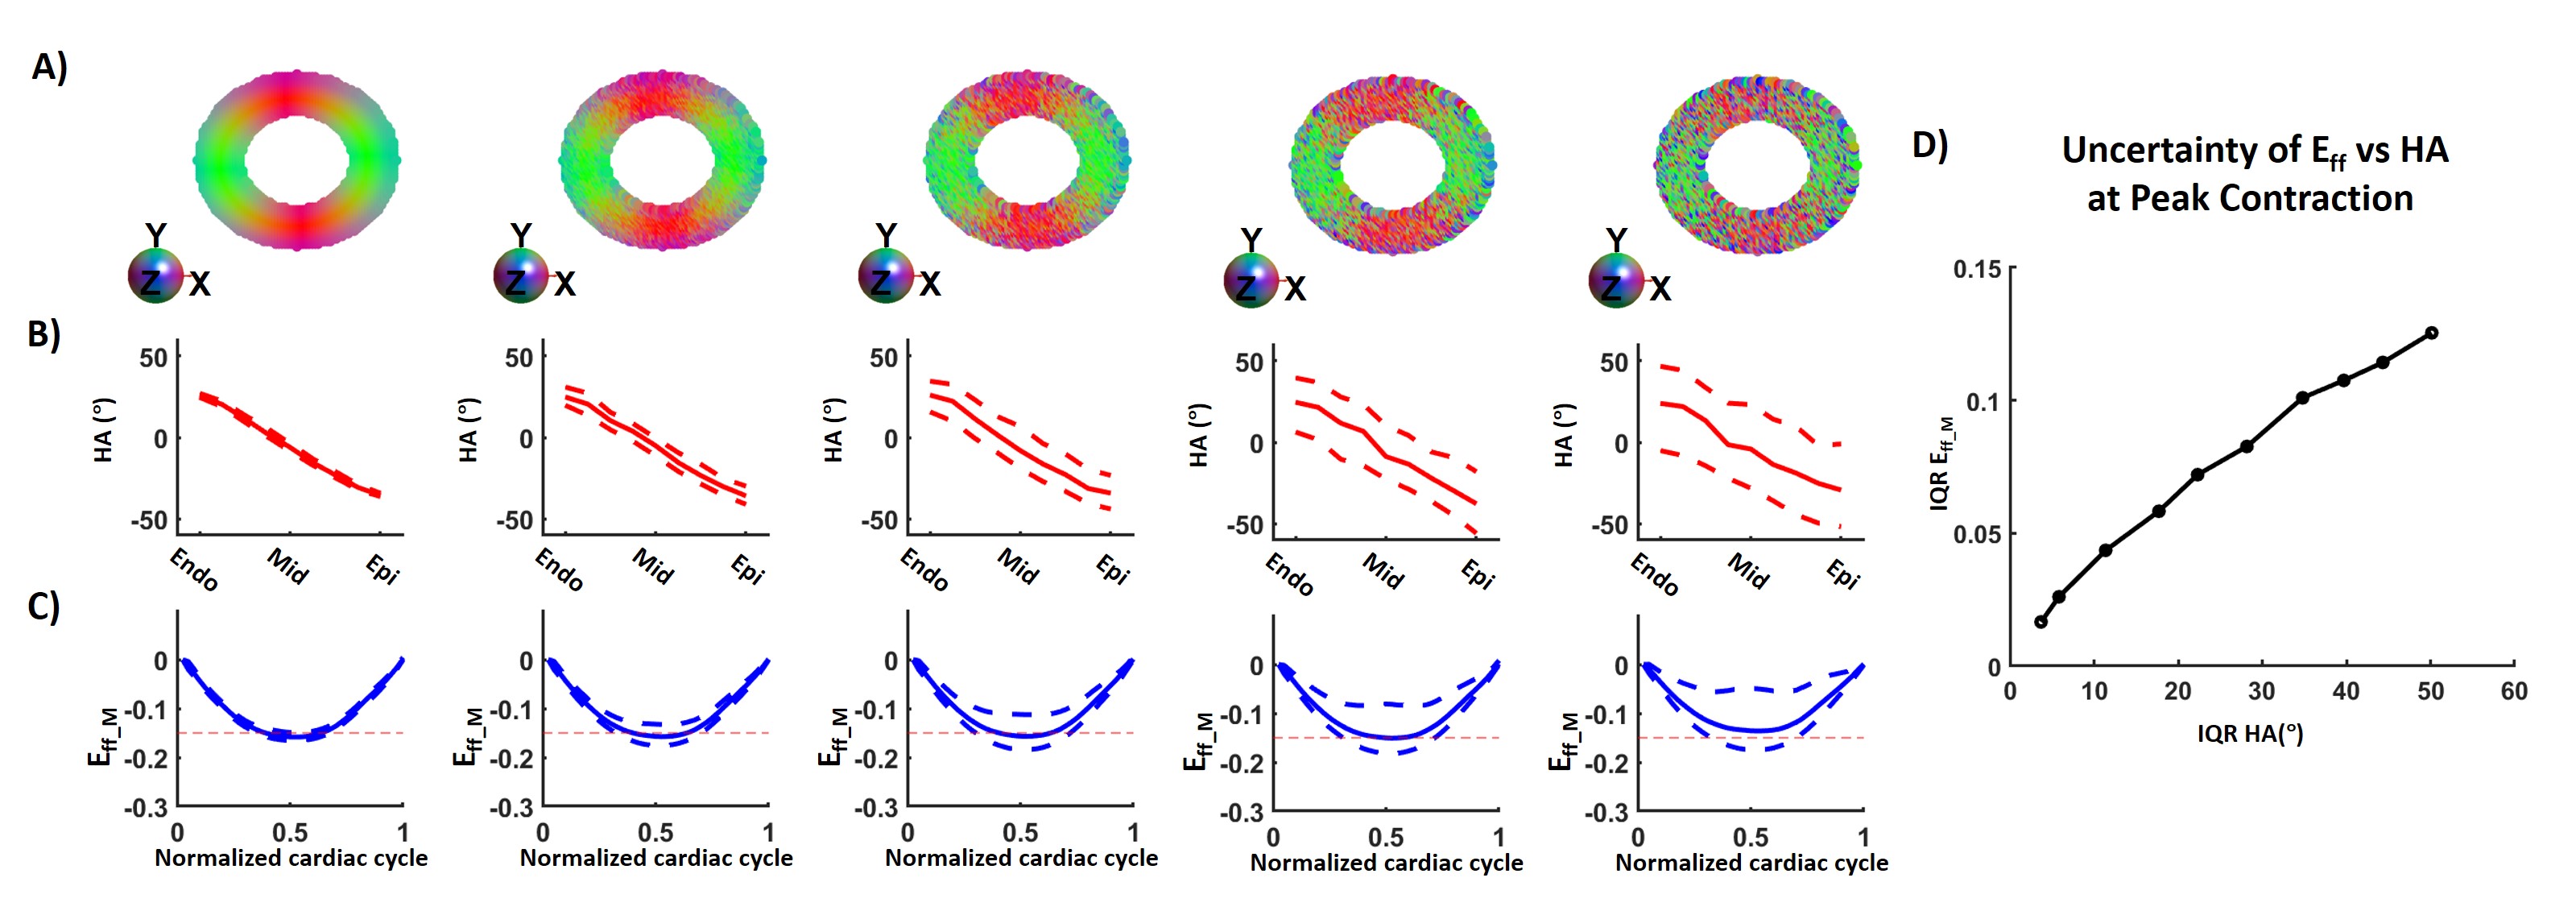
In this work, myofiber strain (Eff) was estimated by retrospective combination of cDTI and DENSE images. Eff estimation (Animated Fig. 1) consisted of three steps: 1) 3D displacements were estimated by combining LA and SA 2D DENSE data; 2) The 3D displacement field was applied to the cDTI data to compute the myofiber orientation through the cardiac cycle; and 3) Eff was calculated at each cardiac phase (beginning of systole was the reference configuration).An in silico experiment was designed to validate the accuracy of the proposed cDTI and DENSE pipeline to estimate Eff. A computational deforming LV phantom was used to produce a cardiac-like displacement field given strain targets on Ell (-0.15), Ecc (-0.20 in endo, -0.16 in epi), Err (0.45 in endo, 0.30 in epi), and Eff (-0.15) strains. The phantom includes a quadratic transmural distribution of myofiber HA (37° in endo, -9° in mid-wall, -45° in epi)16. Finally, perturbation was added to the HA to study the variability of Eff as a function of the myofiber orientation.
Healthy volunteers (N=30) were imaged (3T Prisma, Siemens) following IRB approval and informed consent. Six cine DENSE slices were acquired in short axis (SA) and long axis (LA) views during breath holding using 2D displacement encoding (ke=0.1 cycle/mm, balanced 3-point encoding, TE=1ms, TR=15ms, 2.5x2.5x8mm3). The cDTI acquisitions were performed at peak systole (~275ms) in a single mid-SA using a second order motion compensated high-resolution spin-echo EPI cardiac sequence (TE=61ms, TR=4000ms, 1.6x1.6x8mm3, end-respiratory triggering, b-values 0-350s/mm², 6 directions, 10 averages). The acquisition time for all data was ~10 min in total.
Differences between median Ecc and Eff across volunteers were evaluated using a Wilcoxon rank test (p<0.05).
Results
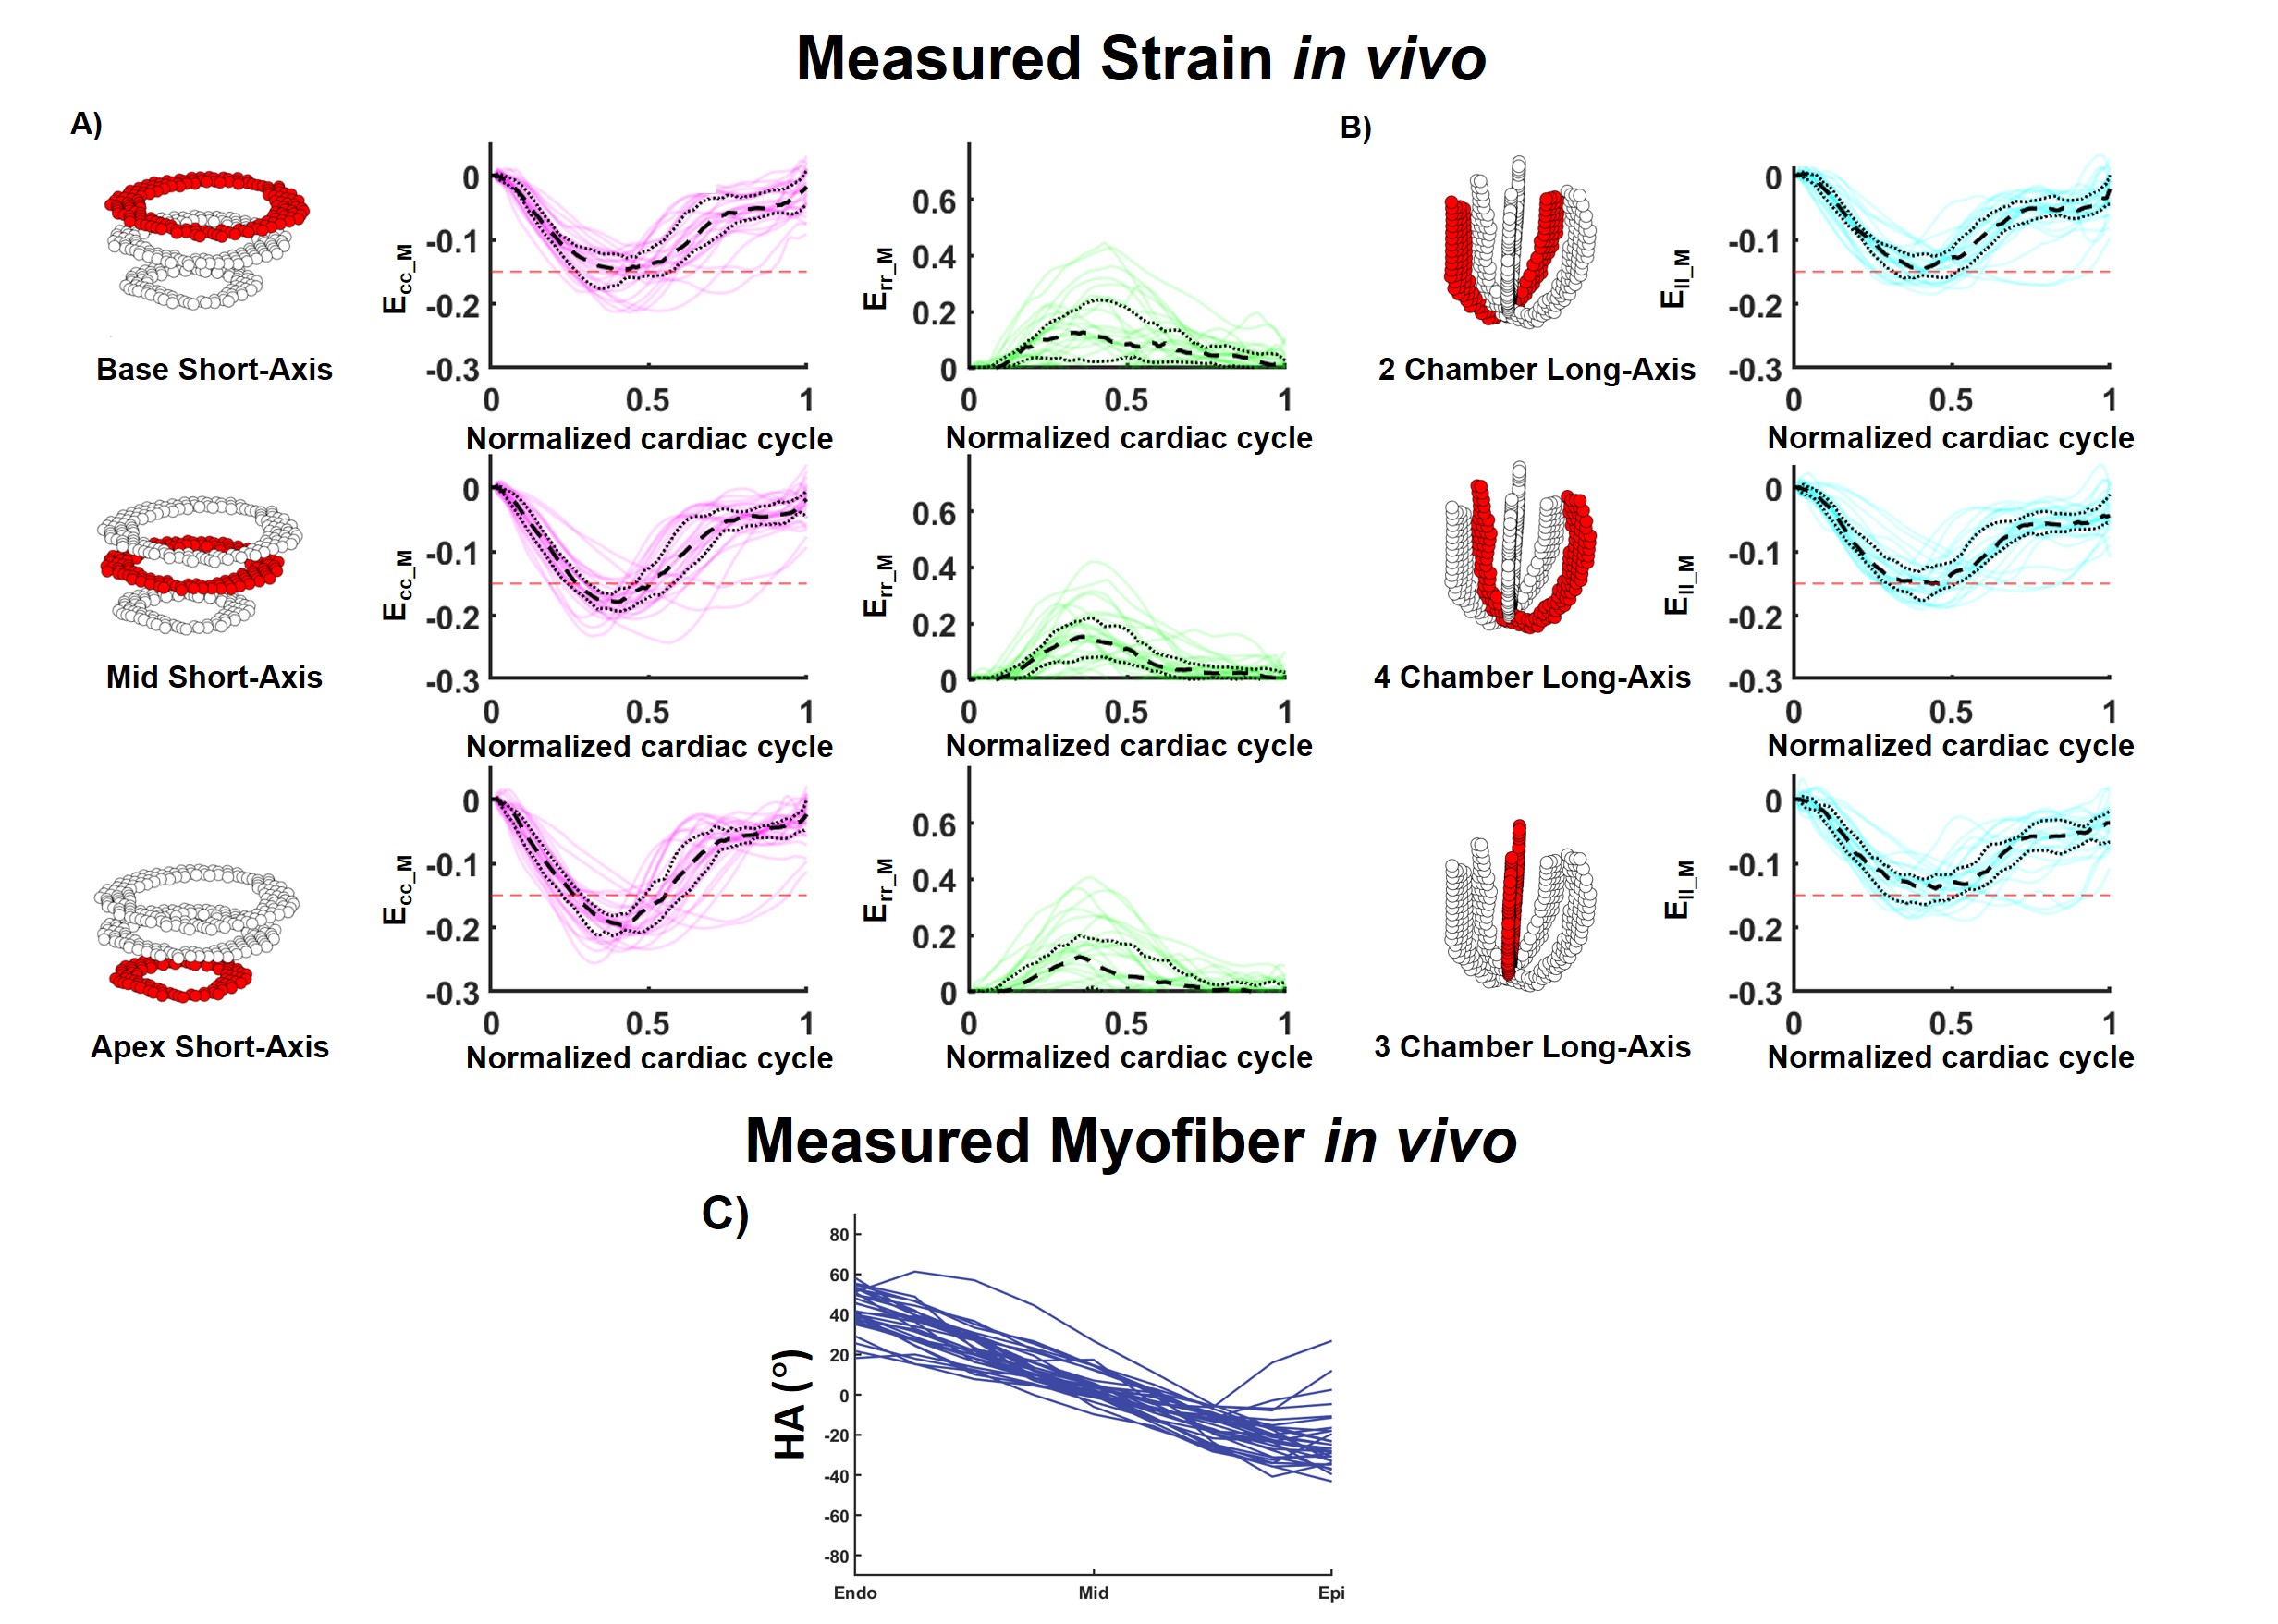
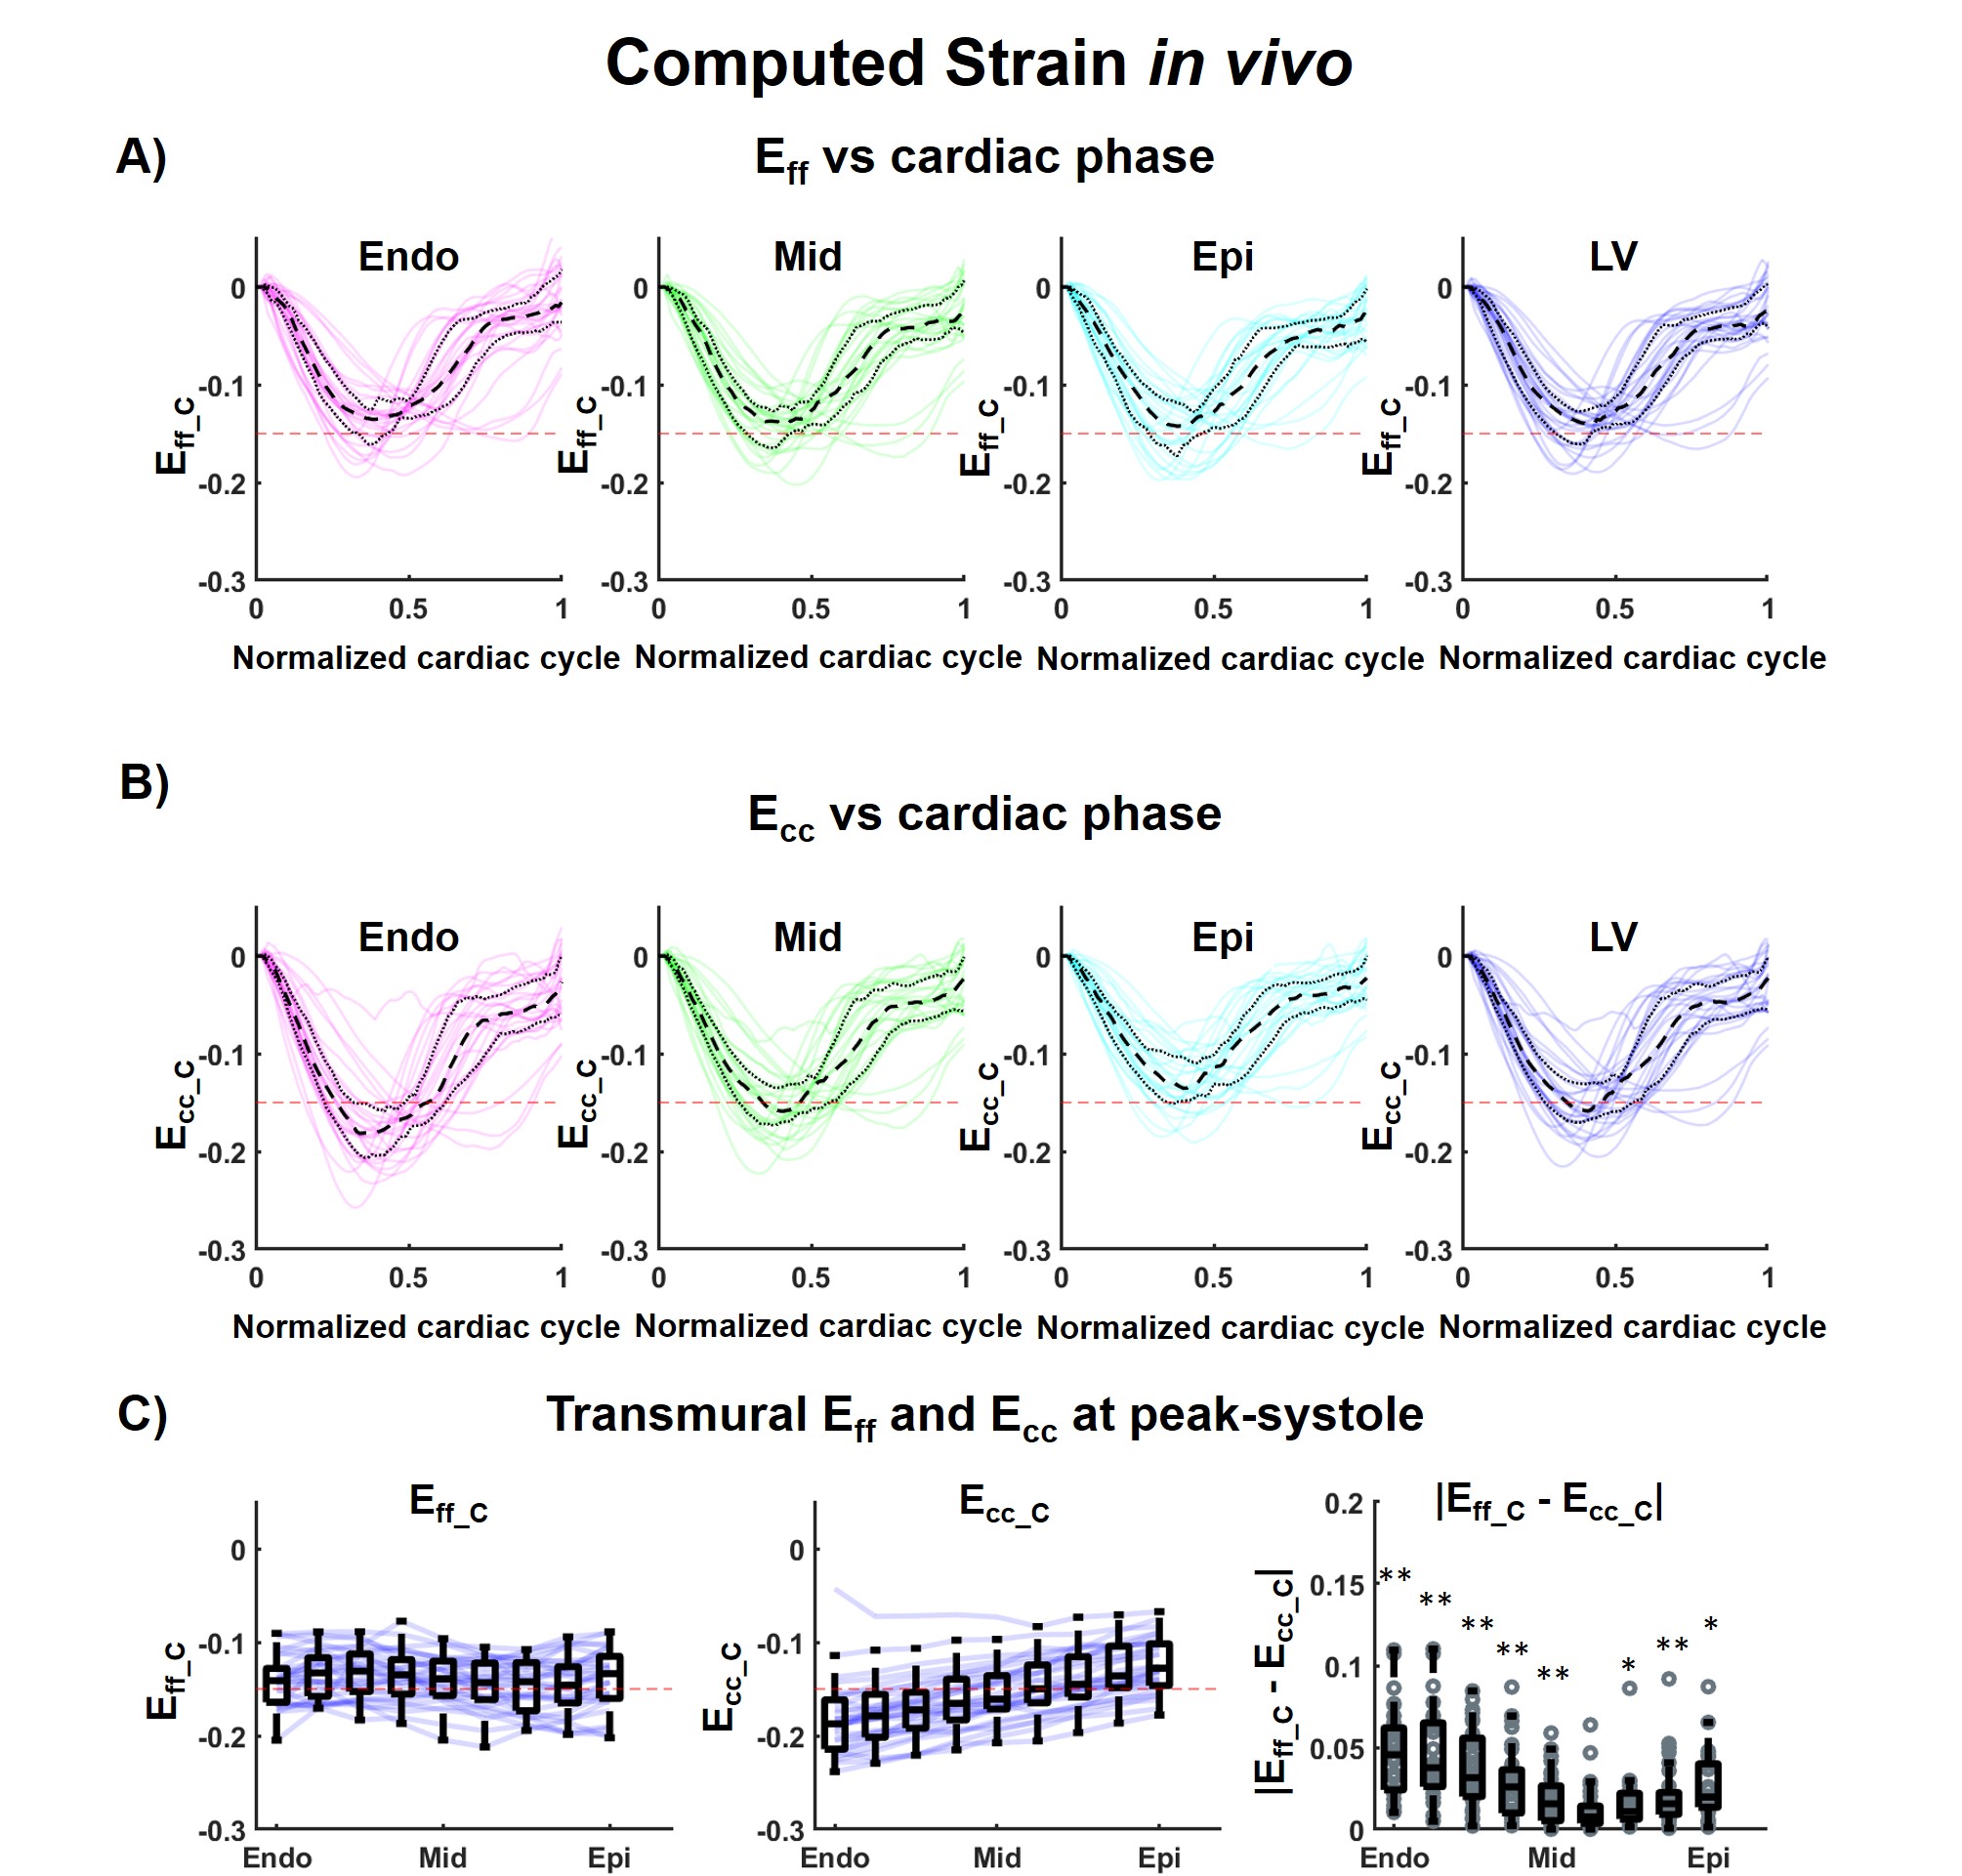
For the computational phantom, strains values from synthetic DENSE images and transmural HA from synthetic cDTI images are given in Figure 2-A-C. After combining cDTI and DENSE images, Eff value was estimated to Eff=-0.14[-0.15;-0.13] at peak systole. Variability was then added to the myofiber orientation maps which resulted in an increase of the interquartile range (IQR) for the transmural HA distribution (Figure 3). Small variations of HA corresponded to tight range of Eff at peak systole. As the variance of the HA increased (HA=19.6[-3.4;38.2]°, -29.2[-48.6;-8.15]° at endo and epi), so did the spread of Eff with a positive bias (Eff=-0.14[-0.18;-0.06]).Cardiac strains by DENSE acquisitions and transmural HA measured across the thirty volunteers are shown in Figure 4. A comparison Eff and Ecc is given in Figure 5. At peak systole, Eff was smaller in magnitude than Ecc in the endo-layer (Eff=-0.14[-0.15;-0.12] vs Ecc=-0.18[-0.20;-0.16], p<0.001) and in the mid-layer (Eff=-0.14[-0.16;-0.12] vs Ecc=-0.16[-0.17;-0.13], p<0.001) and equivalent in the epi-layer (Eff=-0.14[-0.16;-0.12] vs Ecc=-0.14[-0.15;-0.11], p=0.002). Transmurally, Eff is uniform while a transmural gradient is evident for Ecc and statistical differences were found in the epi- and endo-layers (Figure 5-C).
Discussions and Conclusion
In this study, we computed in vivo myofiber strains (Eff) in humans for the first time using DENSE and cDTI all within an ~10min scan. Eff was seen to be more spatially uniform suggesting uniform cardiomyocyte shortening in healthy adults and less geometry and layer dependence. Eff is a more mechanistic biomarker candidate to study cardiac function in health and disease.Acknowledgements
This work was supported by NIH/NHLBI R01-HL131975, R01-HL131823, K25-HL135408 grants and AHA post-doctoral fellowship AHA-20POST35210644. This work was supported by the HCL Actions Incitatives (69HCL15_744), and performed within the framework of the RHU MARVELOUS (ANR-16-RHUS-0009) of l’Université Claude Bernard Lyon 1 (UCBL), within the program "Investissements d'Avenir“ operated by the French National Research Agency (ANR).
The authors thank SIEMENS healthineers for their technical support and Dr. Epstein (University of Virginia) for providing the DENSE sequence used in this study.
References
1. Axel L et al. J. Cardiovasc. Magn. Reson. 2014;16 doi: 10.1186/s12968-014-0089-6.
2. Streeter et al. Circ. Res. 1969;24:339–347 doi: 10.1161/01.RES.24.3.339.
3. Tseng et al. Radiology 2000. Doi: 10.1148/radiology.216.1.r00jn39128.
4. Wang et al. IEEE Trans. Med. Imaging 2016. Doi: 10.1109/TMI.2016.2580573.
5. Perotti et al. Functional Imaging and Modelling of the Heart. Springer International Publishing; 2017. pp. 381–391.
6. Verzhbinsky et al. IEEE Trans. Med. Imaging 2019. Doi: In Press.
7. Aletras et al. J. Magn. Reson. 1999. Doi: 10.1006/jmre.1998.1676.
8. Zhong et al. Magn. Reson. Med. 2010. Doi: 10.1002/mrm.22503.
9. Lombaert et al. IEEE Trans. Med. Imaging 2012. Doi: 10.1109/TMI.2012.2192743.
10. Welsh et al. IEEE Trans. Med. Imaging 2015. Doi: 10.1109/TMI.2015.2411571.
11. Stoeck et al. MRM 2016. Doi:10.1002/mrm.25784
12. Aliotta et al. Magn. Reson. Med. 2017. Doi: 10.1002/mrm.26166.
13. Nielles-Vallespin et al. J. Am. Coll. Cardiol. 2017. Doi: 10.1016/j.jacc.2016.11.051.
14. Ferreira et al. J. Cardiovasc. Magn. Reson. 2014. Doi: 10.1186/s12968-014-0087-8.
15. Gotschy et al. J. Cardiovasc. Magn. Reson. 2019. Doi: 10.1186/s12968-019-0563-2.
16. Ennis et al. J. Biomech. 2008. Doi: 10.1016/j.jbiomech.2008.08.007.
Figures