0681
Extension of a Diagnostic Model for Pulmonary Hypertension with Hyperpolarized 129Xe Magnetic Resonance Imaging and Spectroscopy
Elianna Ada Bier1, Fawaz Alenezi2, Junlan Lu3, Joseph G Mammarappallil4, Bastiaan Driehuys4, and Sudarshan Rajagopal2
1Biomedical Engineering, Duke University, Durham, NC, United States, 2Division of Cardiology, Department of Medicine, Duke Univeristy, Durham, NC, United States, 3Medical Physics Graduate Program, Duke University, Durham, NC, United States, 4Radiology, Duke University, Durham, NC, United States
1Biomedical Engineering, Duke University, Durham, NC, United States, 2Division of Cardiology, Department of Medicine, Duke Univeristy, Durham, NC, United States, 3Medical Physics Graduate Program, Duke University, Durham, NC, United States, 4Radiology, Duke University, Durham, NC, United States
Synopsis
129Xe dynamic spectroscopy combined with 129Xe gas exchange MRI can detect both pre- and postcapillary pulmonary hypertension (PH). However, reliance on whole lung spectroscopy limits this technique’s ability to detect spatially heterogeneous impacts of PH. For example, the algorithm cannot identify combined pre- and postcapillary PH (CpcPH) and does not currently account for out-of-proportion PH in patients with parenchymal disease. Here we use the recently introduced method of imaging signal oscillations from 129Xe in red blood cells to gain additional insights into 26 subjects who have also undergone right heart catheterization to determine PH status within 2 months of imaging.
Purpose
The diagnosis of pulmonary hypertension (PH) requires right heart catheterization (RHC) where specific RHC hemodynamic criteria determine whether the PH is precapillary (PH-pre), postcapillary (PH-post) or combined pre- and postcapillary PH (CpcPH). However, this technique is invasive and can be difficult to interpret in patients with other cardiopulmonary disease that may cause PH. Non-invasive hyperpolarized 129Xe MR gas exchange imaging and spectroscopy provides unique patterns associated with various cardiopulmonary diseases [1]. We have previously used the dynamic cardiogenic variation of 129Xe signal in capillary red blood cells (RBCs) in a diagnostic algorithm to determine the presence of pre- vs postcapillary PH [2]. However, its reliance on whole lung spectroscopy limits the ability to detect spatially heterogeneous PH. For example, the algorithm is incapable of detecting combined CpcPH and does not currently speak to out-of-proportion PH in patients with parenchymal disease. We address this problem using the newly developed method to image the spatial variation in RBC signal oscillations [3]. Here, we demonstrate the utility of this method in subjects with complex cardiopulmonary disease.Methods
All subjects underwent 3D 129Xe gas exchange MRI[4] and dynamic spectroscopy (TR=15-20ms) [5]. Gas exchange images were transformed into quantitative maps depicting ventilation, barrier tissue uptake, and red blood cell (RBC) transfer [6]. Each compartment was binned with respect to a healthy distribution and quantified by its defect, low, and high percentage. The RBC images were further processed to create images of the RBC amplitude variation following the methodology of Niedbalski [3]. Additionally, dynamic spectroscopy provided the global cardiogenic RBC amplitude variation, while static analysis determined the RBC chemical shift.The basic diagnostic algorithm for determining pre- and postcapillary PH shown in Figure 1. 129Xe MRI/MRS from representative subjects in the training cohort (n=105) are shown in Figure 2. The 129Xe MRI/MRS and RBC oscillation maps were evaluated in a cohort of 26 patients who had also undergone right heart catheterization (RHC) the same day (n=16) or within 2 months (n=9).
RHC determines whether PH is present when mean pulmonary artery pressure mPAP≥20mmHg. PH is pre-capillary if pulmonary vascular resistance PVR≥3 Woods Units [7]. It is post-capillary if pulmonary capillary wedge pressure is PCWP>15mmHg. Those with PVR≥3 WU and PCWP>15mmHg are classified as combined pre- and postcapillary PH (CpcPH).
Results
In 26 test subjects, 5 had no PH (Figure 3), 12 had precapillary PH only (Figure 4), 3 had postcapillary PH only, 3 had CpcPH (Figure 5), and 3 had PH that was neither pre- nor postcapillary. This resulted in a baseline diagnostic accuracy of 0.7 for precapillary PH.Discussion
The basic diagnostic model performs well on subjects without obstructive or interstitial lung disease; most misclassifications occur in subjects with concomitant disease. To this end, RBC oscillation imaging provides a new means of characterizing the spatial heterogeneity of RBC amplitude oscillations. Figure 3 shows that non-PH subjects generally show normal RBC oscillations homogeneously distributed throughout the lung. However, the misclassified subject exhibits high RBC oscillations with a high barrier uptake, a pattern typically seen in subjects with interstitial lung disease (ILD). In this subject, regions of low RBC oscillation seemingly correlate regions of high barrier uptake, providing a window on the complexity of regional hemodynamics.In subjects with precapillary PH (Figure 4) most RBC oscillation images exhibit regions of low amplitude. The misclassified subjects all have concomitant pulmonary disease with high RBC defect percentages. In these subjects the analyzable regions of lung have extremely high RBC oscillations that likely bring the average global RBC amplitude oscillation higher than usually seen in pre-capillary PH. These regions may reflect a compensatory redistribution of blood flow to the most highly functioning lung.
Figure 5 shows gas exchange MRI/MRS and RBC oscillation imaging for 2 CpcPH subjects. This condition cannot be determined by the basic diagnostic model because the RBC amplitude thresholds for pre- and postcapillary PH are mutually exclusive. Here, RBC oscillation imaging appears to identify separate regions of lung with pre- and postcapillary disease.
The spatial information introduced by 129Xe RBC amplitude oscillation imaging has the potential to address limitations in the previously proposed diagnostic model and greatly improve diagnostic accuracy.
Acknowledgements
2R01HL105643-06, R01HL126771, R01HL126771, GenentechReferences
- Wang, Z., et al., Diverse cardiopulmonary diseases are associated with distinct xenon magnetic resonance imaging signatures. European Respiratory Journal, 2019. 54(6).
- Bier, E.A., et al. Noninvasive diagnosis of pulmonary hypertension with hyperpolarized 129Xe magnetic resonance imaging and spectroscopy. In ISMRM 28th Annual Meeting. 2020.
- Niedbalski, P.J., et al., Mapping cardiopulmonary dynamics within the microvasculature of the lungs using dissolved 129Xe MRI. Journal of Applied Physiology, 2020. 129(2): p. 218-229.
- Kaushik, S.S., et al., Single-breath clinical imaging of hyperpolarized 129xe in the airspaces, barrier, and red blood cells using an interleaved 3D radial 1-point Dixon acquisition. Magnetic Resonance in Medicine, 2016. 75(4): p. 1434-1443.
- Bier, E.A., et al., A protocol for quantifying cardiogenic oscillations in dynamic 129Xe gas exchange spectroscopy: The effects of idiopathic pulmonary fibrosis. NMR in Biomedicine, 2019. 32(1): p. e4029.
- Wang, Z., et al., Quantitative Analysis of Hyperpolarized 129Xe Gas Transfer MRI. Medical Physics, 2017.
- Simonneau, G., et al., Updated clinical classification of pulmonary hypertension. Journal of the American College of Cardiology, 2013. 62(25 Supplement): p. D34-D41.
Figures
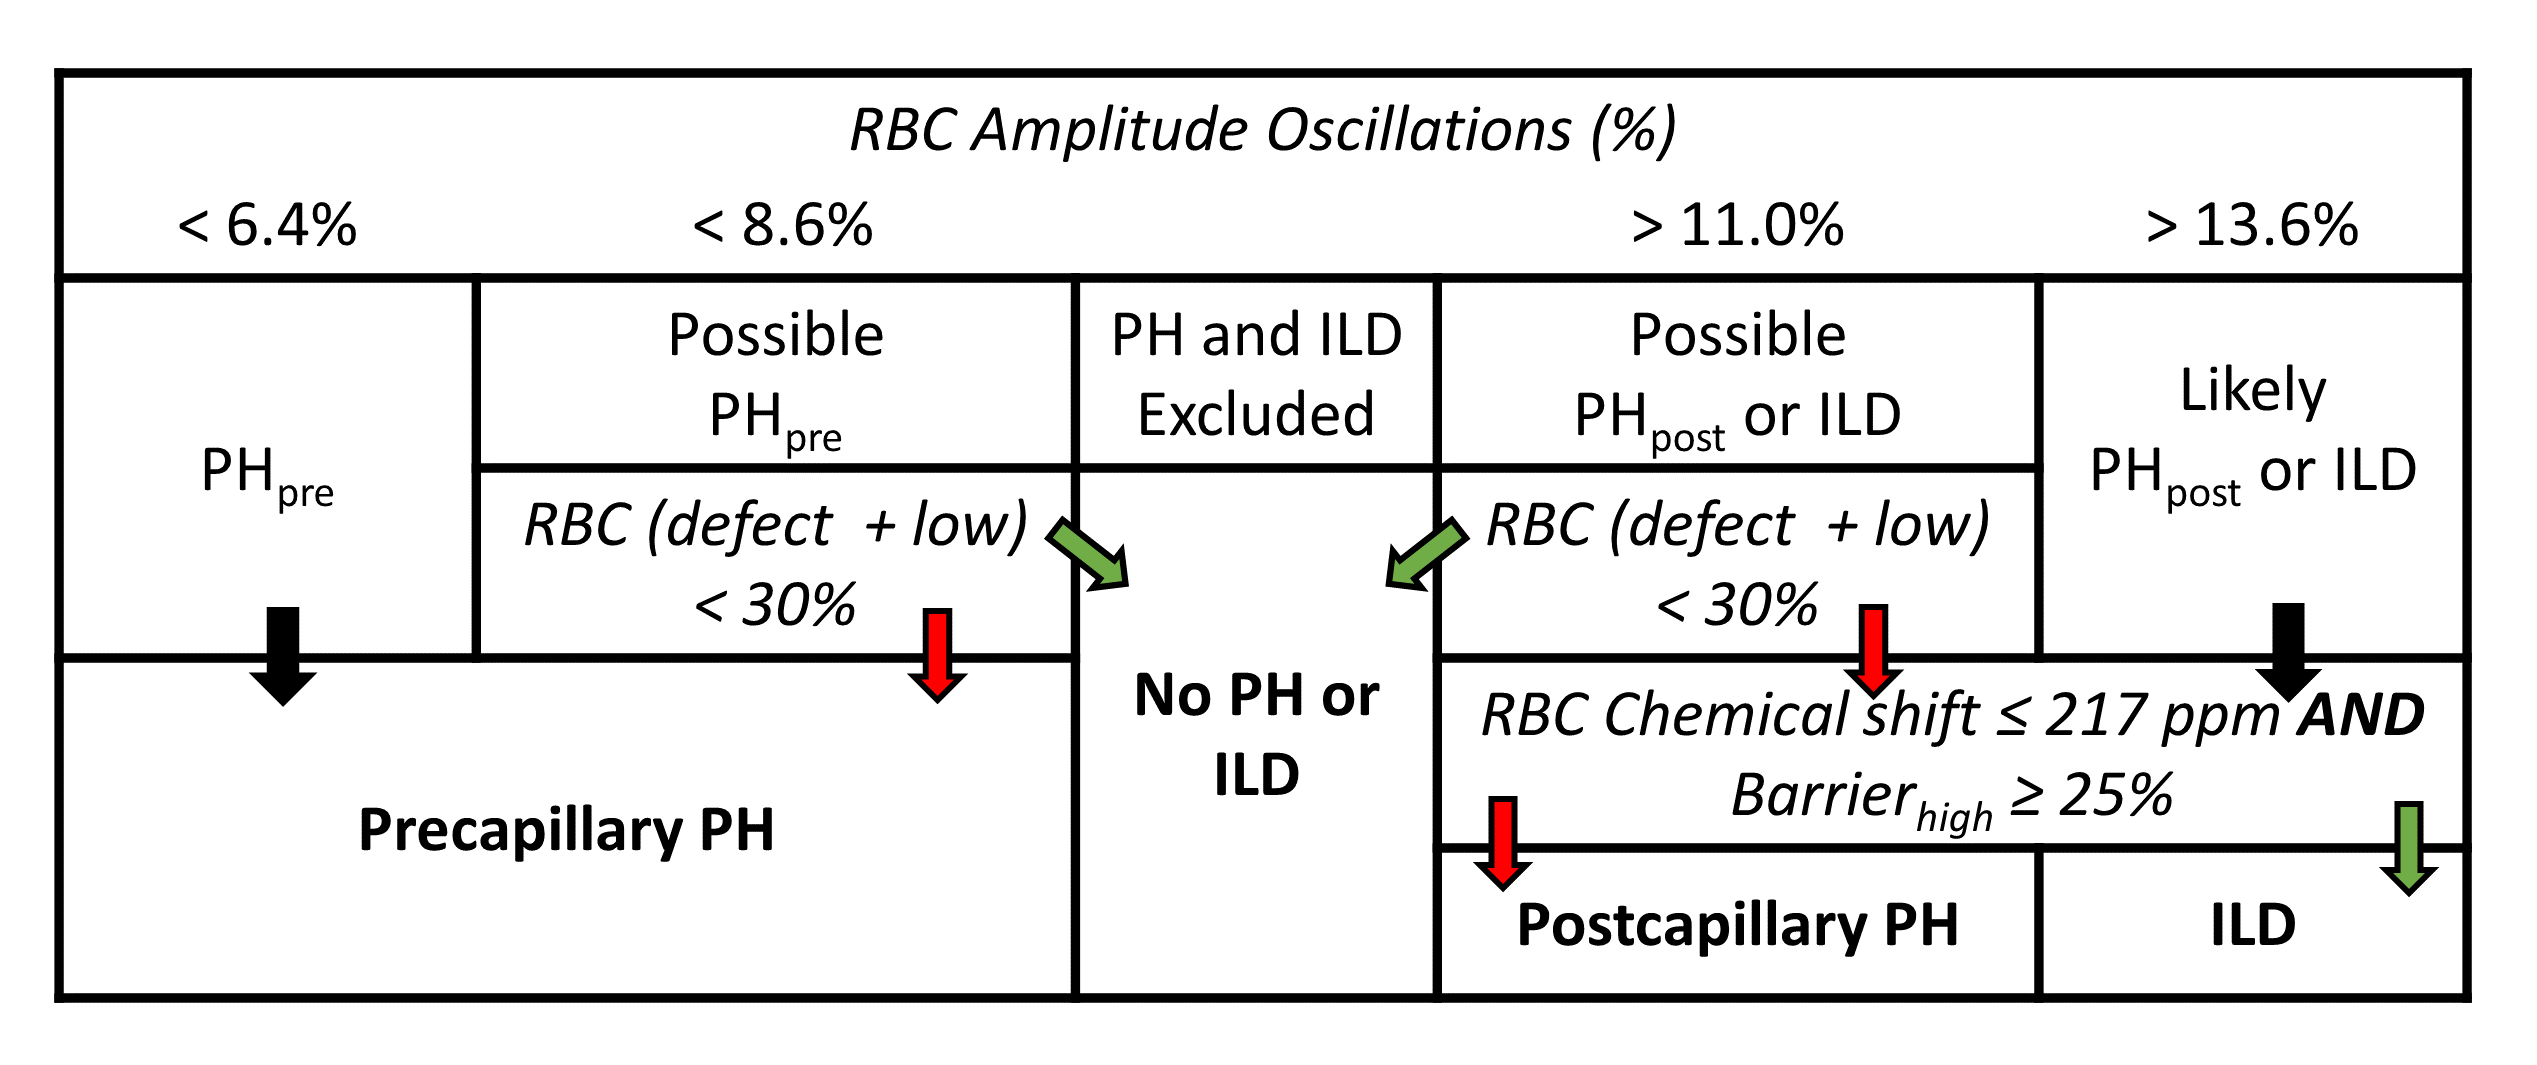
Figure 1. Baseline diagnostic
algorithm for determining pre- vs post-capillary PH based on 129Xe
RBC oscillation amplitudes and RBC transfer images. Black arrows mean continue,
green arrows indicate “yes” for the proposed condition, and red arrows indicate
“no”. However, the model cannot define combined pre- and post-capillary PH (CpcPH),
nor is it able to determine pre-capillary PH in patients with ILD.
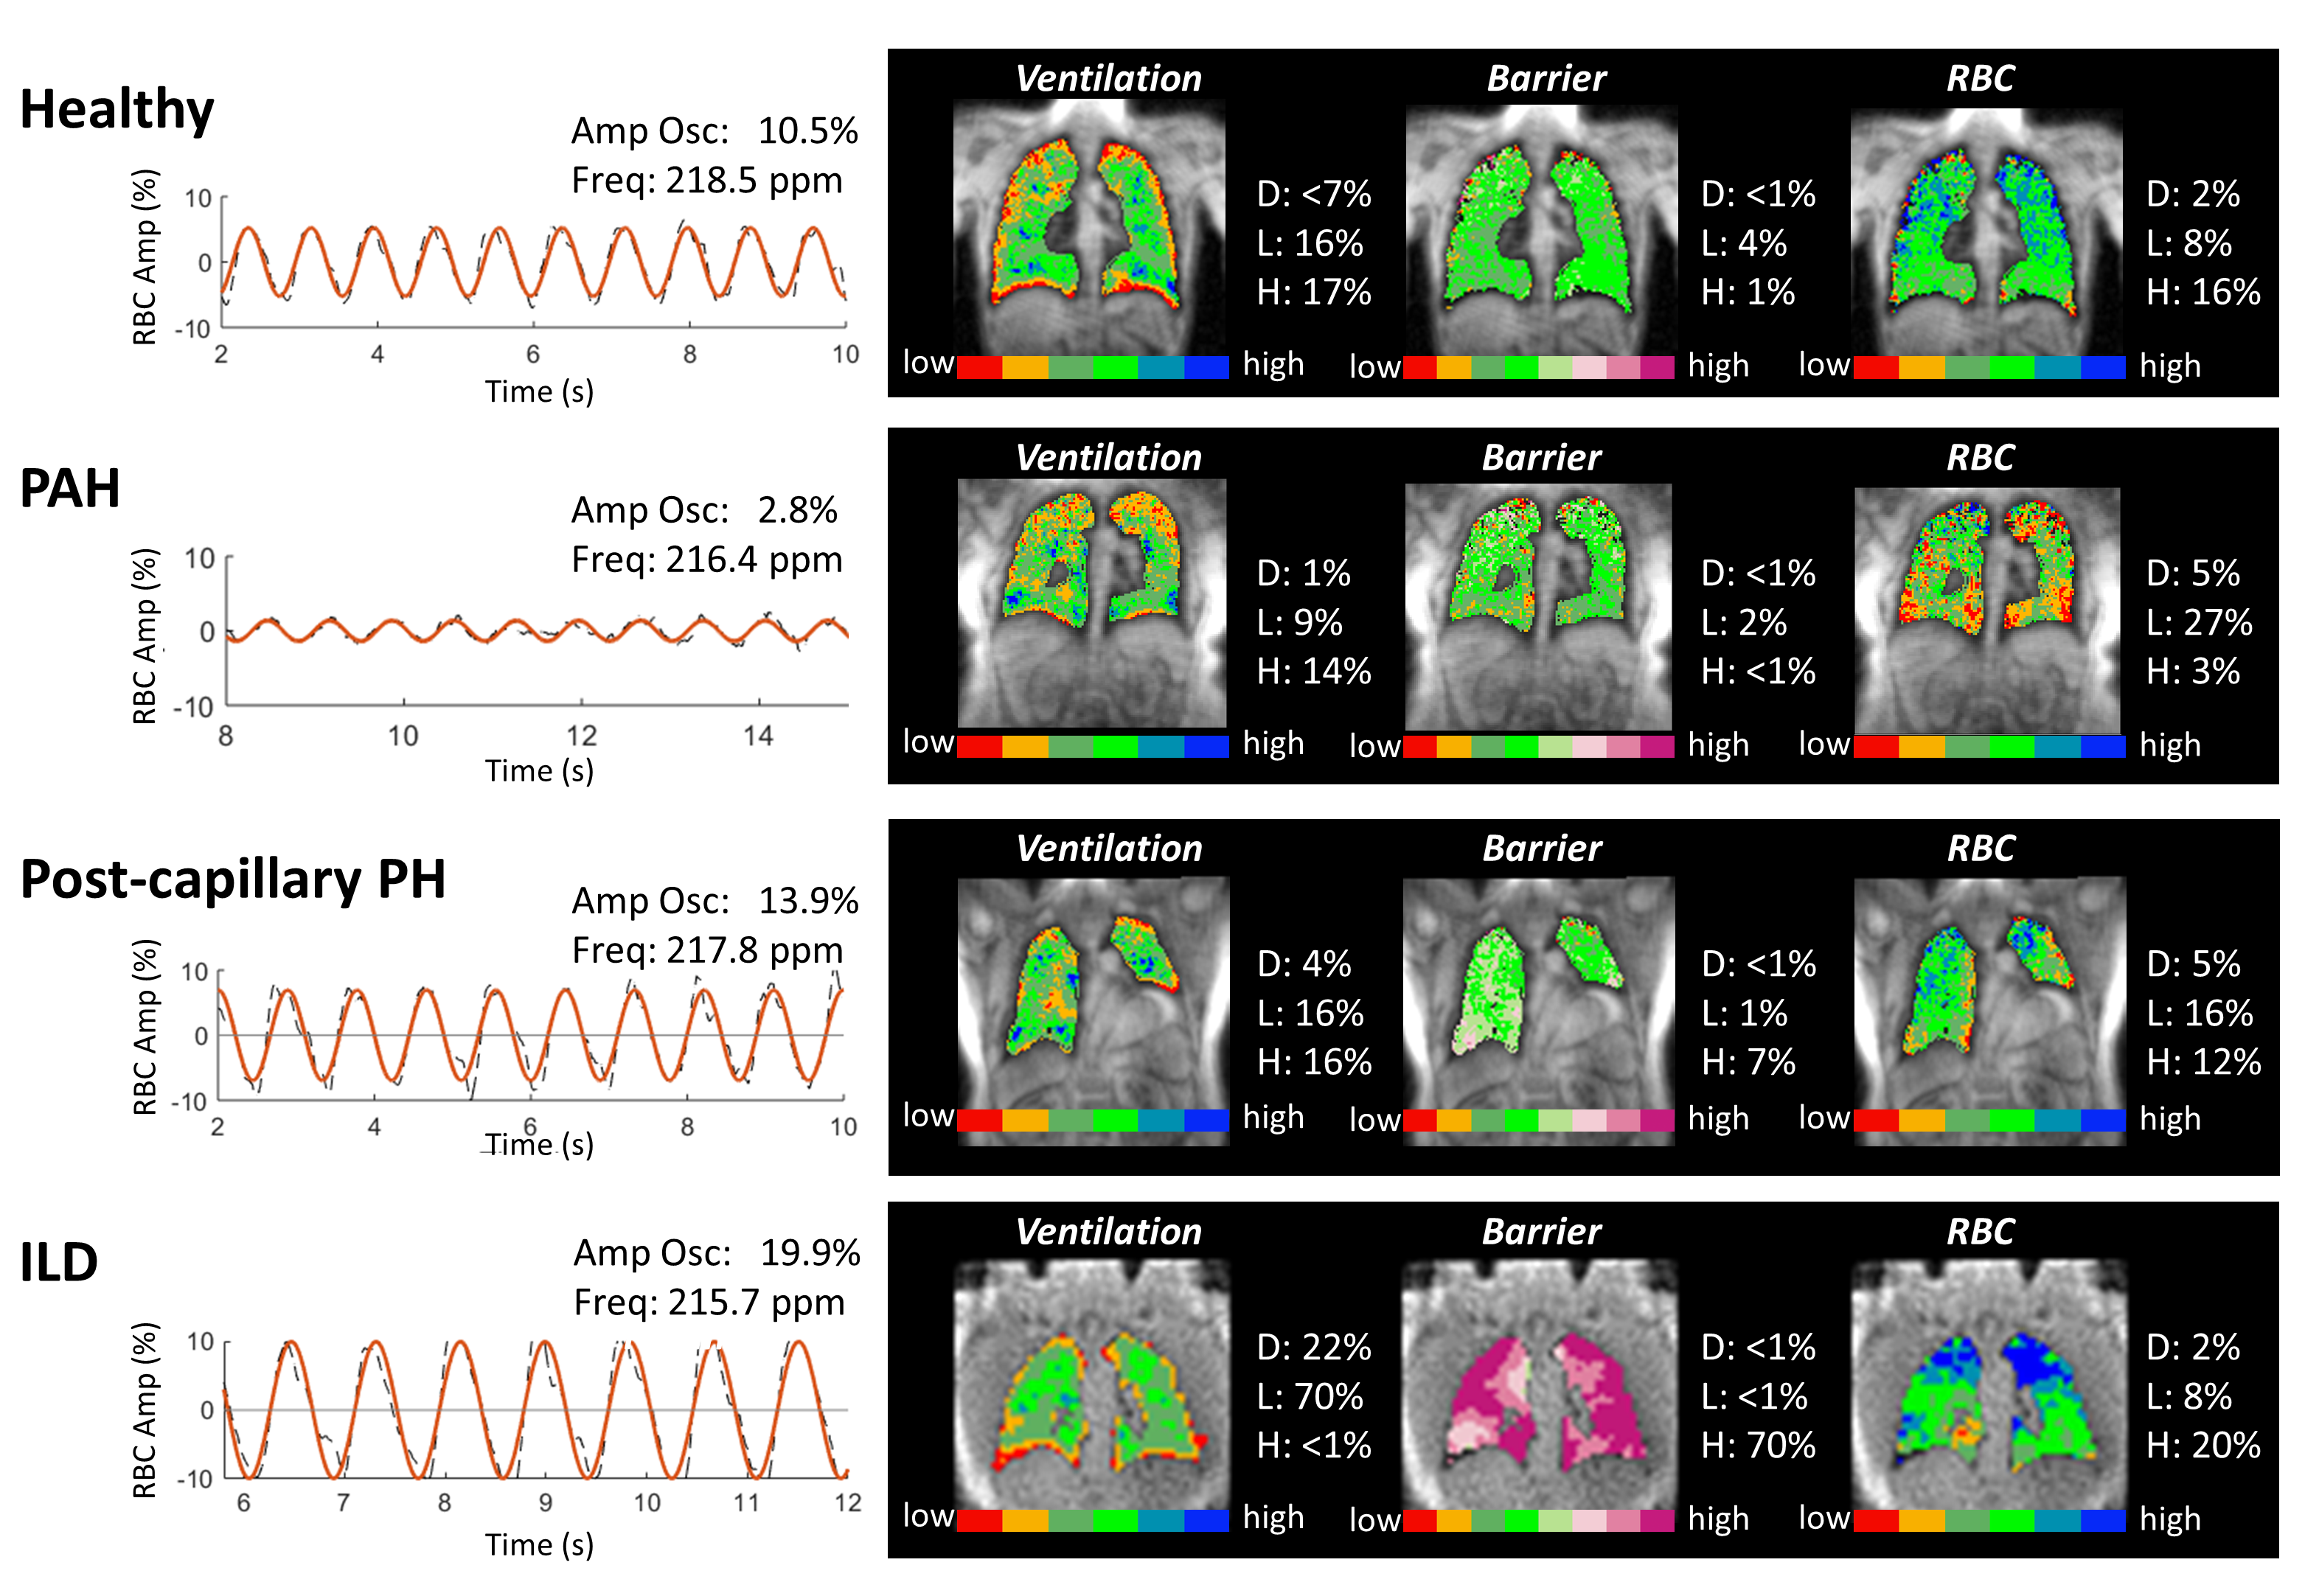
Figure 2. 129Xe dynamic spectroscopy and imaging
findings for representative subjects used to create the diagnostic model. The
algorithm first considers the RBC amplitude oscillation to predict PH status
and if it is pre- or postcapillary. If a subject is classified as possible PH,
the RBC component of the gas exchange imaging is used to confirm the presence
of PH if there is reduced RBC transfer (RBC defect + low > 30%); otherwise,
the subject is classified as no PH.
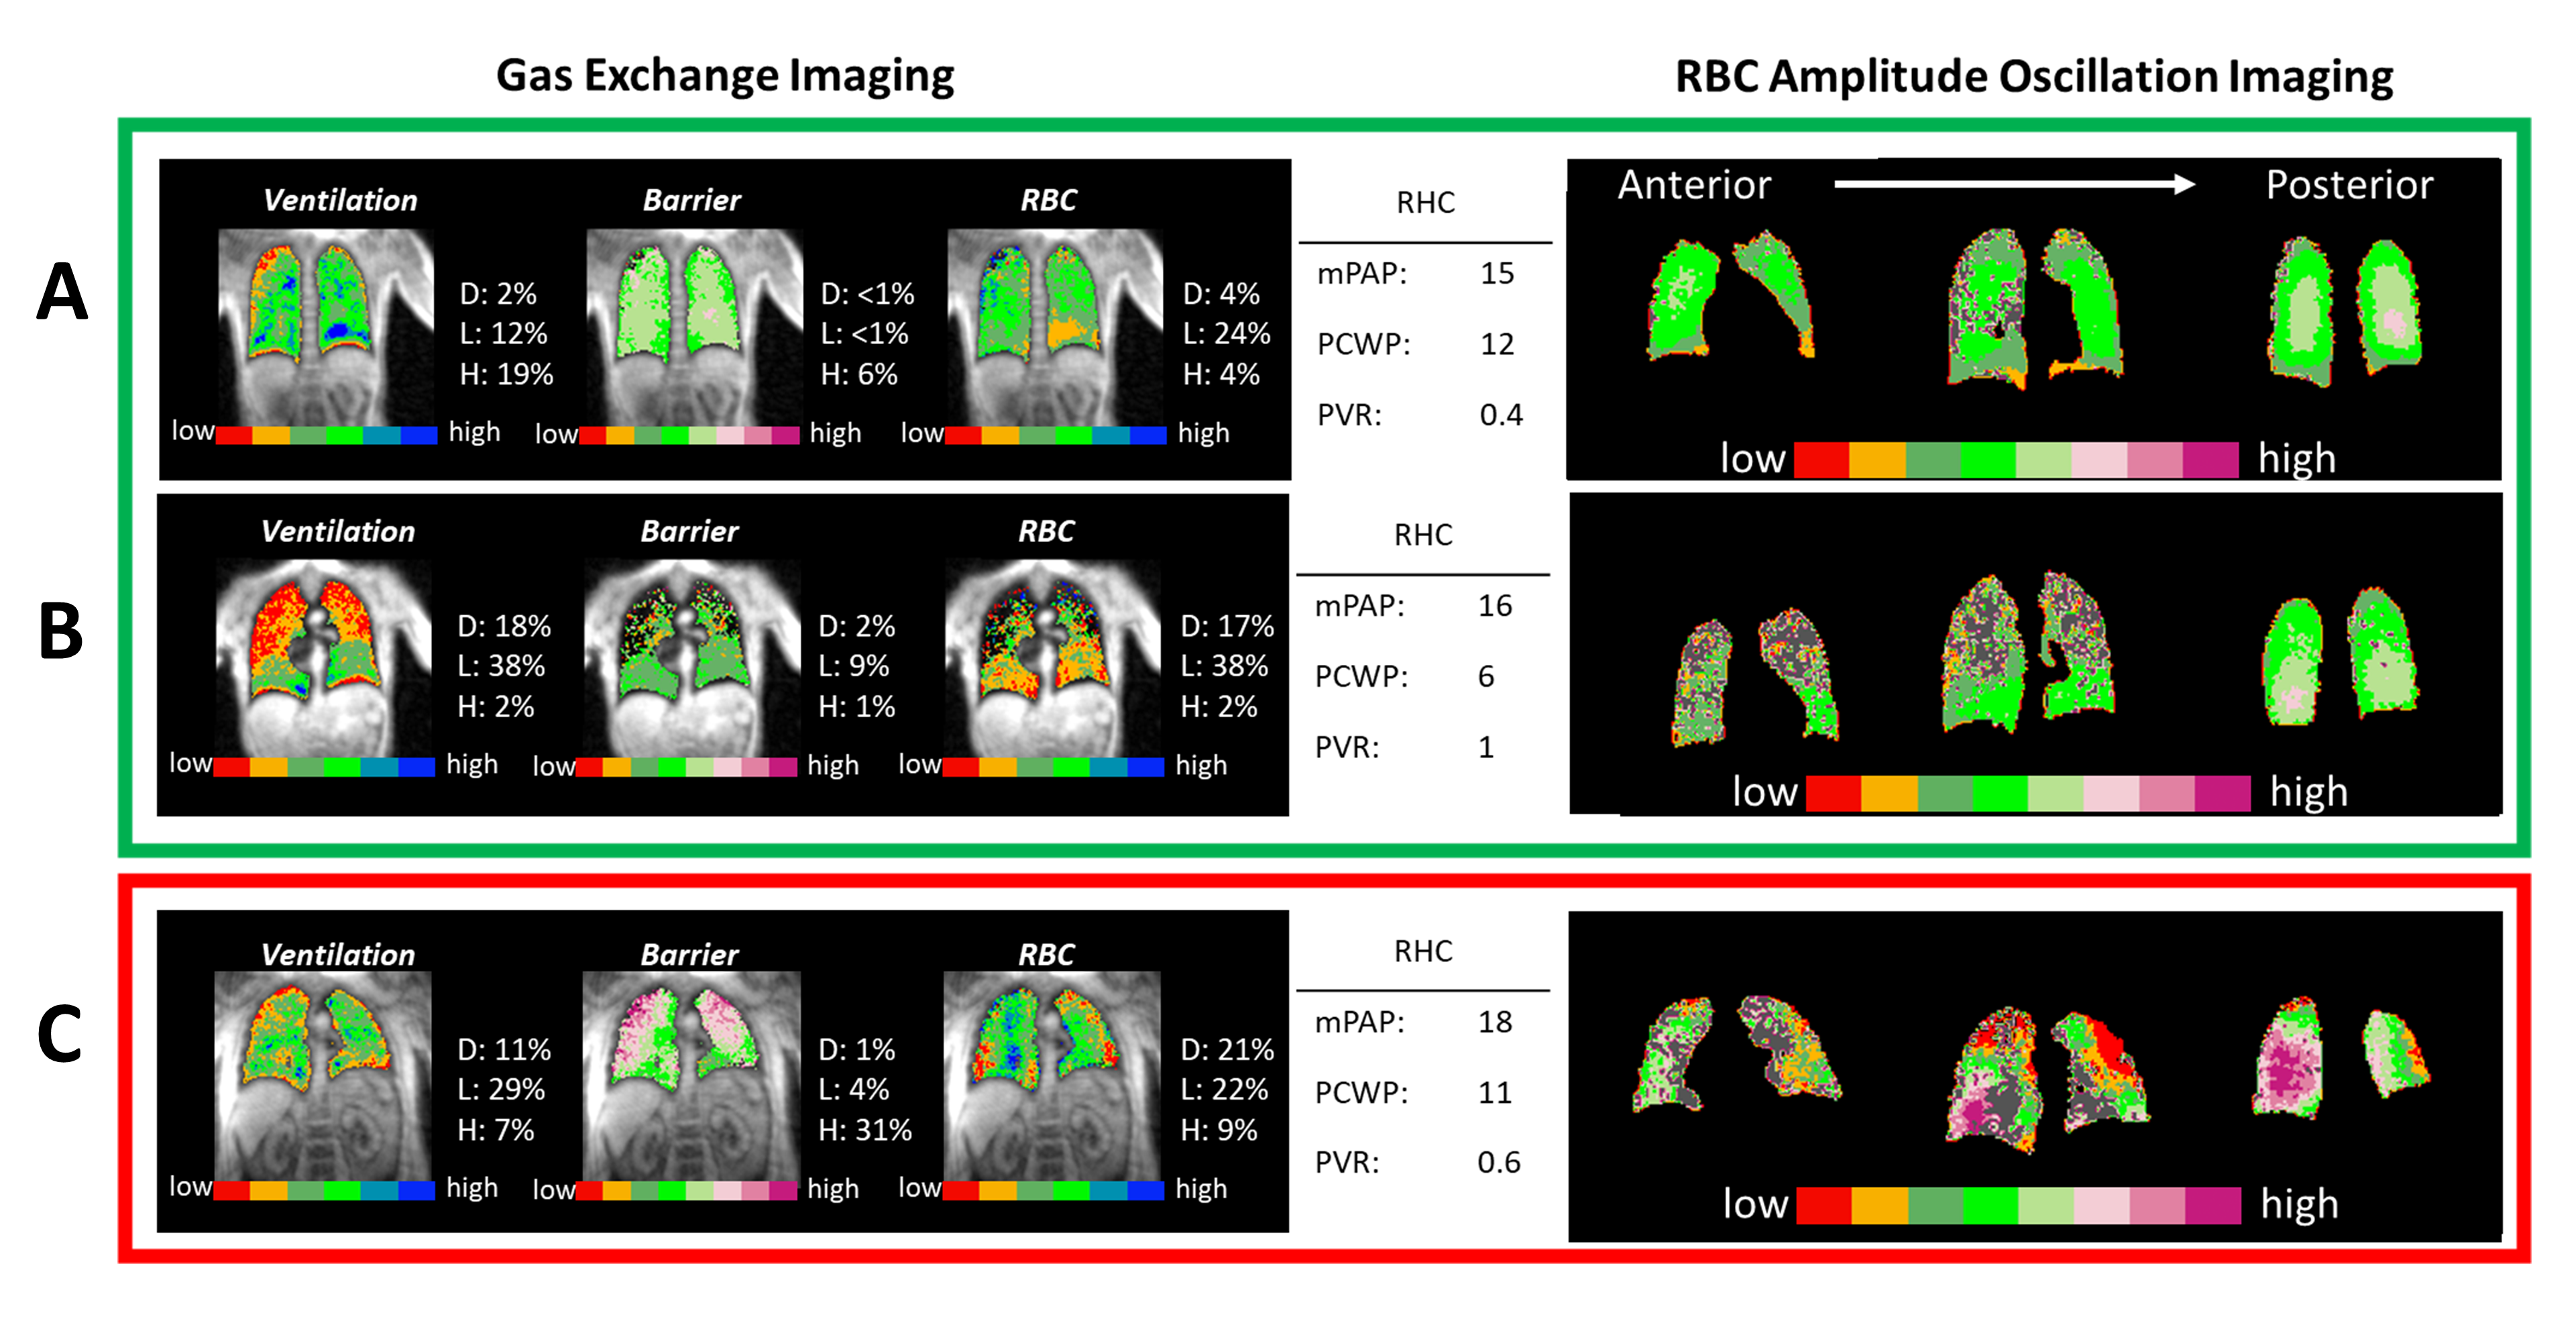
Figure 3. 129Xe gas exchange and oscillation
imaging for test subjects classified by RHC as no PH. Subjects A and B have RBC
amplitude oscillations of 11.8% and 10.9%, correctly classifying both as no PH.
These subject’s oscillation images are homogeneously normal (regions with
inadequate RBC signal for analysis are grey). Subject C is an ILD patient with RBC
oscillations of 13.4%, high barrier uptake, and a preserved chemical shift (217.6
ppm). This leads to incorrect classification of PH-post. However, oscillation
imaging indicates a complex and heterogeneous hemodynamic pattern.
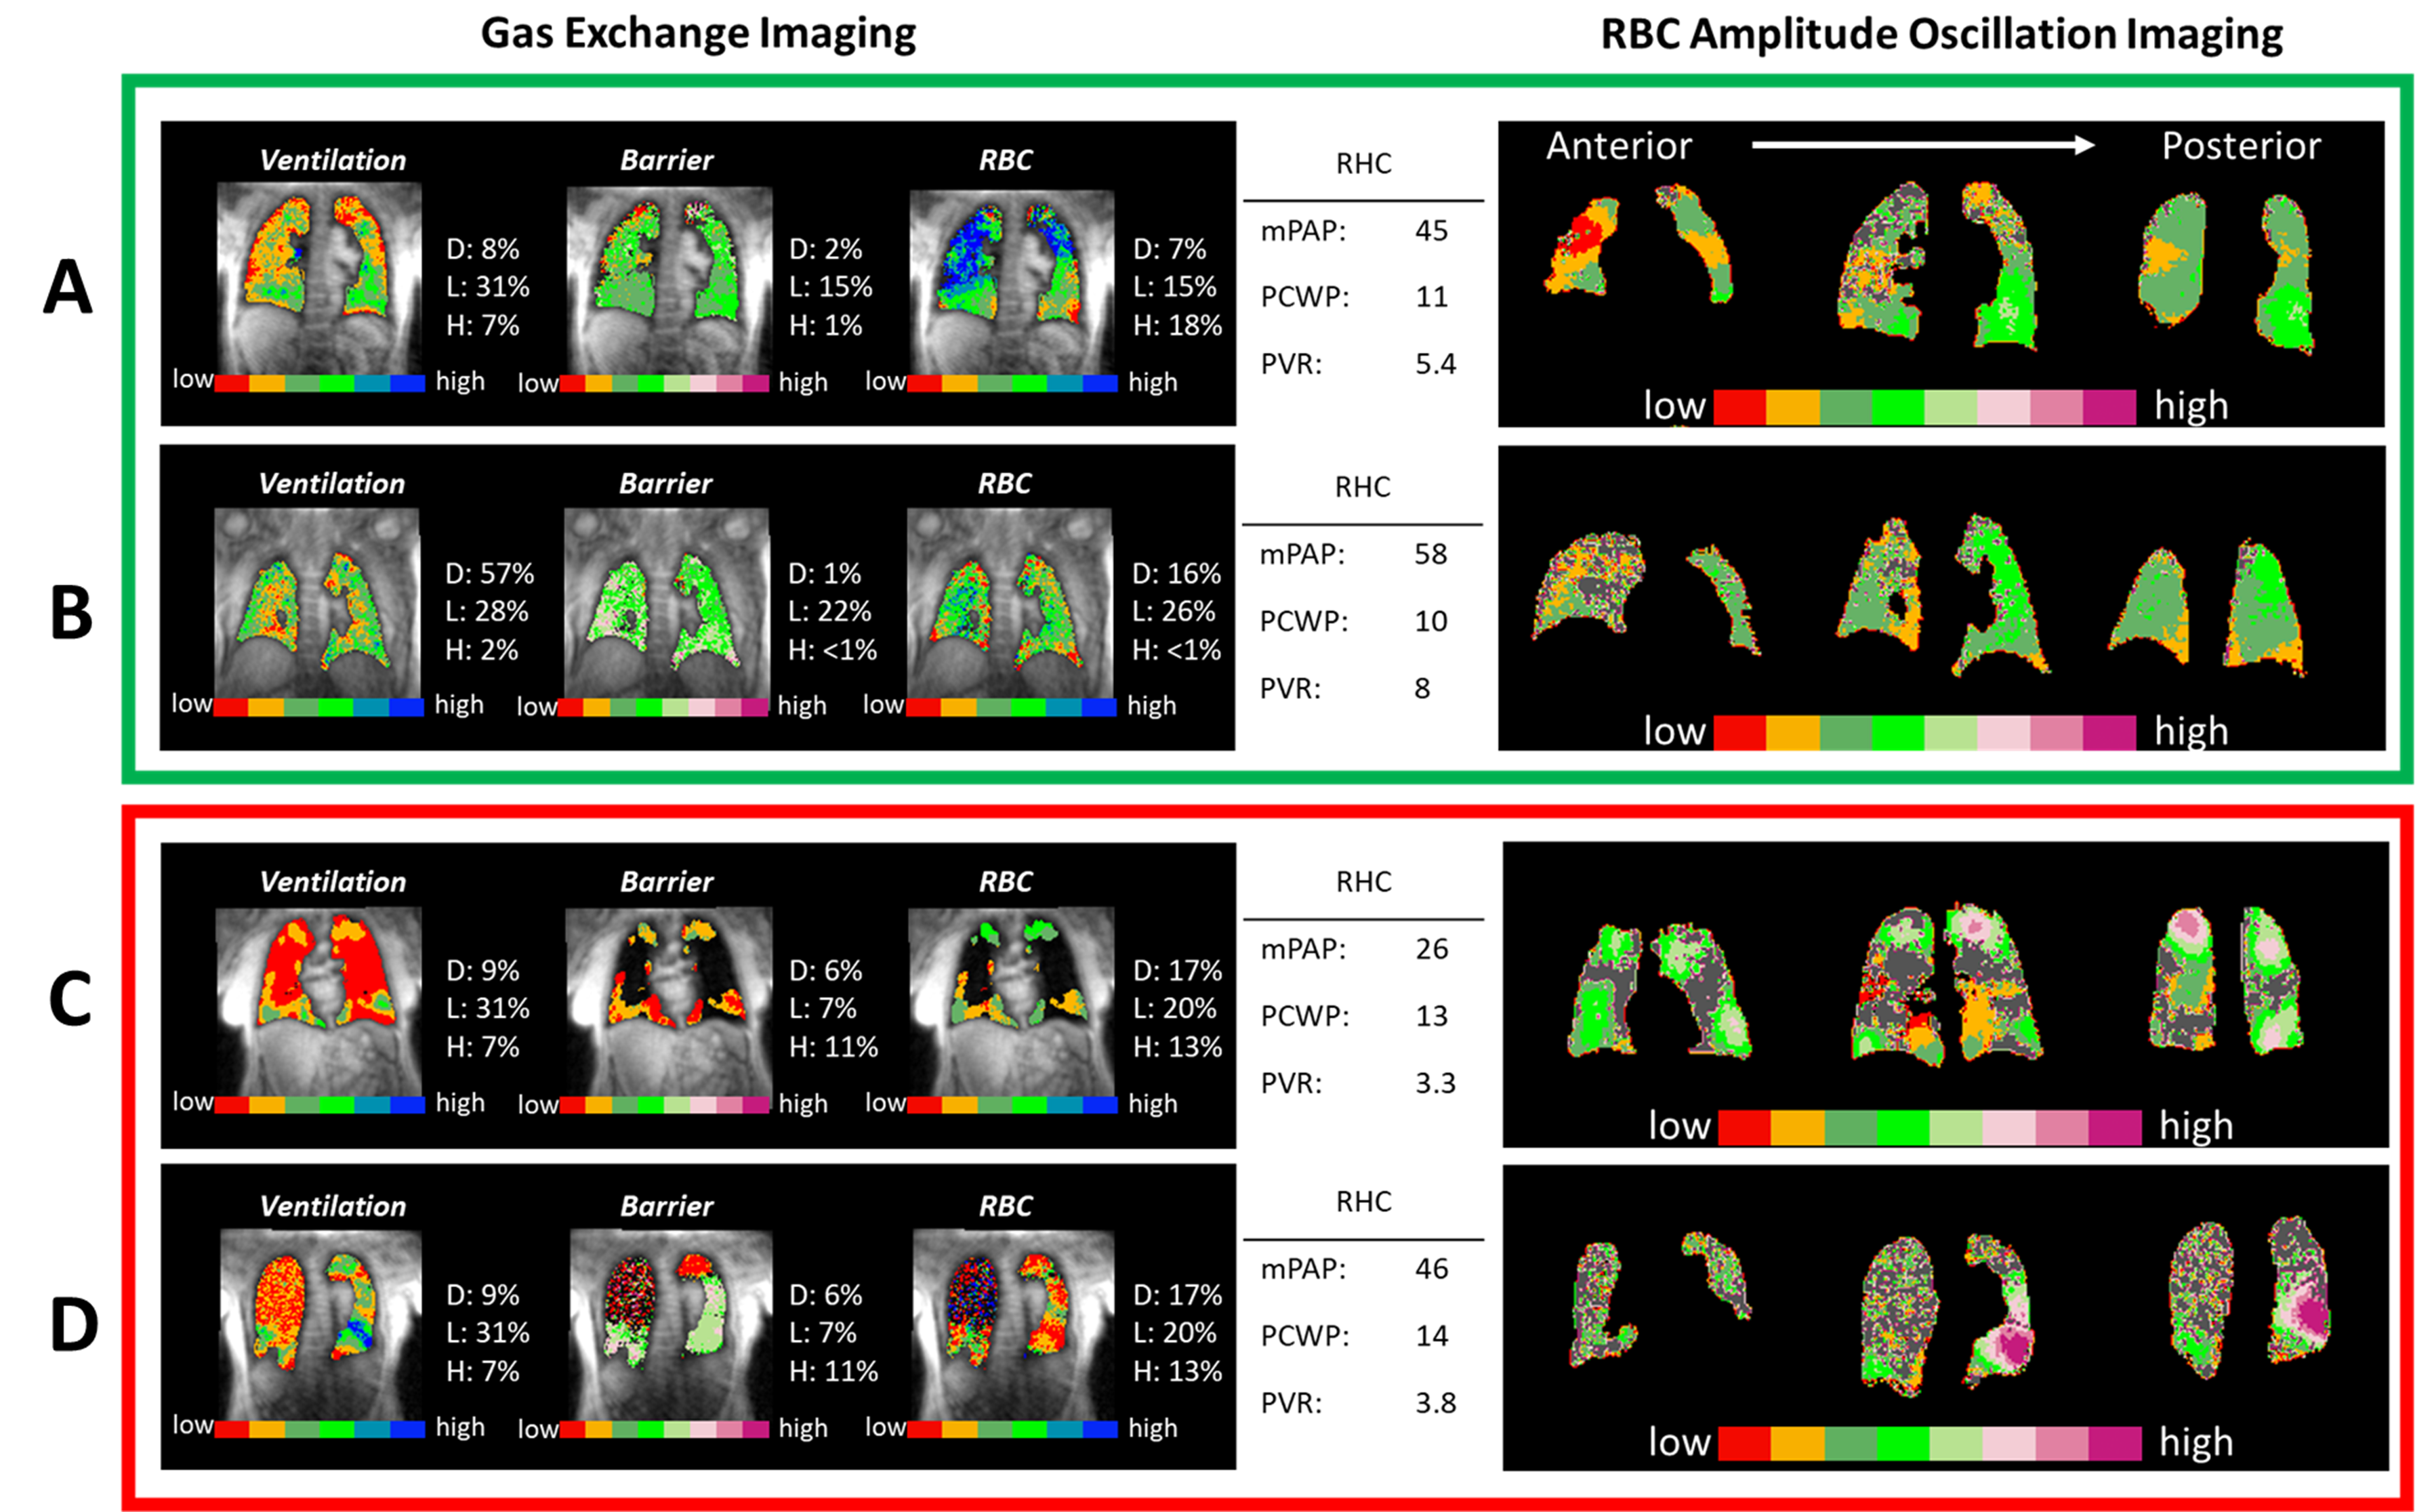
Figure 4. 129Xe gas exchange and RBC oscillation
imaging for test subjects classified by RHC as pre-capillary PH. Subjects A and
B exhibit RBC amplitude oscillations of 5.6%, and 5.4%, and are both properly
classified as PH-pre. These subjects also exhibit regions of low RBC
oscillations on imaging. Subject C and D have RBC oscillation amplitudes of 10.9%
and 9.3% leading the basic algorithm to incorrectly classify both classified as
no PH. These subjects have extensive parenchymal disease and oscillation
imaging is heterogeneous, suggesting PH may be in proportion to lung disease.
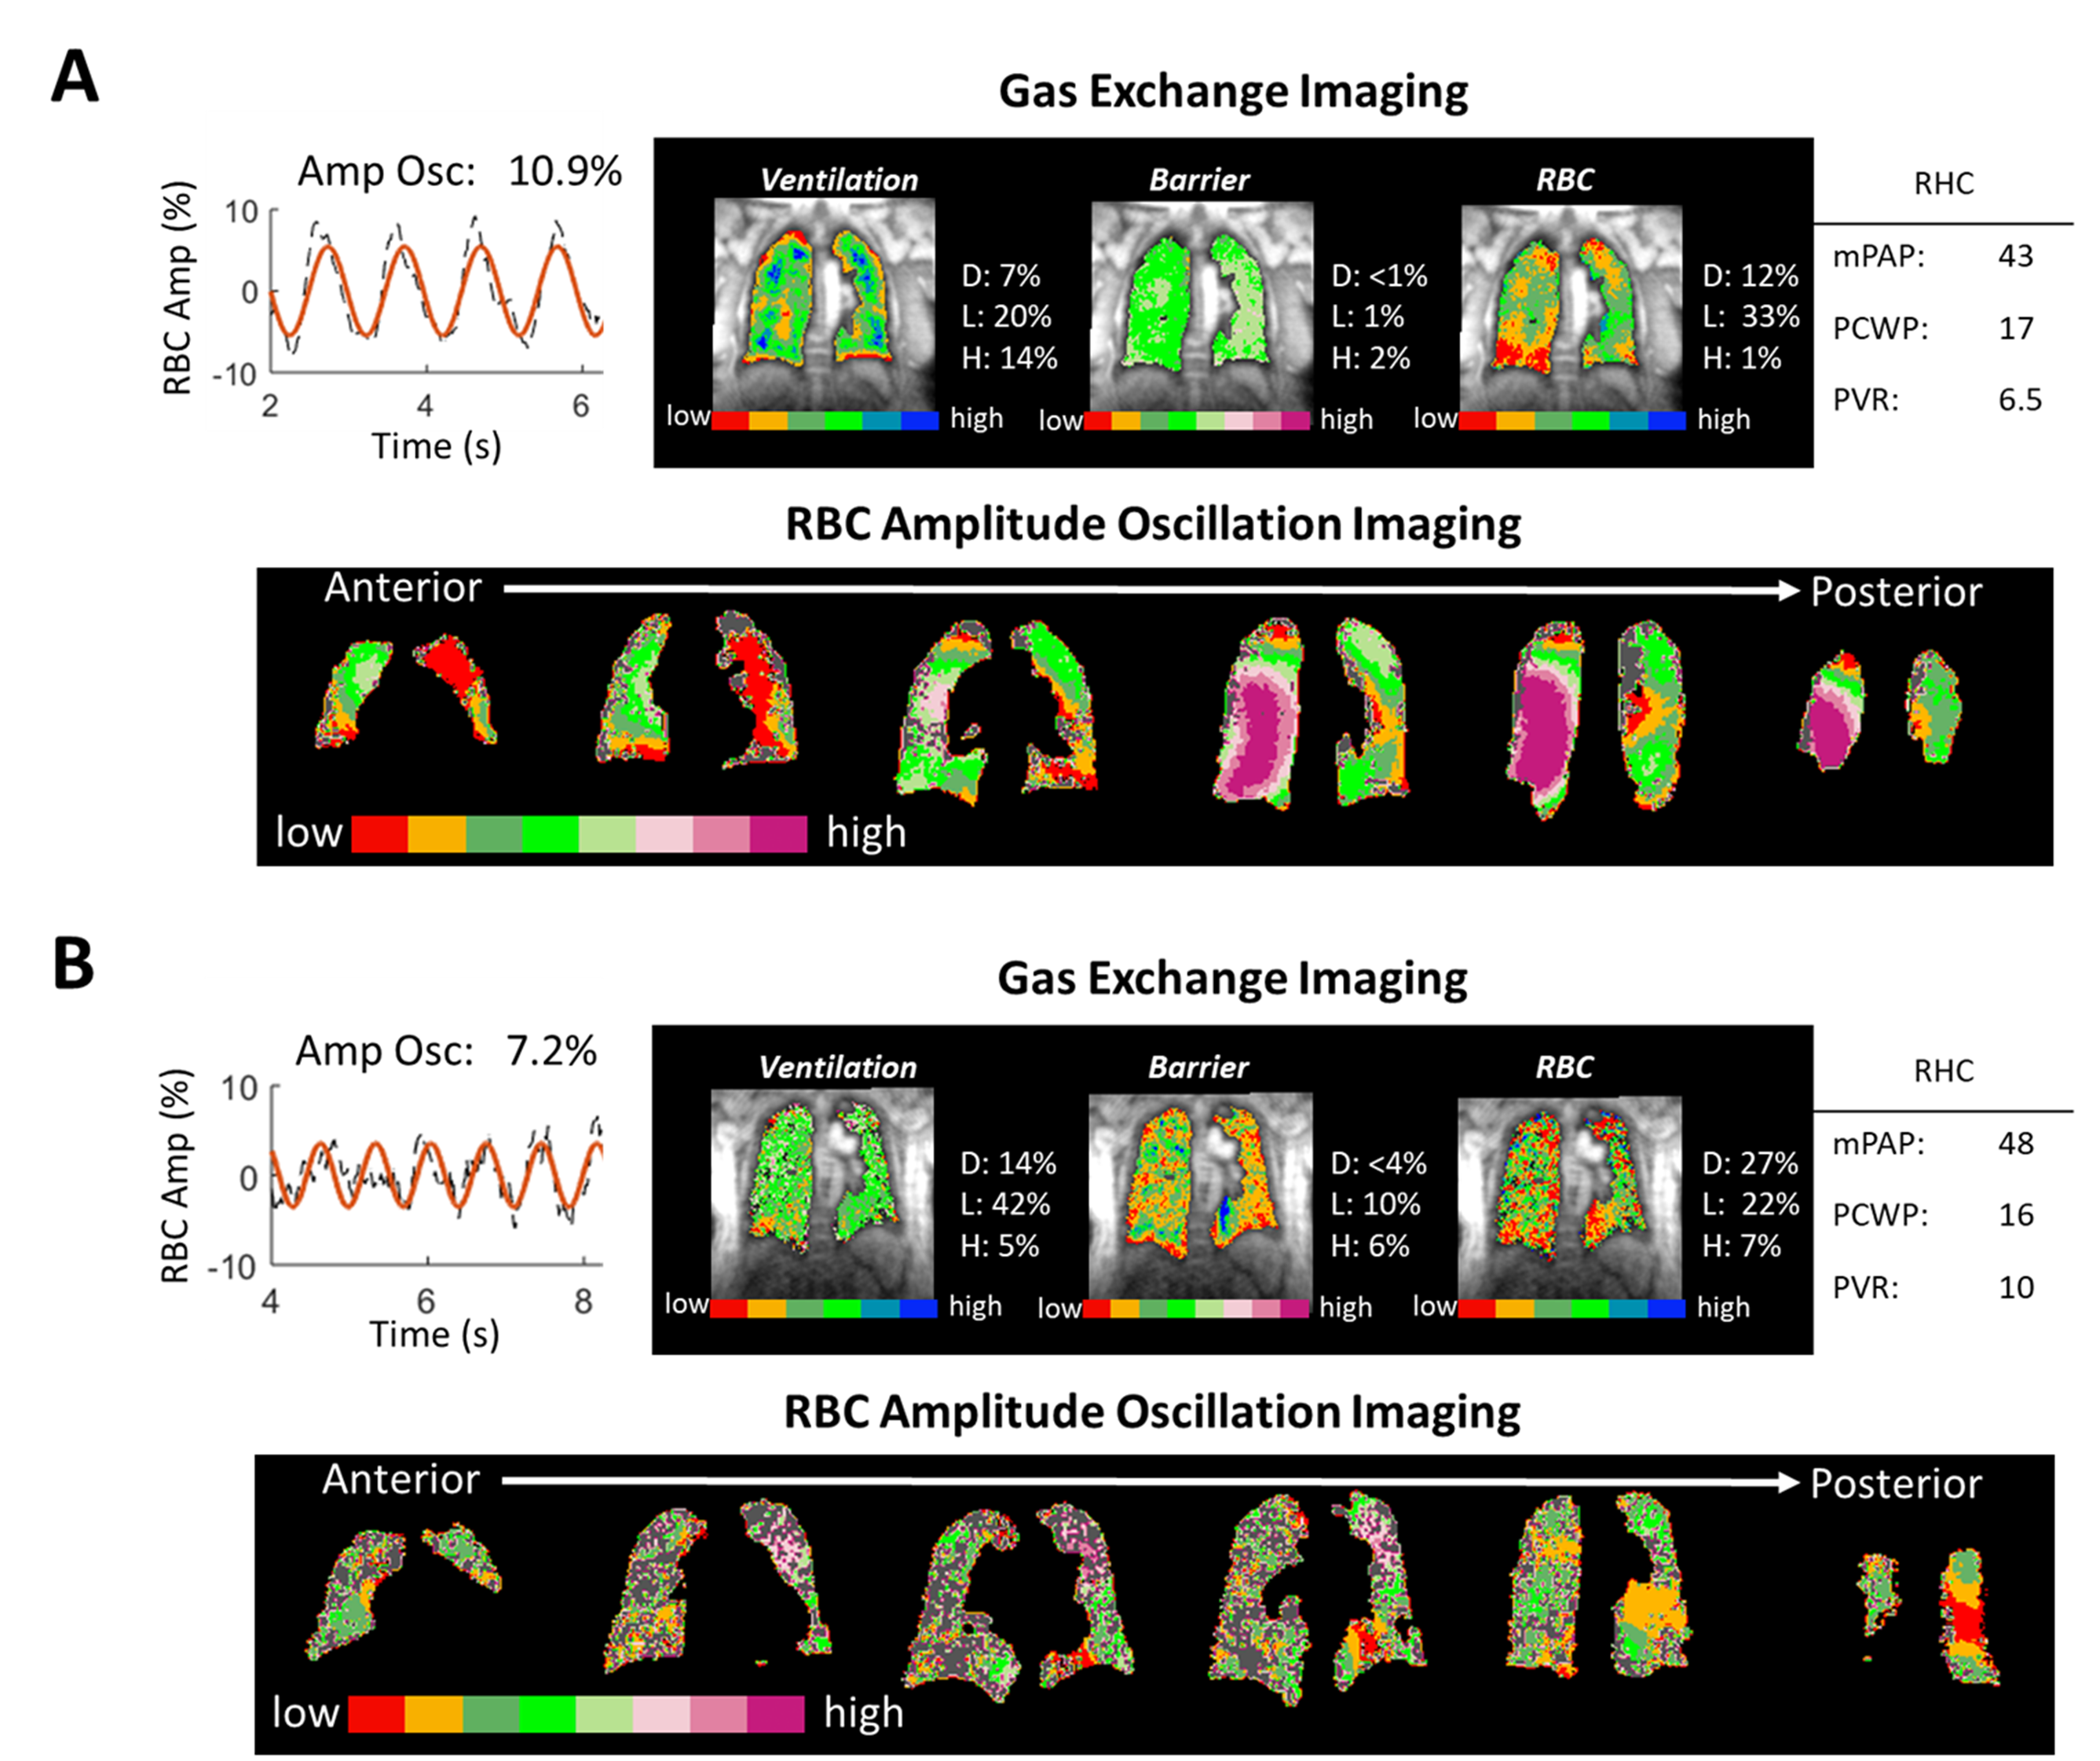
Figure 5. 129Xe MRI/MRS and RBC oscillation imaging
for 2 subjects with CpcPH and no extensive obstructive or interstitial disease.
The conventional algorithm classifies Subject A as no PH, and subject B as precapillary
PH. Oscillation imaging in both subjects indicates regions of both low and high
oscillations. Thus, imaging appears to correctly indicate the presence of both
pre- and postcapillary PH.