0680
Hyperpolarised xenon ventilation MRI in difficult asthma; initial experience in a clinical setting1University of Sheffield, Sheffield, United Kingdom, 2Sheffield Teaching Hospitals, Sheffield, United Kingdom
Synopsis
The ability of hyperpolarised gas MRI to translate into real-world clinical practice is unknown. 129Xe ventilation images were acquired as part of routine care in patients referred from a difficult asthma service, and evaluated by a multi-disciplinary team. Evidence of airways obstruction on MRI can support the use of further treatment, for example in those with normal spirometry and high symptom burden. Well preserved ventilation on MRI alongside poor spirometry and/or symptom control may suggest coexisting breathing control issues or laryngeal disorders. 129Xe MRI can provide additional unique and valuable information in the evaluation of clinical presentations of asthma.
Introduction
Asthma management is based on clinical estimates of severity and pathological phenotypes, however, clinical practice is often made more challenging by discordance between symptoms and tests such as measures of lung function 1. The promise of hyperpolarised gas MRI for the monitoring of lung ventilation in patients with asthma is well established in clinical research studies 2-9, but the ability of the technique to translate into real-world clinical practice is unknown. In 2015 our centre was licenced for the manufacture of hyperpolarised 129Xe gas for clinical lung investigations. In this work we aimed to investigate the use of hyperpolarised 129Xe ventilation MRI in a cohort of patients as part of routine care in a difficult asthma service.Methods
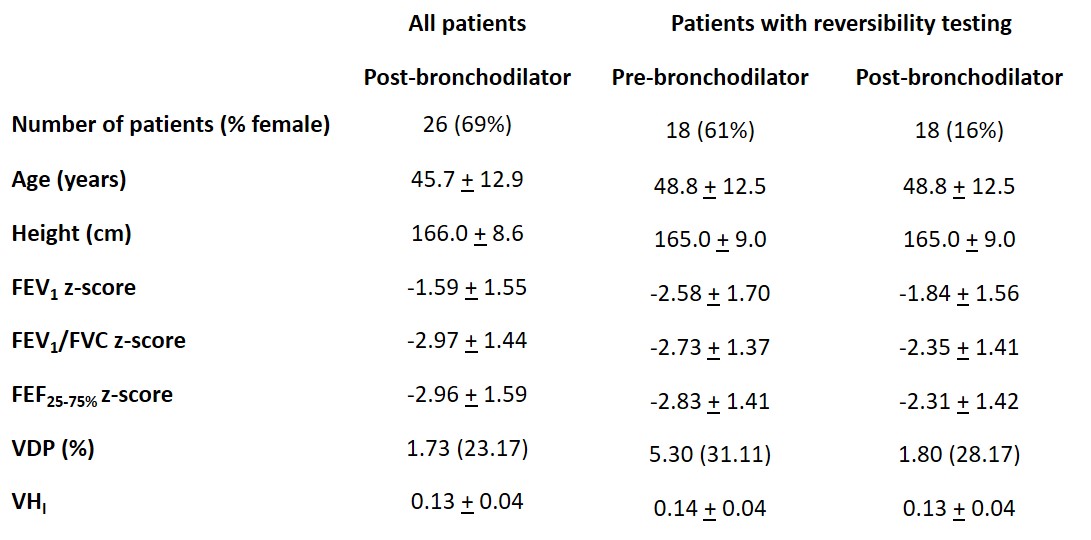
26 patients with difficult to manage asthma were referred from the severe asthma service in Sheffield Teaching Hospitals, UK, on the basis of a clinical hypothesis that visualisation of lung ventilation may support a diagnostic and management process.Patients were scanned using a 1.5T whole body MRI system (GE HDx) and 129Xe transmit-receive vest coil (CMRS). A mix (0.8-1L) of hyperpolarised 129Xe (0.45-0.5L) and N2 was inhaled from functional residual capacity (FRC), with gas volumes determined by patient height. 3D SSFP 129Xe ventilation images 10 were acquired during breath-hold with full lung coverage. 1H anatomical images of the same imaging volume were also acquired. Patients underwent spirometry on the same day where possible. Relevant demographics, asthma phenotype, smoking status, highest blood eosinophil count within a year of the scan, and asthma control questionnaire score (ACQ7) within 3 months of the scan, were obtained from clinical records.
Bronchodilator reversibility testing was carried out on a subset of 18 patients. These patients withheld all inhalers on the morning of the scan. Baseline spirometry and MRI were acquired before inhalation of 400μg of salbutamol, then MRI and spirometry were repeated.
Images were reported by radiologists based upon visual inspection, with minor and substantial ventilation abnormality defined as <5% and >5% of lung involvement respectively. Ventilation defect percentage (VDP) was calculated using semi-automated segmentation 11,12. The ventilation heterogeneity index (VHI) was calculated as the interquartile range of the coefficient of variation of signal intensity in the ventilated lung 13. Images were reviewed by a multi-disciplinary team (MDT) including radiologists, MRI physicists and respiratory clinicians.
Results and Discussion
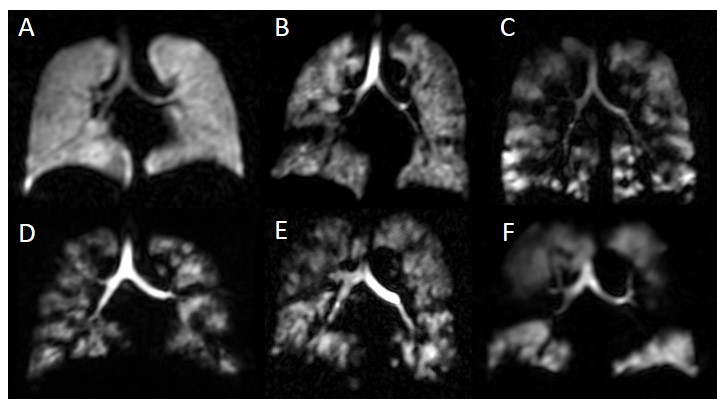
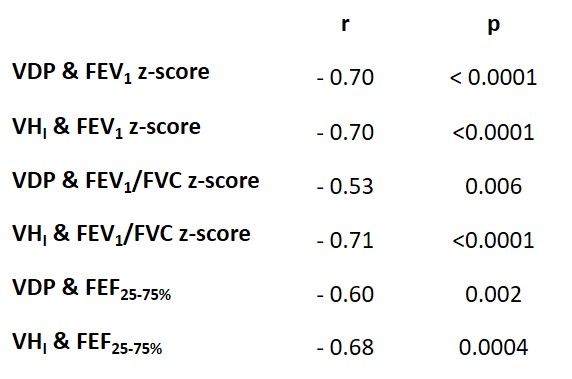
Patients demographics, spirometry and imaging metrics are given in table 1. 21 patients had symptoms of inadequately controlled asthma (ACQ7 > 1.5) and 25 patients were at step 3 or above of the GINA management guidelines. Eight patients had no or minor ventilation defects and 18 patients had substantial ventilation defects (>5% lung involvement). Figure 1 shows example ventilation images.There were moderate-to-strong correlations between MRI and spirometry metrics (table 2). There were no correlations between MRI metrics and ACQ7 or eosinophil count. There were significant differences in FEV1 (p<0.0001), VDP (p=0.0004) and VHI (p=0.0217) following bronchodilator administration. These analyses confirm that established relationships between VDP and spirometry 2,9 and VDP response to bronchodilator 3 exist in a real-world clinical cohort. In contrast to previous studies, there was no correlation between VDP and ACQ7 5,8 or between VDP and eosinophil count 6-8, however, a limitation of the current study was that ACQ7 and eosinophil count were not evaluated on the day of the scan.
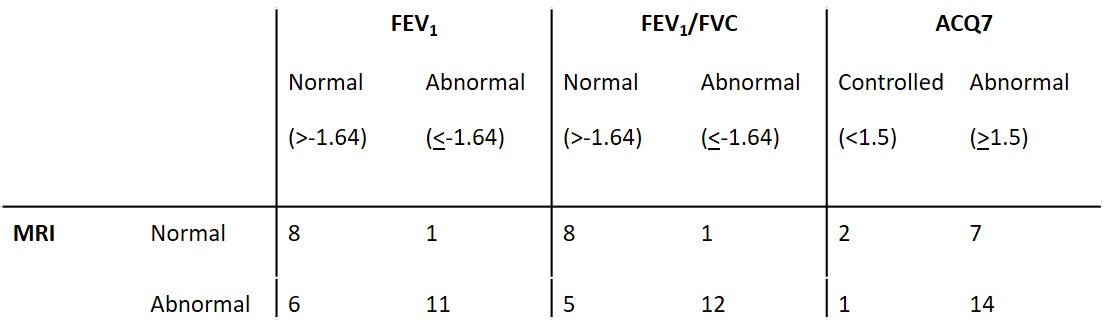
While there was agreement between MRI and spirometry or ACQ7 in the majority of cases, there were 4 patients with normal FEV1 and FEV1/FVC with substantial ventilation defects on MRI, and there were 7 patients with no or minor ventilation defects with symptoms of inadequately controlled asthma (ACQ7 > 1.5).
Case studies:
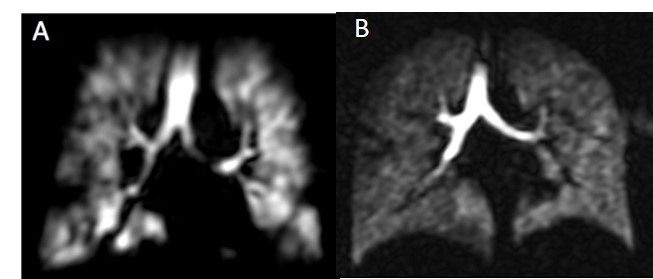
Figure 2a – Ventilation MRI showed small-to-moderate sized ventilation defects with poor reversibility in a patient with consistently normal spirometry, peripheral blood eosinophilia, recurrent symptomatic exacerbations and wheeze, a significant smoking history and who was on maximum standard inhaled therapies. The patient was commenced on mepolizumab, and reported a transformation of their symptoms and no significant exacerbations after 3 months.
Figure 2b – This patient was highly symptomatic with eosinophilia, on long term oral steroids and had failed to respond to treatment with a biologic. MRI showed relatively homogeneous ventilation which prompted re-evaluation for vocal cord dysfunction, and the patient showed a response to speech and language therapy.
Conclusion
129Xe ventilation MRI can provide additional unique and valuable information in the evaluation of clinical presentations of asthma, when undertaken as part of an MDT evaluation of severe disease. Evidence of airways obstruction on MRI can support the use of further treatment in patients where the clinical picture is unclear, for example those with normal spirometry and high symptom burden. Alternatively, well preserved ventilation on MRI alongside poor spirometry and/or symptom control may suggest the possibility of coexisting breathing control issues or laryngeal disorders.Acknowledgements
Medical Research Council grant number MR/M008894/1 for funding.References
1. Haldar P, Pavord ID, Shaw DE, et al. Cluster analysis and clinical asthma phenotypes. Am J Respir Crit Care Med 2008;178:218-24.
2. de Lange EE, Altes TA, Patrie JT, et al. Evaluation of asthma with hyperpolarized helium-3 MRI: correlation with clinical severity and spirometry. Chest 2006;130:1055-62.
3. Costella S, Kirby M, Maksym GN, McCormack DG, Paterson NA, Parraga G. Regional pulmonary response to a methacholine challenge using hyperpolarized (3)He magnetic resonance imaging. Respirology 2012;17:1237-46.
4. Kruger SJ, Niles DJ, Dardzinski B, et al. Hyperpolarized Helium-3 MRI of exercise-induced bronchoconstriction during challenge and therapy. J Magn Reson Imaging 2014;39:1230-7.
5. Svenningsen S, Nair P, Guo F, McCormack DG, Parraga G. Is ventilation heterogeneity related to asthma control? Eur Respir J 2016;48:370-9.
6. Mummy DG, Kruger SJ, Zha W, et al. Ventilation defect percent in helium-3 magnetic resonance imaging as a biomarker of severe outcomes in asthma. J Allergy Clin Immunol 2018;141:1140-1 e4.
7. Svenningsen S, Eddy RL, Lim HF, Cox PG, Nair P, Parraga G. Sputum Eosinophilia and Magnetic Resonance Imaging Ventilation Heterogeneity in Severe Asthma. Am J Respir Crit Care Med 2018;197:876-84.
8. Mummy DG, Carey KJ, Evans MD, et al. Ventilation defects on hyperpolarized helium-3 MRI in asthma are predictive of 2-year exacerbation frequency. J Allergy Clin Immunol 2020;146:831-9 e6.
9. Svenningsen S, Kirby M, Starr D, et al. What are ventilation defects in asthma? Thorax 2014;69:63-71.
10. Stewart NJ, Norquay G, Griffiths PD, Wild JM. Feasibility of human lung ventilation imaging using highly polarized naturally abundant xenon and optimized three-dimensional steady-state free precession. Magn Reson Med 2015;74:346-52.
11. Hughes PJC, Horn FC, Collier GJ, Biancardi A, Marshall H, Wild JM. Spatial fuzzy c-means thresholding for semiautomated calculation of percentage lung ventilated volume from hyperpolarized gas and (1) H MRI. J Magn Reson Imaging 2018;47:640-6.
12. Biancardi A, Acunzo L, Marshall H, Tahir BA, Hughes PJ, Smith L, Weatherley ND, Collier GJ, Wild J. A paired approach to the segmentation of proton and hyperpolarized gas MR images of the lungs. Proc ISMRM 2018, p2442.
13. Hughes PJC, Smith L, Chan HF, et al. Assessment of the influence of lung inflation state on the quantitative parameters derived from hyperpolarized gas lung ventilation MRI in healthy volunteers. J Appl Physiol (1985) 2019;126:183-92.
Figures