0677
Characterization of glycolytic phenotypes using hyperpolarized 13C-MR and [18F]FDG PET in endogenous T-cell lymphomas in mice1Technical University Munich, Nuclear Medicine, Klinikum rechts der Isar, München, Germany, 2Technical University Munich, TranslaTUM, Center for Translational Cancer Research, München, Germany
Synopsis
High- and low- glycolytic phenotypes of murine T-cell lymphoma are characterized using hyperpolarized MR spectroscopy/imaging and [18F]FDG-PET. Differences in pyruvate-to-lactate conversion are found within tumor groups, where PET imaging did not show this distinction. Using tumor metabolic volumes derived from PET imaging on the other hand, it’s possible to distinguish between low- and high-grade tumors. The complementary information of the two modalities gives a more complete view of the characteristics of the glycolytic phenotypes in T-cell lymphoma.
Introduction
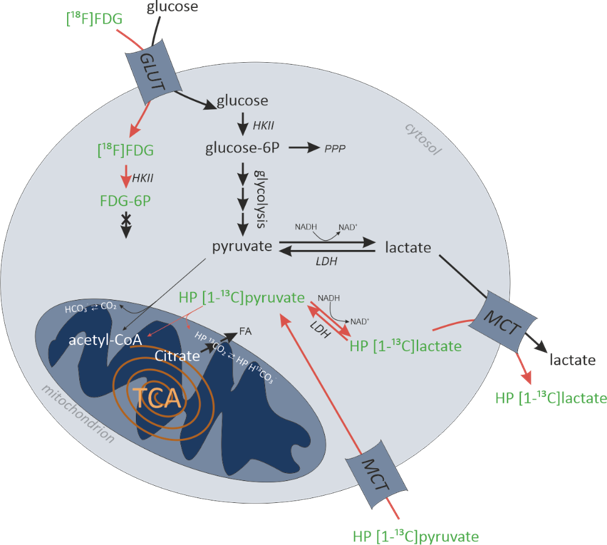
Malignant tissue often shows high levels of utilization and uptake of nutrients like glucose and increased conversion of pyruvate into lactate, even under normoxic conditions (Warburg effect).1 This shift to more anabolic glucose metabolism is needed for invasion and proliferation of tumor cells. More glycolytic phenotypes are associated with invasive cancers. For example, highly glycolytic T-cell non-Hodgkin lymphomas are often aggressive and have poor clinical outcomes.2 Differentiating between tumors with high (HGP) and low (LGP) glycolytic phenotype could benefit planning of immunotherapy treatment and diagnosis.3 Differences in glycolytic phenotypes can be investigated using hyperpolarized (HP) 13C-MR spectroscopy/imaging, and [18F]FDG-PET imaging (Fig.1). Potential differences in uptake and utilization of glucose on one hand, and in pyruvate-to-lactate conversion on the other hand can be detected when combining these modalities. In this study, glycolytic phenotypes of HGP and LGP models of murine T-cell lymphoma are characterized using PET and HP MR measurements.Methods
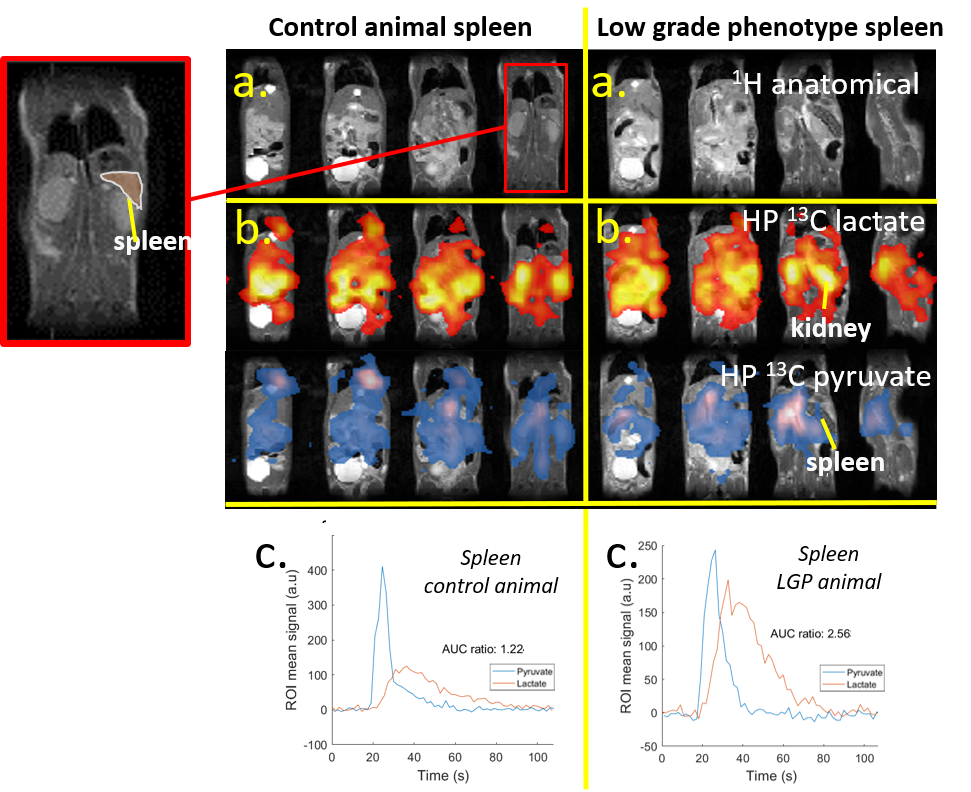
Low-grade (N=13) and high-grade tumor mice (N=10), were measured using both PET and/or MR. Healthy mice (N=11) and healthy mice that received anti-PD antibodies (N=2) were used as controls. After injection of [18F]FDG (~11 MBq), uptake of [18F]FDG in spleen and other organs was imaged using preclinical PET. Blood glucose levels were determined and part of the animals were transferred to a preclinical 7T MRI with 13C/1H dual tuned volume coil (RAPID, ID=31mm). After injection of HP [1-13C]pyruvate (HyperSense, OX063 trityl radical), HP pyruvate and lactate signals were measured dynamically in vivo, using a fast 3D bSSFP sequence4 (Fig.2b). T2-weighted images were acquired for anatomical co-registration and to determine spleen sizes. Diffusion-weighted imaging (DWI) was performed to check for differences in diffusivity. To confirm PET results, biodistribution of [18F]FDG after 1.5h was performed in a separate cohort. After dynamic detection of hyperpolarized pyruvate and lactate images, tumor region ROIs were drawn on the anatomical images (Fig.2a). The corresponding hyperpolarized pyruvate and lactate signals were calculated from the 13C images (Fig.2b) over time and integrated (Fig.2c) to obtain area-under-the-curve ratios.Results
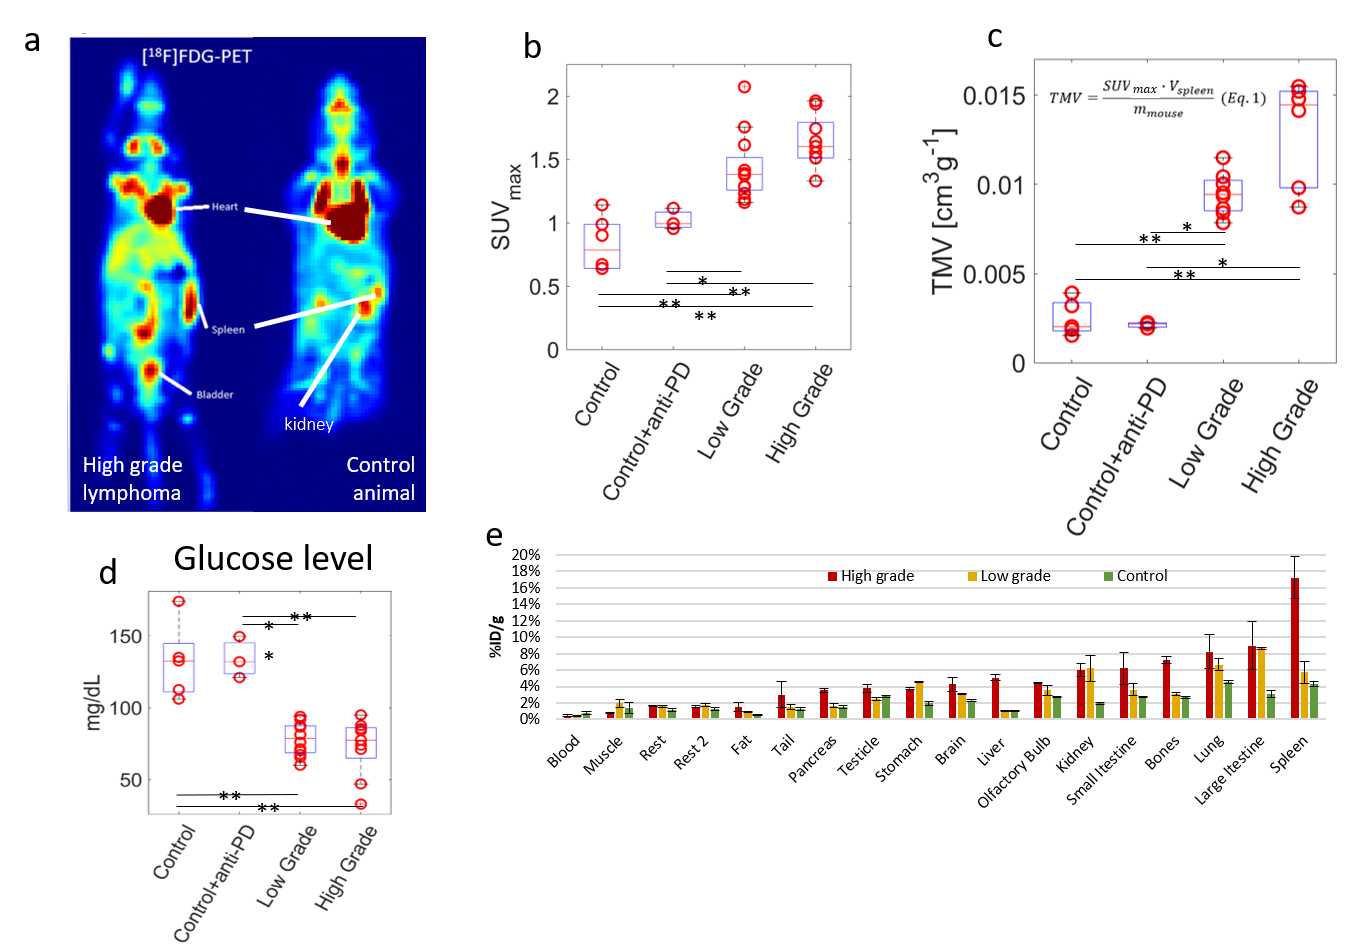
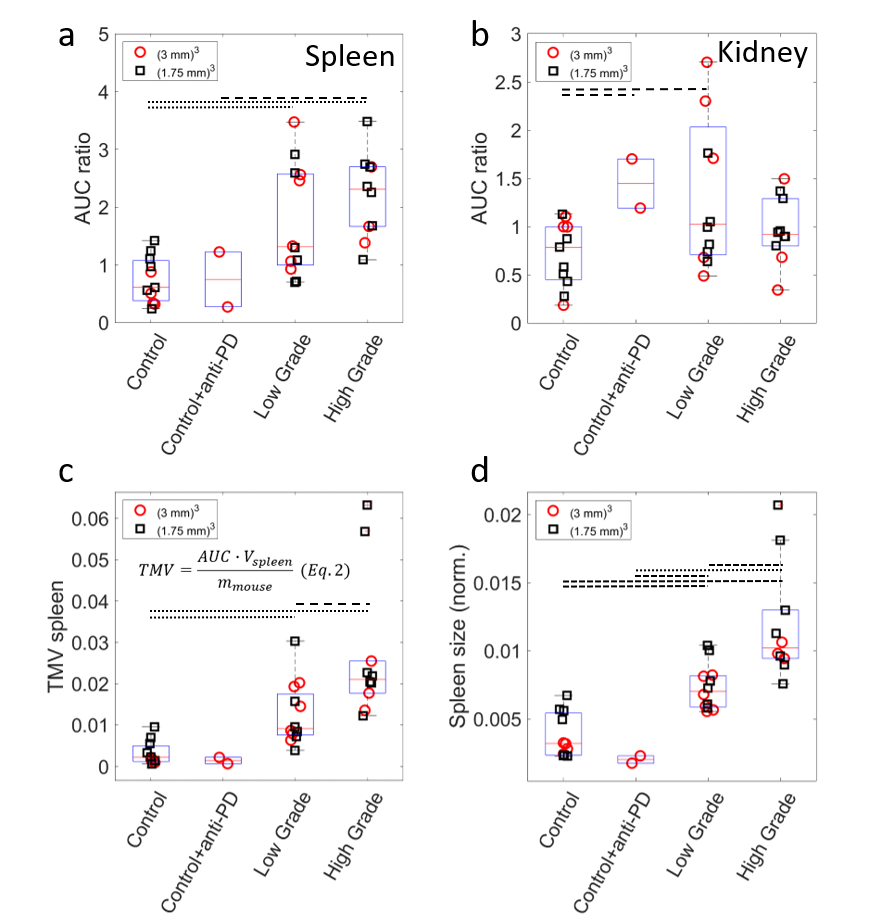
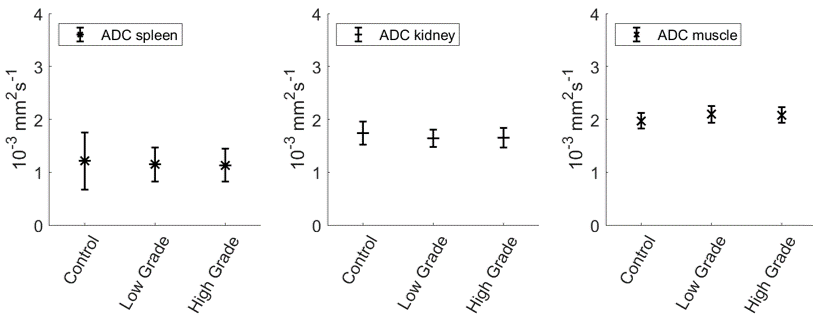
A higher rate of conversion of pyruvate to lactate is observed in the spleens of lymphoma animals (Fig.2c), resulting in significantly higher AUC ratios (Ctrl:0.75±0.40;Ctrl+a:0.75±0.67;LGP:1.76±0.97;HGP: 2.21±0.74, Fig.4a). AUC ratios in kidneys show a larger spread between animals, but a number of low-grade tumor animals show significantly higher values compared to controls (Fig.4b). Spleen sizes of tumor animals are larger compared to control animals and high-grade animals have significantly bigger spleens (Fig.4d). Multiplying AUC ratios by normalized spleen size, generating tumor metabolic volumes (TMV, Fig.4c), results in an even more clear separation of tumor animals and controls, and shows a trend towards higher glycolytic phenotype for higher TMV value. There are no differences in apparent diffusion coefficients (ADC) between tumor animals and controls, and between low- and high-grade tumor animals (Fig.5). Higher uptake of [18F]FDG (Ctrl:0.83±0.21;Ctrl+a:1.02±0.08;LGP:1.43±0.27;HGP:1.64±0.21, Fig.3b) and lower blood glucose levels in tumor animals compared to controls is observed. Higher uptake of [18F]FDG in high grade animals is confirmed ex vivo by biodistribution. By multiplying the SUVmax values with normalized spleen size, TMVs are calculated (Fig 3c).Discussion
Using a fast 3D-bSSFP imaging sequence, we were able to dynamically detect both hyperpolarized pyruvate and lactate. Analyzing the area-under-the-curve ratios of these metabolites showed an increased conversion of pyruvate into lactate in tumor animals compared to controls. The low-grade lymphoma tumors show two groups of AUC values. This effect is also present for the high-grade lymphoma tumors, A possible explanation for this could be a difference in lymphoma content of the spleens. This difference is not seen in the [18F]FDG PET analysis. The 13C-images show high lactate signals in kidney and an increased lactate to pyruvate conversion in spleen, due to the splenic accumulation of T-cell lymphoma cells. Tumor metabolic volumes were calculated from 13C-MR-derived AUC values, in a way similar to TMVs derived from SUV (PET). For the PET-data, also a trend towards higher glycolytic phenotype for higher TMV value is seen. The biodistribution confirms the higher uptake in high-grade tumor animals. No clear difference is seen between low grade animals and controls. A subset of low-grade lymphoma animals shows increased pyruvate to lactate conversion in kidneys as well, suggesting infiltration of lymphoma cells in kidneys. The absence of differences in diffusion values between the different animals shows that the lymphoma cells are distributed in the spleens without significantly influencing the cellularity of the spleen. Tumor-bearing animals show higher uptake of [18F]FDG in spleens, while having lower blood glucose levels. This fits with a higher demand on nutrients, typically seen in highly glycolytic tumors.Conclusions
We characterized glycolytic phenotypes of T-cell lymphoma using HP-MR and PET, and found differences in pyruvate-to-lactate conversion within tumor groups, where PET imaging did not show this separation. On the other hand, using TMVs derived from PET imaging it’s possible to distinguish between low- and high-grade tumors. The complementary information of the two modalities gives a more complete view of the characteristics of the glycolytic phenotypes in T-cell lymphoma.Acknowledgements
We thank Markus Mittelhäuser, Hannes Rolbieski and Sybille Reder for performing the PET measurements and Sandra Sühnel for her help with the animal handling and hyperpolarized substrate injections. This project has received funding from the European Union’s Horizon 2020 research and innovation program under grant agreement No 820374.References
1. Hanahan D, Weinberg R A, Hallmarks of cancer: the next generation. Cell 2011;144
2. Casulo C, O'Connor O, et al. T-cell lymphoma: recent advances in characterization and new opportunities for treatment, J. Natl Cancer Inst. 2016;109:248
3. Wartewig T, Kurgyis Z, Keppler S, et al., PD-1 is a haploinsufficient suppressor of T cell lymphomagenesis, Nature 2017;552:121–125
4. Skinner J G,
Topping G J, Heid I, et al. Fast 3D
hyperpolarized 13C metabolic MRI at 7T using spectrally selective
bSSFP. Digital Poster at ISMRM2020 International Conference 2020
Figures